This independent 185-page report guarantees you will remain better informed than your competitors. With 130+ tables and figures examining the Thermal EOR market space, the report gives you a visual, one-stop breakdown of your market as well as analysis, from 2018-2028 keeping your knowledge that one step ahead allowing you to succeed. This report will ensure that you do. Visiongain’s report will ensure that you keep informed and ahead of your competitors. Gain that competitive advantage.
The Thermal EOR Market Forecast 2018-2028 responds to your need for definitive market data:
Read on to discover how you can exploit the future business opportunities emerging in this sector. Visiongain’s new study tells you and tells you NOW.
In this updated report, you find 130+ in-depth tables, charts and graphs all unavailable elsewhere.
The 185-page report provides clear detailed insight into the global Thermal EOR market. Discover the key drivers and challenges affecting the market.
By ordering and reading our report today you stay better informed and ready to act.
Report Scope
The report delivers considerable added value by revealing:
• 130+ tables, charts and graphs analysing and revealing the growth prospects and outlook for the Thermal EOR Market.
Reasons why you must order and read this report today:
1. The report provides SPENDING ($) and PRODUCTION (bbl/d) forecasts (2018-2028), plus analysis, for 11 regional and national markets, providing unique insight into thermal EOR Market development:
• China Thermal EOR Forecast 2018-2028
• Canada Thermal EOR Forecast 2018-2028
• Russia Thermal EOR Forecast 2018-2028
• Oman Thermal EOR Forecast 2018-2028
• Bahrain Thermal EOR Forecast 2018-2028
• Indonesia Thermal EOR Forecast 2018-2028
• Venezuela Thermal EOR Forecast 2018-2028
• Saudi Arabia Thermal EOR Forecast 2018-2028
• U.S. Thermal EOR Forecast 2018-2028
• Kuwait Thermal EOR Forecast 2018-2028
• Rest of the World Thermal EOR Forecast 2018-2028
2. The report also offers PRODUCTION forecasts (2018-2028) for the two major thermal EOR extraction methods
• Steam Injection
• Steam-Assisted Gravity Drainage
3. The report also offers Visiongain’s oil price forecast for the period between 2018 and 2028
• Supply-side factors
• Demand-side factors
• Other Major Variables that Impact the Oil Price
• Visiongain’s Oil Price Assumption and Forecast
• How the Oil Price Will Impact the Thermal EOR Market
4. Tables and analysis profiling the top companies in the thermal EOR business:
• Major thermal EOR Project Operators in oil sands
• Major thermal EOR operators in heavy oil
5. Companies Analysed in This Report
• Cenovus
• Suncor
• ConocoPhillips
• Imperial Oil
• CNOOC
• Chevron
• Husky Energy
• PDVSA
• Sinopec
• Occidental
• Conclusions and recommendations which will aid decision-making
How will you benefit from this report?
• Keep your knowledge base up to speed. Don’t get left behind
• Reinforce your strategic decision-making with definitive and reliable market data
• Learn how to exploit new technological trends
• Realise your company’s full potential within the market
• Understand the competitive landscape and identify potential new business opportunities & partnerships
• Details of top projects for each extraction method (Steam Injection, Steam-Assisted Gravity Drainage, Other) as well as detailing over 40 projects around the world
Who should read this report?
• Anyone with involvement in oil/ gas production
• Energy price reporting companies
• Energy company managers
• Energy consultants
• Oil and gas company executives and analysts
• Heads of strategic development
• Business development managers
• Marketing managers
• Market analysts,
• Technologists
• Suppliers
• Investors
• Banks
• Government agencies
Visiongain’s study is intended for anyone requiring commercial analyses for the thermal EOR market and leading companies. You find data, trends and predictions.
Buy our report today the Thermal Enhanced Oil Recovery (EOR) Market Report 2018-2028: CAPEX & OPEX ($bn) & Production (bpd) Forecasts for Oil Sands, Heavy Oil, Steam Injection (Cyclic Steam Stimulation (CSS), Steam Flooding), Steam-Assisted Gravity Drainage (SAGD) & Other Technologies Plus Detailed Project Tables & Analysis of Leading Companies Avoid missing out by staying informed – get our report now.
Visiongain is a trading partner with the US Federal Government
CCR Ref number: KD4R6
1. Report Overview
1.1. Global Thermal Enhanced Oil Recovery (EOR) Market Overview
1.2. Market Structure Overview and Market Definition
1.3. Methodology
1.4. Why You Should Read This Report
1.5. How This Report Delivers
1.6. Key Questions Answered by this Analytical Report Include
1.7. Who is this Report For?
1.8. Frequently Asked Questions (FAQ)
1.9. Associated Visiongain Reports
1.10. About Visiongain
2. Introduction to the Thermal EOR Market
2.1. Stages of Oil Extraction
2.1.1. Primary Recovery
2.1.2. Secondary Recovery
2.1.3. Tertiary Recovery
2.2. Thermal EOR Processes
2.2.1. Steam Injection
2.2.1.1 Steam Flooding
2.2.1.2 Cyclic Steam Stimulation
2.2.2. Steam-Assisted Gravity Drainage
2.2.3. Small-Scale Commercial EOR Technologies
2.2.3.1 In-Situ Combustion
2.2.3.2 Thermally Assisted Gas-Oil Gravity Drainage (TAGOGD)
2.2.3.3 Thermal-Assisted Gravity Drainage (TAGD)
2.2.3.4 Toe-to-Heel Air Injection (THAI)
2.2.3.5 Solar EOR
2.2.3.6 Electro-Thermal Dynamic Stripping Process (ET-DSP)
2.2.3.7 Synchronised Thermal Additional Recovery (STAR)
2.2.4. Other Thermal EOR Technologies
2.2.4.1 Expanding Solvent Steam-Assisted Gravity Drainage (ES-SAGD)
2.2.4.2 Steam and Gas Push (SAGP)
2.2.4.3 Controlled Atmospheric Pressure Resin Infusion (CAPRI)
2.2.4.4 Combustion Overhead Gravity Drainage
2.3. Unconventional Oil and the Thermal EOR Market
2.3.1. Heavy Oil
2.3.2. Oil Sands
2.4. Thermal EOR Economics
3. The Global Thermal EOR Market 2018-2028
3.1. Global Thermal EOR Market Forecast 2018-2028
3.1.1. Capital and Operational Expenditure Forecasts
3.1.2. Production Forecast
3.2. Global Thermal EOR Market Analysis
3.3. Visiongain’s Oil Price Analysis
3.3.1. Visiongain’s Oil Price Analysis
3.3.1.1 Supply-Side Factors
3.3.1.1.1 Tight Oil
3.3.1.1.2 OPEC
3.3.1.2 Demand-Side Factors
3.3.1.2.1 Chinese and Indian Growth
3.3.1.2.2 Western Stagnation
3.3.1.3 Other Major Variables that Impact the Oil Price
3.3.1.3.1 North Africa
3.3.1.3.2 Russia
3.3.1.3.3 US Shale
3.3.1.3.4 Iran
3.4. Drivers and Restraints in the Thermal EOR Market
3.4.1. Thermal EOR Market Drivers
3.4.1.1 Increasing Oil Demand
3.4.1.2 Unconventional Oil
3.4.2. Thermal EOR Market Restraints
3.4.2.1 High Costs
3.4.2.2 Transportation Issues
3.4.2.3 Environmental Concerns
3.4.2.4 Carbon Taxation
4. Thermal EOR Submarkets 2018-2028
4.1. Will the Oil Sands or Other Areas Provide the Strongest Growth?
4.1.1. The Oil Sands Thermal EOR Submarket Forecast 2018-2028
4.1.1.1 Current and Future In-Situ Oil Sands Production
4.1.1.2 Regulatory Climate
4.1.1.3 New and Alternative Transportation Solutions
4.1.1.4 Narrowing Price Differential Between WTI and WCS
4.1.1.5 Stricter Foreign Investment/ Regulations
4.1.1.6 High Water Demand
4.1.2. The Thermal Heavy Oil EOR Submarket Forecast 2018-2028
4.1.2.1 Heavy Oil Potential
4.1.2.2 Global heavy Oil Resources
4.1.2.3 Current and Future Growth Areas
4.1.2.4 Potential restraints on the Thermal Steam Heavy Oil Market
4.2. Which Technology Submarket Will Provide the Strongest Growth?
4.2.1. The Steam Injection Submarket Forecast 2018-2028
4.2.1.1 Leading Global Steam Injection Projects
4.2.1.2 Duri
4.2.1.3 Cold Lake
4.2.1.4 Primrose
4.2.1.5 Shengli
4.2.1.6 Midway-Sunset
4.2.2. The SAGD Submarket Forecast 2018-2028
4.2.21 Leading Global SAGD Projects
4.2.2.2 Firebag
4.2.2.3 Foster Creek and Christina Lake
4.2.2.4 Mukhaizna
4.2.2.5 Jackfish
4.2.3. Other EOR Technologies Submarket Forecast 2018-2028
4.2.3.1 Leading Global Other EOR Projects
4.2.3.2 Qarn Alam
4.2.3.3 Saleski Pilot
5. The Leading National Thermal EOR Market Forecasts
5.1. The Canadian Thermal EOR Market Forecast 2018-2028
5.1.1. The Canadian Thermal EOR Market Overview
5.1.2. Current Canadian Projects
5.1.2.1 Thermal Oil Sands Dominating the Market
5.1.2.2 Thermal heavy Oil Development Supplementing Oil Sands Growth
5.1.2.3 New Oil Sands Projects Scrapped
5.2. The U.S. Thermal EOR Market Forecast 2018-2028
5.2.1. The U.S. Thermal EOR Market Overview
5.2.2. California Continues to Dominate Thermal EOR Projects
5.2.3. Future Outlook – Traditional Thermal EOR to Continue Decreasing
5.3. The Venezuelan Thermal EOR Market Forecast 2018-2028
5.3.1. The Venezuelan Thermal EOR Market Overview
5.3.2. Current Projects
5.3.3. Future Outlook
5.3.3.1 Political and Economic Problems and the Need for Investment
5.3.3.2 PDVSA Focusing on Short-Term EOR Production Increases at Mature Fields
5.3.3.3 Long-Term Opportunities for EOR Production in the Orinoco Belt
5.4. The Indonesian Thermal EOR Market Forecast 2018-2028
5.4.1. The Indonesian Thermal EOR Market Overview
5.4.2. Current Projects
5.4.3. Drivers and Restraints in the Indonesian Thermal EOR Market
5.5. The Kuwaiti Thermal EOR Market Forecast 2018-2028
5.5.1. The Kuwaiti Thermal EOR Market Overview
5.5.2. Chevron’s Project in the Wafra Field
5.5.3. Future Outlook
5.5.3.1 KOC to Develop the Lower Fars Heavy Oil Field
5.5.3.2 Challenges to Meeting Kuwait’s Ambitious Production Goals
5.6. The Omani Thermal EOR Market Forecast 2018-2028
5.6.1. The Omani Thermal EOR Market Overview
5.6.2. Current Projects
5.6.2.1 PDO’s Thermal EOR Projects
5.6.2.2 Occidental’s SAGD Operation at the Mukhaizna Field
5.6.3. Future Outlook
5.6.3.1 PDO’s Ambitious Ten-Year Expansion Plan
5.6.3.2 Potential to Expand the Mukhaizna Project and Opportunities in the Neighbouring Kahmah Reservoir
5.6.3.3 The Prospects for Solar EOR in Oman
5.7. The Chinese Thermal EOR Market Forecast 2018-2028
5.7.1. The Chinese Thermal EOR Market Overview
5.7.2. Current Thermal EOR Projects in China
5.7.3. Steady Increases Forecast in the Chinese Thermal EOR Market
5.8. The Russian Thermal EOR Market Forecast 2018-2028
5.8.1. The Russian Thermal EOR Market Overview
5.8.2. Current Projects
5.8.3. Future Outlook
5.9. The Bahraini Thermal EOR Market Forecast 2018-2028
5.9.1. The Bahraini Thermal EOR Market Outlook
5.10. The Saudi Arabian Thermal EOR Market Forecast 2018-2028
5.10.1. The Saudi Arabian Thermal EOR Market Overview
5.10.2. Chevron’s Project in the Wafra Field
5.10.3. Future Outlook
5.11. The Rest of the World Thermal EOR Market Forecast 2018-2028
5.11.1. Challenges and Opportunities in the Egyptian Thermal EOR Market
5.11.2. Brazil’s Overlooked Thermal EOR Market
5.11.2.1 Current Projects and Future Outlook
5.11.2.2 Petrobras’ Stretched Financial Position
5.11.3. Dutch Thermal EOR Market
5.11.4. Steady Thermal EOR Production from India
5.11.5. Tiny Thermal EOR Production from Germany
5.11.6. A Long History of Thermal EOR Production in Trinidad
6. PEST Analysis of the Thermal EOR Market 2018-2028
6.1. PEST Analysis
7. The Leading Companies in the Thermal EOR Market
7.1. The Five Leading Companies in the Thermal Oil Sands EOR Market Shares and Profiles
7.1.1. Suncor
7.1.2. ConocoPhillips
7.1.3. Imperial Oil
7.1.4. Cenovus
7.1.5. China National Offshore Oil Corporation (CNOOC)
7.2. The Five Leading Companies in the Thermal Heavy Oil EOR Market – Market Shares and Profiles
7.2.1 Chevron Corporation
7.2.2. PDVSA
7.2.3. Husky Energy
7.2.4. Sinopec
7.2.5. Occidental
7.2.6. Other Leading Companies in the Thermal EOR Market
8. Conclusions and Recommendations
8.1. EOR Market Outlook
8.2. Key Findings in the Thermal EOR Market
8.3. Recommendations for the Thermal EOR Market
9. Glossary
Associated Visiongain Reports
Visiongain Report Sales Order Form
Appendix A
Appendix B
Visiongain report evaluation form
List of Tables
Table 1.1 Comparison of Oil Grading By Leading International Agencies (⁰API, Viscosity cP)
Table 3.1 Global Thermal EOR Market Forecast 2018-2028 ($bn, AGR %, CAGR %, Cumulative)
Table 3.2 Leading National Thermal EOR Market Forecast 2018-2028 (Spending $m, AGR %)
Table 3.3 Global Thermal EOR Market Forecast CAPEX and OPEX 2018-2028 ($bn, AGR %, Cumulative)
Table 3.4 Global Thermal EOR Market Production Forecast 2018-2028 (MMbpd, AGR %)
Table 3.5 Global Thermal EOR Market Forecast 2018-2028 ($bn, AGR %, CAGR %, Cumulative)
Table 4.1 Oil Sands and Non-Oil Sands Submarket Forecasts 2018-2028 ($m, MMbpd, AGR%)
Table 4.2 thermal EOR in Oil Sands Forecast 2018-2028 (CAPEX and OPEX $m, AGR %, CAGR %, Cumulative)
Table 4.3 Thermal Heavy Oil Forecast 2018-2028 (Production MMbpd, CAPEX and OPEX $m, AGR %, CAGR %)
Table 4.4 Thermal EOR Submarket Forecasts 2018-2028 (MMbpd, $m, AGR %, Cumulative)
Table 4.5 Steam Injection Submarket Forecast 2018-2028 (CAPEX and OPEX $m, AGR %, CAGR %, Cumulative)
Table 4.6 Top 5 Steam Injection Projects (Company, Project, bpd, Country, Resource)
Table 4.7 SAGD Submarket Forecast 2018-2028 (Production (mbpd), CAPEX and OPEX $m, AGR %, CAGR %, Cumulative)
Table 4.8 Top 5 SAGD Projects (Company, Project, bpd, Country, Resource)
Table 4.9 Other EOR Technology Submarket Forecast 2018-2028 (CAPEX and OPEX $m, AGR %, CAGR %, Cumulative)
Table 4.10 Top 2 Other EOR Technologies Projects (Company, Project, bpd, Country, Resource)
Table 5.1 Leading National Thermal EOR Market Forecast 2018-2028 (Spending $m, AGR %)
Table 5.2 Canadian Thermal EOR Market Forecast 2018-2028 (MMbpd production, CAPEX and OPEX $m, AGR %, CAGR %)
Table 5.3 Operational Thermal Oil Sands Projects (Company Name, Project Name, Technology, BPD Capacity, Current BPD)
Table 5.4 Canadian Thermal Heavy Oil Market Forecast 2018-2028 (Mbpd production, CAPEX and OPEX $m, AGR %, CAGR %)
Table 5.5 Operational Canadian Thermal Heavy Oil Projects (Company Name, Project Name, Technology, BPD Capacity, Current BPD)
Table 5.6 Planned Thermal Oil Sands Projects (Company Name, Project Name, Technology, bpd Capacity, Start Date)
Table 5.7 US Thermal EOR Market Forecast 2018-2028 (Mbpd Production, CAPEX and OPEX $m AGR %, CAGR %)
Table 5.8 U.S. Thermal EOR Production (Company, Project Location, Production [bpd], Technology)
Table 5.9 Venezuelan Thermal EOR Market Forecast 2018-2028 (Mbpd production, CAPEX and OPEX $m, AGR %, CAGR %)
Table 5.10 Venezuelan Thermal EOR Production (Company, Project Location, Production [bpd], Technology)
Table 5.11 Indonesian Thermal EOR Market Forecast 2018-2028 (Mbpd production, CAPEX and OPEX $m, AGR %, CAGR %)
Table 5.12 Kuwaiti Thermal EOR Market Forecast 2018-2028 (Mbpd production, CAPEX and OPEX $m, AGR %, CAGR %)
Table 5.13 Omani Thermal EOR Market Forecast 2018-2028 (Mbpd production, CAPEX and OPEX $m, AGR %, CAGR %)
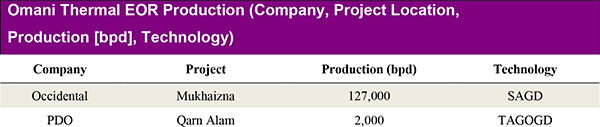
Table 5.14 Omani Thermal EOR Production (Company, Project Location, Production [bpd], Technology)
Table 5.15 Chinese Thermal EOR Market Forecast 2018-2028 (Mbpd production, CAPEX and OPEX $m, AGR %, CAGR %)
Table 5.16 Russian Thermal EOR Market Forecast 2018-2028 (Mbpd production, CAPEX and OPEX $m, AGR %, CAGR %)
Table 5.17 Bahraini Thermal EOR Market Forecast 2018-2028 (Mbpd production, CAPEX and OPEX $m, AGR %, CAGR %)
Table 5.18 Saudi Arabian Thermal EOR Market Forecast 2018-2028 (Mbpd production, CAPEX and OPEX $m, AGR %, CAGR %)
Table 5.19 Rest of the World Thermal EOR Market Forecast 2018-2028 (Mbpd production, CAPEX and OPEX $m, AGR %, CAGR %)
Table 6.1 PEST Analysis of the Thermal EOR Market 2018-2028
Table 7.1 Five Leading Companies in the Thermal Oil Sands EOR Market (Rank, 2017 Spending $m, Market Share %)
Table 7.2 Overview of Suncor in the Thermal Oil Sands EOR Market (Headquarters, CEO, Address, Website, Total Company Revenue 2017 ($m), Business Segments, No. of Employees, IR Contact, Ticker, Thermal Oil Sands EOR Spending ($m) 2017, Thermal Oil Sands EOR Market Share (%) 2017, Market Rank)
Table 7.3 Overview of ConocoPhillips in the Thermal Oil Sands EOR Market(Headquarters, CEO, Address, Website, Total Company Revenue 2017 ($m), Business Segments, No. of Employees, IR Contact, Ticker, Thermal Oil Sands EOR Spending ($m) 2017, Thermal Oil Sands EOR Market Share (%) 2017, Market Rank)
Table 7.4 Overview of Imperial Oil in the Thermal Oil Sands EOR Market (Headquarters, CEO, Address, Website, Total Company Revenue 2017 ($m), Business Segments, No. of Employees, IR Contact, Ticker, Thermal Oil Sands EOR Spending ($m) 2017, Thermal Oil Sands EOR Market Share (%) 2017, Market Rank)
Table 7.5 Overview of Cenovus in the Thermal Oil Sands EOR Market (Headquarters, CEO, Address, Website, Total Company Revenue 2017 ($m), Business Segments, No. of Employees, IR Contact, Ticker, Thermal Oil Sands EOR Spending ($m) 2017, Thermal Oil Sands EOR Market Share (%) 2017, Market Rank)
Table 7.6 Overview of CNOOC in the Thermal Oil Sands EOR Market (Headquarters, CEO, Address, Website, Total Company Revenue 2017 ($m), Business Segments, No. of Employees, IR Contact, Ticker, Thermal Oil Sands EOR Spending ($m) 2017, Thermal Oil Sands EOR Market Share (%) 2017, Market Rank)
Table 7.7 Five Leading Companies in the Thermal Oil Sands EOR Market (Rank, 2017 Spending $m, Market Share %)
Table 7.8 Overview of Chevron in the Thermal Heavy Oil EOR Market (Headquarters, CEO, Address, Website, Total Company Revenue 2017 ($m), Business Segments, No. of Employees, IR Contact, Ticker, Thermal Oil Sands EOR Spending 2017 ($m), Thermal Oil Sands EOR Market Share (%), Market Rank)
Table 7.9 Overview of PDVSA in the Thermal Heavy Oil EOR Market (Headquarters, CEO, Website, No. of Employees, Thermal Oil Sands EOR Spending ($m) in 2017, Thermal Oil Sands EOR Market Share (%) in 2017, Market Rank)
Table 7.10 Overview of Husky Energy in the Thermal Heavy Oil EOR Market (Headquarters, CEO, Address, Website, Total Company Revenue 2017 ($m), Business Segments, No. of Employees, IR Contact, Ticker, Thermal Oil Sands EOR Spending 2017 ($m), Thermal Oil Sands EOR Market Share (%), Market Rank)
Table 7.11 Overview of Sinopec in the Thermal Heavy Oil EOR Market (Headquarters, CEO, Address, Website, Total Company Revenue 2017 ($m), Business Segments, No. of Employees, IR Contact, Ticker/ Securities Code, Thermal Oil Sands EOR Spending 2017 ($m), Thermal Oil Sands EOR Market Share (%), Market Rank)
Table 7.12 Overview of Occidental Petroleum in the Thermal Heavy Oil EOR Market (Headquarters, CEO, Address, Website, Total Company Revenue 2017 ($m), Business Segments, No. of Employees, IR Contact, Ticker/ Securities Code, Thermal Oil Sands EOR Spending 2017 ($m), Thermal Oil Sands EOR Market Share (%), Market Rank)
Table 7.13 Other Leading Companies in the Thermal EOR Market (Company, Sector, Technology)
List of Figures
Figure 1.1 Oil Sands Forecast 2000-2040 ($m, AGR %)
Figure 1.2 Global Thermal EOR Market Structure Overview
Figure 2.1 USGS Survey of Global Heavy Oil Resources by Region (Billion Barrels)
Figure 2.2 World Map of Bitumen Reserves (Million Barrels of Bitumen)
Figure 3.1 Global Thermal EOR Market Forecast 2018-2028 ($bn, AGR %)
Figure 3.2 Global Thermal EOR Market and Submarket CAGRs (%), 2018-2023, 2023-2028 and 2018-2028
Figure 3.3 Global Thermal EOR Market and Technology Submarket CAGRs (%), 2018-2023, 2023-2028 and 2018-2028
Figure 3.4 Total Spending by Leading National Thermal EOR Markets, 2018-2028 ($bn)
Figure 3.5 Global Thermal EOR Market CAPEX Forecast 2018-2028 ($bn, AGR %)
Figure 3.6 Global Thermal EOR Market OPEX Forecast 2018-2028 ($bn, AGR %)
Figure 3.7 Global Thermal EOR Market Production Forecast 2017-2027 (MMbpd, AGR %)
Figure 3.8 WTI and Brent Oil Prices 2000-2017 ($/bbl)
Figure 3.9 Chinese and Indian Annual GDP Growth Rates, 2008-2017 (%)
Figure 4.1 Thermal EOR Submarket Production Share Forecasts, 2018 (%)
Figure 4.2 Thermal EOR Submarket Production Share Forecasts, 2023 (%)
Figure 4.3 Thermal EOR Submarket Production Share Forecasts, 2028 (%)
Figure 4.4 Thermal EOR Submarket Forecasts 2018-2028 ($m)
Figure 4.5 Thermal EOR Submarket Spending Share, 2018 (%)
Figure 4.6 Thermal EOR Submarket Spending Share, 2023 (%)
Figure 4.7 Thermal EOR Submarket Spending Share, 2028 (%)
Figure 4.8 Thermal EOR in Oil Sands Forecast 2018-2028 ($m, AGR %)
Figure 4.9 Thermal EOR in Oil Sands Market Share Forecast 2018, 2023 and 2028 (% Share)
Figure 4.10 Thermal EOR in Oil Sands Production Forecast 2018-2028 (MMbpd, AGR %)
Figure 4.11 Thermal EOR in Oil Sands CAPEX and OPEX Forecasts, 2018-2028 ($m)
Figure 4.12 Benchmark Oil Prices, 2008 to 2018 ($/bbl)
Figure 4.13 Map of US Petroleum Administration for Defense Districts (PADD)
Figure 4.14 Thermal Heavy Oil Forecast 2018-2028 ($m, AGR %)
Figure 4.15 Thermal Heavy Oil Market Share Forecast 2018, 2023 and 2028 (% Share)
Figure 4.16 Thermal Heavy Oil Production Forecast 2018-2028 (MMbpd, AGR %)
Figure 4.17 Thermal Heavy Oil CAPEX and OPEX Forecasts, 2018-2028 ($m)
Figure 4.18 USGS Survey of Global Heavy Oil Resources by Region (Billion Bbls)
Figure 4.19 Thermal EOR Technology Submarket Production Share Forecasts, 2018 (%)
Figure 4.20 Thermal EOR Technology Submarket Production Share Forecasts, 2023 (%)
Figure 4.21 Thermal EOR Technology Submarket Production Share Forecasts, 2028 (%)
Figure 4.22 Thermal EOR Technology Submarket Spending Forecasts 2018-2028 ($m)
Figure 4.23 Thermal EOR Technology Submarket Spending Share, 2018 (%)
Figure 4.24 Thermal EOR Technology Submarket Spending Share, 2023 (%)
Figure 4.25 Thermal EOR Technology Submarket Spending Share, 2028 (%)
Figure 4.26 Steam Injection Submarket Forecast 2018-2028 ($m, AGR %)
Figure 4.27 Steam Injection Submarket Share Forecast 2018, 2023 and 2028 (% Share)
Figure 4.28 Steam Injection Submarket Production Forecast 2018-2028 (MMbpd, AGR %)
Figure 4.29 Steam Injection Submarket CAPEX and OPEX Forecasts, 2018-2028 ($m)
Figure 4.30 SAGD Submarket Forecast 2018-2028 ($m, AGR %)
Figure 4.31 SAGD Submarket Share Forecast 2018, 2023 and 2028 (% Share)
Figure 4.32 SAGD Submarket Production Forecast 2018-2028 (MMbpd, AGR %)
Figure 4.33 SAGD Submarket CAPEX and OPEX Forecasts, 2018-2028 ($m)
Figure 4.34 Other EOR Technology Submarket Forecast 2018-2028 ($m, AGR %)
Figure 4.35 Other EOR Technology Submarket Share Forecast 2018, 2023 and 2028 (% Share)
Figure 4.36 Other EOR Technology Submarket Production Forecast 2018-2028 (MMbpd, AGR %)
Figure 4.37 Other EOR Technology Submarket CAPEX and OPEX Forecasts, 2018-2028 ($m)
Figure 5.1 Leading National Thermal EOR Markets Share Forecast, 2018-2028 (%)
Figure 5.2 Leading National Thermal EOR Markets Share Forecast, 2018 (%)
Figure 5.3 Leading National Thermal EOR Markets Share Forecast, 2023 (%)
Figure 5.4 Leading National Thermal EOR Markets Share Forecast, 2028 (%)
Figure 5.5 Leading National Thermal EOR Markets CAGR Forecast, 2018-2028 (%)
Figure 5.6 Leading National Thermal EOR Markets Cumulative Spending Forecast 2018-2028 ($m)
Figure 5.7 Canadian Thermal EOR Market Forecast 2018-2028 ($m, AGR %)
Figure 5.8 Canadian Thermal EOR Market Share Forecast, 2018, 2023 and 2028 (% Share)
Figure 5.9 Canadian Oil Sands Deposits in Alberta
Figure 5.10 Canadian Thermal Heavy Oil Market Forecast 2018-2028 ($m, AGR %)
Figure 5.11 Canadian Thermal Heavy Oil Market Share Forecast, 2018, 2023 and 2028 (% Share)
Figure 5.12 U.S. Thermal EOR Market Forecast 2018-2028 ($m, AGR %)
Figure 5.13 US Thermal EOR Market Share Forecast, 2018, 2023 and 2028
Figure 5.14 Thermal EOR Production by State in 2017 (bpd)
Figure 5.15 Venezuelan Thermal EOR Market Forecast 2018-2028 ($m, AGR %)
Figure 5.16 Venezuelan Thermal EOR Market Share Forecast, 2018, 2023 and 2028 (% Share)
Figure 5.17 Venezuela Oil Production 1990-2017 (Mbpd) and Reserves 1990-2017 (Billion Bbls)
Figure 5.18 Indonesian Thermal EOR Market Forecast 2018-2028 ($m, AGR %)
Figure 5.19 Indonesian Thermal EOR Market Share Forecast, 2018, 2023 and 2028 (% Share)
Figure 5.20 Indonesian Oil Production and Proven Reserves 1990-2017 (Mbpd, Billion bpd)
Figure 5.21 Kuwaiti Thermal EOR Market Forecast 2018-2028 ($m, AGR %)
Figure 5.22 Kuwaiti Thermal EOR Market Share Forecast, 2018, 2023 and 2028 (% Share)
Figure 5.23 Omani Thermal EOR Market Forecast 2018-2028 ($m, AGR %)
Figure 5.24 Omani Thermal EOR Market Share Forecast, 2018, 2023 and 2028 (% Share)
Figure 5.25 Omani Oil Production and Proven Reserves 1990-2017 (Mbpd, Billion bpd)
Figure 5.26 Chinese Thermal EOR Market Forecast 2018-2028 ($m, AGR %)
Figure 5.27 Chinese Thermal EOR Market Share Forecast, 2018, 2023 and 2028 (% Share)
Figure 5.28 Russian Thermal EOR Market Forecast 2018-2028 ($m, AGR %)
Figure 5.29 Russian Thermal EOR Market Share Forecast, 2018, 2023 and 2028 (% Share)
Figure 5.30 Bahraini Thermal EOR Market Forecast 2018-2028 ($m, AGR %)
Figure 5.31 Bahraini Thermal EOR Market Share Forecast, 2018, 2023 and 2028 (% Share)
Figure 5.32 Saudi Arabian Thermal EOR Market Forecast 2018-2028 ($m, AGR %)
Figure 5.33 Saudi Arabian Thermal EOR Market Share Forecast, 2018, 2023 and 2028 (% Share)
Figure 5.34 Rest of the World Thermal EOR Market Forecast 2018-2028 ($m, AGR%)
Figure 5.35 Rest of the World Thermal EOR Market Share Forecast, 2018, 2023 and 2028 (% Share)
Figure 7.1 Five Leading Companies in the Thermal Oil Sands EOR Market (2017 Spending $m)
Figure 7.2 Five Leading Companies in the Thermal Oil Sands EOR Market (2017 Market Share %)
Figure 7.3 Leading Five Companies in the Thermal Heavy Oil EOR Market (2017 Spending $m)
Figure 7.4 Leading Five Companies in the Thermal Heavy Oil EOR Market (2017 Market Share %)
Aera Energy
Athabasca Oil
Bayou State
Bayshore Petroleum
Blackpearl Resources
BP Migas
Brion Energy
Cenovus
Chevron Corporation
Chrysalix Energy venture Capital
Citgo Petroleum Group
CNPC
CNRL
Connacher
ConocoPhillips
Continental Resources
Denbury Resources
Devon Energy
ENI
Equinor
E-T Energy
Excelsior Energy
Exxon Mobil
Gazprom
Glass Point
Harvest Operations
Hot-Tec Energy
Husky Energy
Imperial Oil
Japan Canada Oil Sands
KGOC
Laricina Energy
Linn Energy
Lukoil
Maha Energy
MEG Energy
Naftex
NAM
Nexen
NOC
Nth Power
Occidental
Osum Oil Sands
Pacific Exploration
Pacific Rubiales
PDO
Pengrowth Energy
Petro-Canada
Petróleos de Venezuela S.A. PDVSA
Reliance
RockPort Capital
Rosneft
Royal Dutch Shell
Salym Petroleum Development N.V.
Sinopec
SKSPMIGAS
SOE
Suncor
Sunshine Oil Sands
Surgutneftegaz
Tatweer Petroleum
Tipco
Total
Touchstone
Valero
Wintershall
Zarubezhneft
Organisations Mentioned in This Report
Algerian Energy Ministry
California Department of Oil, Gas & Geothermal Resources (DOGGR)
California Resources Corporation
China National Offshore Oil Corporation (CNOOC)
China National Petroleum Corporation (CNPC)
International Energy Agency (IEA)
OPEC
Petroleum Administration for Defense Districts
United States Geological Survey (USGS)