Industries > Energy > EOR Yearbook 2019: The Ultimate Guide to Enhanced Oil Recovery (EOR)
EOR Yearbook 2019: The Ultimate Guide to Enhanced Oil Recovery (EOR)
Spending ($m) & Production (bpd) Forecasts for Chemical (Polymer, Alkaline, Surfactant), Gas (CO2 Injection, Nitrogen Injection, Natural Gas Injection), Thermal (Steam Injection (Steam Flood, Cyclic Steam Simulation (CSS)), Steam Assisted Gravity Drainage (SAGD), In-Situ Combustion, Heavy Oil Recovery Technologies Including Leading Company Analysis for Thermal EOR, Chemical EOR and CO2 EOR
Visiongain’s latest EOR yearbook provides you with unprecedented in-depth analysis of the global EOR market. Visiongain assesses that the global EOR market will experience expenditure of $44 billion in 2019 and the yearbook reveals where the major opportunities are to exploit.
The EOR market is seeing recovery as oil prices rise once more which is likely to encourage companies to become more heavily involved in each of the EOR methods in order to increase production. The next ten years are still likely to see production and spending increases in each of the EOR submarkets. Growth rates and the methods employed will vary considerably from country to country.
Many of the world’s conventional oil fields have already started the inevitable decline in production rate owing to years of extraction of a finite resource. While unconventional reserves do hold the possibility for enormous oil production levels, they are not found everywhere, and the difficulty in extraction of oil from such reserves means that it is not always feasible to develop them. This means that it is often most beneficial to apply EOR to existing fields to help achieve the maximum recovery rate from each well.
EOR technologies have been in operation for a number of decades, primarily being used to recover more oil from ageing oil fields. However, escalating oil demand in emerging economies, improved technologies, ageing oil fields and a dearth of conventional oil finds helped to drive investments in the market and increase production. As a result of this, thermal, gas and chemical EOR methods are no longer confined to a few select countries.
Visiongain’s global EOR energy market report can keep you informed and up to date with the developments in the market. The report covers global and national market forecasts and analysis from 2019 to 2029 including production and spending forecasts and analysis. The Thermal Heavy Oil, CO2, Other Gas and Chemical submarkets are also subdivided for each of the leading national markets.
With reference to this report, it covers extensive details and analysis of all known current EOR projects currently taking place throughout the world. Through extensive secondary research, Visiongain has identified a series of market trends that will impact the EOR market over the forecast timeframe.
The report will answer questions such as:
• How is the current oil price environment affecting the market and how will spending evolve in the future?
• What are the prospects for each of the EOR submarkets over the next decade?
• Who are the main companies in the EOR market?
• Where are the major EOR projects currently taking place around the world?
• What is driving and restraining the EOR market dynamics?
• Which individual technologies will prevail and how will these shifts be responded to?
• How will the market shares of the leading EOR countries change by 2029?
Five Reasons Why You Must Order and Read This Report Today:
1) The report provides Global Market Forecasts and Analysis covering the period 2019 to 2029 in terms of EOR Production (million barrels per year) and Spending
2) EOR Submarket Forecasts and Analysis covering the period 2019 to 2029 in Terms of Spending and Production for the Following Technologies:
– Thermal In-situ oil sands
– Thermal heavy oil
– CO2 EOR
– Other gas
– Chemical EOR
3) National Market Forecasts and Analysis from 2019 to 2029 in Terms of Production (million barrels per year) for the Leading countries in the EOR market, Plus the Market for the Rest of The World (RoW). Each Country Forecast includes Production (million barrels per year), Spending Forecasts and Analysis
4) Company Data for the Major Players in terms of 2017 Production within each EOR Submarket:
– Top 5 Leading Companies in Thermal EOR Market
1. Suncor
2. ConocoPhillips
3. Imperial Oil
4. Cenovus
5. China National Offshore Oil Corporation (CNOOC)
– Top 5 Thermal Heavy Oil EOR Market
1. Chevron
2. PDVSA
3. Husky Energy
4. Sinopec
5. Occidental
– Top 7 Leading Companies in the CO2 EOR Market
1. Denbury Resources
2. Hilcorp Energy
3. Whiting Petroleum
4. Fleur de Lis Energy
5. Linc Energy
6. Hess Corporation
7. Chaparral Energy Inc
– Top 4 Companies in the Chemical EOR Market
1. BlackPearl resources
2. Canadian Natural Resources (CNRL)
3. Zargon Oil and Gas
4. Petroleum Development of Oman
5) Multiple Project Tables of Upcoming Developments for each Submarket
1. 63 Chemical Projects
2. 27 Co2 Projects
3. 86 Thermal Projects
This independent 415-page report guarantees you will remain better informed than your competitors. With 300+ tables and figures that analyse the global market, five submarkets, leading national markets and the rest of the world market. The report also contains profiles and analysis of leading companies for each subsegment. This report will keep your knowledge that one step ahead of your rivals.
The (EOR) Yearbook 2019 will be of value to anyone who wants to better understand the industry and its dynamics. It will be useful for businesses already involved in a segment of the thermal EOR market, or those wishing to enter this growing market in the future.
Visiongain is a trading partner with the US Federal Government
CCR Ref number: KD4R6
1. Report Overview
1.1 Global Enhanced Oil Recovery (EOR) Market Overview
1.2 Market Structure Overview and Market Definition
1.3 Methodology
1.4 Why You Should Read This Report
1.5 How This Report Delivers
1.6 Key Questions Answered by This Analytical Report Include:
1.7 Who is This Report For?
1.8 Frequently Asked Questions (FAQ)
1.9 Associated Visiongain Reports
1.10 About Visiongain
2. Introduction to the Enhanced Oil Recovery Market
2.1 How is the Enhanced Oil Recovery Market Structured?
2.1.1 Primary Recovery
2.1.2 Secondary Recovery
2.1.3 Tertiary Recovery
2.2 Thermal EOR Processes
2.2.1 Steam Injection
2.2.1.1 Steam Flooding
2.2.1.2 Cyclic Steam Stimulation (CSS)
2.2.2 Steam-Assisted Gravity Drainage
2.2.3 Small-Scale Commercial EOR Technologies
2.2.3.1 In-Situ Combustion
2.2.3.2 Thermally Assisted Gas-Oil Gravity Drainage (TAGOGD)
2.4.1 Polymer Flooding
2.4.2 Surfactant Flooding
2.4.3 Alkaline Flooding
2.4.4 Micellar Flooding
3. Global Enhanced Oil Recovery Market 2019-2029
3.1 Global Enhanced Oil Recovery Market Forecast 2019-2029
3.2 The Leading National EOR Markets 2019-2029
3.3 EOR Market Drivers & Restraints 2018
3.3.1 Drivers in the EOR Market
3.3.1.1 Increasing Demand for Oil
3.3.1.2 Ageing Oil Fields
3.3.1.3 Large Heavy Oil Deposits
3.3.1.4 CO2 Reduction Strategies
3.3.1.5 Cost and Concentration of Chemicals
3.3.2 Restraints in the EOR Market
3.3.2.1 High Costs
3.3.2.2 Environmental Concerns
3.3.2.3 Competition from Conventional and Unconventional Production
3.4 Oil Prices
3.4.1 Visiongain’s Description and Analysis of the Oil Price Fall
3.4.2 Supply-Side Factors
3.4.2.1 Tight Oil
3.4.2.2 OPEC
3.4.3 Demand-Side Factors
3.4.3.1 Chinese and Indian Growth
3.4.3.2 Western Stagnation
3.4.4 Other Major Variables that Impact the Oil Price
3.4.4.1 North Africa
3.4.4.2 Russia
3.4.4.3 US Shale Industry
3.4.4.4 Iran
3.4.5 Visiongain’s Oil Price Assumptions and Forecast
4. Thermal Enhanced Oil Recovery Submarkets 2019-2029
4.1 Introduction to the Thermal EOR Market
4.2 Thermal EOR Economics
4.3 The In-Situ EOR Submarket
4.3.1 Current and Future In-Situ Oil Sands Production
4.3.2 Regulatory Climate
4.3.3 New and Alternative Transportation Solutions
4.3.4 Narrowing Price Differential Between WTI and WCS
4.3.5 Stricter Foreign Investment Regulation
4.3.6 High Water Demand
4.4 The Steam EOR Submarket
4.5 The Hot Water EOR Submarket
4.6 The Leading National Thermal EOR Market Forecasts 2019-2029
4.6.1 The Canadian Thermal EOR Market Forecast 2019-2029
4.6.1.1 The Canadian Thermal EOR Market Overview
4.6.1.2 Current Canadian Projects
4.6.1.2.1 Thermal Oil Sands Dominating the Market
4.6.1.5 Future Outlook
4.6.1.6 New Oil Sands Projects Scrapped
4.6.2 The US Thermal EOR Market Forecast 2019-2029
4.6.2.1 The U.S. Thermal EOR Market Overview
4.6.2.2 California Continues to Dominate Thermal EOR Projects
4.6.2.3 Future Outlook
4.6.3 The Rest of Middle East Thermal EOR Market Forecast 2019-2029
4.6.4 The Indonesia Thermal EOR Market Forecast 2019-2029
4.6.4.1 The Indonesia Thermal EOR Market Overview
4.6.4.2 Current Indonesian Projects
4.6.4.3 Drivers and Restraints in the Indonesian Thermal EOR Market
4.6.5 The Kuwait Thermal EOR Market Forecast 2019-2029
4.6.5.1 The Kuwait Thermal EOR Market Overview
4.6.5.2 Chevron’s Project in the Wafra Field
4.6.6 The Omani Thermal EOR Market Forecast 2019-2029
4.6.6.1 The Oman Thermal EOR Market Overview
4.6.6.2 Current Projects
4.6.6.2.1 PDO’s Thermal EOR Projects
4.6.6.2.2 Occidental’s SAGD Operation at the Mukhaizna Field
4.6.6.3 Future Outlook
4.6.6.3.1 PDO’s Ambitious Ten-Year Expansion Plan
4.6.6.3.2 Potential to Expand the Mukhaizna Project and Opportunities in the Neighbouring Kahmah Reservoir
4.6.6.3.3 The Prospects for Solar EOR in Oman
4.6.7 The China Thermal EOR Market Forecast 2019-2029
4.6.7.1 The Chinese Thermal EOR Market Overview
4.6.7.2 Current Thermal EOR Projects in China
4.6.7.3 Steady Increases Forecast in the Chinese Thermal EOR Market
4.6.8 The Russia Thermal EOR Market Forecast 2019-2029
4.6.8.1 The Russian Thermal EOR Market Overview
4.6.8.2 Current Projects
4.6.8.3 Future Outlook
4.6.9 The Egypt Thermal EOR Market Forecast 2019-2029
4.6.9.1 Challenges and Opportunities in the Egyptian Thermal EOR Market
4.6.10 The Rest of the World Thermal EOR Market Forecast 2019-2029
4.6.10.1 Brazil’s Overlooked Thermal EOR Market
4.6.10.2 Current Projects and Future Outlook
4.6.10.3 Petrobras’ Stretched Financial Position
4.6.10.4 Dutch Thermal EOR Market
4.6.10.5 Steady Thermal EOR Production from India
4.6.10.6 Tiny Thermal EOR Production from Germany
4.6.10.7 A Long History of Thermal EOR Production in Trinidad
4.7 PEST Analysis of the Thermal EOR Market 2019-2029
5. Carbon Dioxide Enhanced Oil Recovery Submarket 2019-2029
5.1 Introduction to the Carbon Dioxide Enhanced Oil Recovery Market
5.2 The Global CO2 EOR Market Forecast 2019-2029
5.2.1 A Brief History of the CO2 EOR Industry
5.2.2 The Importance of Oil Prices
5.2.3 The Main Costs Involved in CO2 EOR Operations
5.2.4 Miscible and Immiscible EOR Methods
5.2.5 Where is CO2 Sourced From?
5.2.6 Advantages and Disadvantages of Using CO2 for EOR
5.2.7 Competition from Rival Technologies
5.2.8 Prospects for Offshore CO2 EOR
5.2.9 Environmental Issues Related to CO2 EOR Production
5.2.10 Drivers and Restraints in the CO2 EOR Market
5.2.10.1 Drivers in the CO2 EOR Market
5.2.10.1.1 Vast Geological Storage Potential in Oil Fields
5.2.10.1.2 Extensive Industry Experience with CO2 EOR
5.2.10.1.3 Billions of Barrels of Added Oil Yield
5.2.10.1.4 Many Fields Approaching Limit of Water Flood Recovery Potential
5.2.10.1.5 High Costs of Decommissioning Oil and Gas Infrastructure
5.2.10.1.6 Residual Oil Zones (ROZs)
5.2.10.1.7 Carbon Trading and Cost Reductions
5.2.10.2 Restraints in the CO2 EOR Market
5.2.10.2.1 Limited CO2 Availability
5.2.10.2.2 High Cost of Carbon Capture
5.2.10.2.3 Limited Financial Incentives to Invest
5.2.10.2.4 Tight Financing
5.2.10.2.5 Longer Return on Investment Period
5.2.10.2.6 CO2 Leakage and Environmental Issues
5.2.10.2.7 Limited or No Government Funding
5.2.10.2.8 Offshore Decommissioning and Well Abandonment
5.2.10.2.9 Poorly Conducted Onshore Decommissioning
5.2.11 CO2 EOR Breakeven Price Analysis
5.2.12 Barriers to Entry Analysis
5.3 The Other Gas EOR Submarket Forecast 2019-2029
5.3.1 Current Areas of High Production
5.3.2 Other Gas EOR Projects
5.3.3 The U.S. CO2 EOR Market Forecast 2019-2029
5.3.3.1 History of CO2 EOR in the U.S.
5.3.3.2 Where are the CO2 EOR Projects in the U.S. Located?
5.3.3.3 Where is the CO2 Sourced From?
5.3.3.3.1 Anthropogenic CO2 Providers in the U.S.
5.3.3.3.2 Naturally Sourced CO2
5.3.3.4 Drivers and Restraints in the U.S. CO2 EOR Market 2019-2029
5.3.3.4.1 The Importance of Government Support and Regulations
5.3.3.4.2 The Impact of Increasing Shale (Tight) Oil Production on the CO2 EOR Market
5.3.3.4.3 Offshore EOR Unlikely to come to Fruition
5.3.3.5 How is the U.S. CO2 EOR Market Likely to Develop over the Next Ten Years?
5.3.4 The Chinese CO2 EOR Market Forecast 2019-2029
5.3.4.1 A Brief History of EOR in China
5.3.4.2 Current Chinese CO2 EOR Projects
5.3.4.3 Anthropogenic CO2 Providers in China
5.3.4.4 Drivers and Restraints in the Chinese CO2 EOR Market 2019-2029
5.3.4.4.1 China’s High Emissions and the Need for More Oil
5.3.4.4.2 How Suitable is China’s Geology for CO2 EOR?
5.3.4.4.3 China’s Efforts to Form International Partnerships to Help Promote CO2 EOR
5.3.4.4.4 The Need for More Government Support for CO2 EOR
5.3.5 The Canadian CO2 EOR Market Forecast 2019-2029
5.3.5.1 Current and Upcoming Canadian CO2 EOR Projects
5.3.5.2 Anthropogenic CO2 Providers in Canada
5.3.5.3 Drivers and Restraints in the Canadian CO2 EOR Market 2019-2029
5.3.5.3.1 Construction on the Alberta Carbon Trunk Line Project is Underway
5.3.5.3.2 Despite the Abundance of Maturing Oil Fields, Too Many Pilot Projects Are Abandoned
5.3.5.3.3 High CO2 Costs Prohibiting Development
5.3.5.3.4 Shale Oil, Oil Sands and Competition from Other Technologies
5.3.6 The UAE CO2 EOR Market Forecast 2019-2029
5.3.6.1 Current and Upcoming UAE CO2 EOR Projects
5.3.6.2 Anthropogenic CO2 providers in the UAE
5.3.6.3 Drivers and Restraints in the UAE CO2 EOR Market 2019-2029
5.3.7 The Brazilian CO2 EOR Market Forecast 2019-2029
5.3.7.1 Current and Upcoming Brazilian CO2 EOR Projects
5.3.7.2 Anthropogenic CO2 Providers in Brazil
5.3.7.3 Drivers and Restraints in the Brazilian CO2 EOR Market 2019-2029
5.3.7.4 Prospects for the Lula CO2 EOR Project
5.3.7.5 Future Potential for Brazil’s CO2 EOR Market
5.3.8 The Russian CO2 EOR Market Forecast 2019-2029
5.3.9 The Rest of Europe CO2 EOR Market Forecast 2019-2029
5.3.9.1 Drivers and Restraints in the Rest of Europe CO2 EOR Market
5.3.9.2 Why is Progress So Slow at Present?
5.3.9.3 CO2 EOR Prospects in the Netherlands and Denmark
5.3.9.4 Norway’s Long-Term CO2 EOR Potential
5.3.9.5 CO2 EOR Opportunities in Other European Countries
5.3.10 The Rest of the World CO2 EOR Market Forecast 2019-2029
5.3.10.1 CO2 EOR Projects and Potential in the Rest of the World
5.3.10.1.1 The Saudi-Arabian CO2 EOR Market 2019-2029
5.3.10.1.2 The Kuwaiti CO2 EOR Market 2019-2029
5.3.10.1.3 The Egyptian CO2 EOR Market 2019-2029
5.3.10.1.4 The Mexican CO2 EOR Market 2019-2029
5.3.10.1.5 The Trinidadian CO2 EOR Market 2019-2029
5.3.10.1.6 The Vietnamese CO2 EOR Market 2019-2029
5.3.10.1.7 The Malaysian CO2 EOR Market 2019-2029
5.4 PEST Analysis of the Carbon Dioxide EOR Market 2019-2029
6. The Chemical Enhanced Oil Recovery Submarket 2019-2029
6.1 Major Chemicals Used in EOR Projects
6.2 Major Themes Impacting the Chemical EOR Market
6.3 Impact of Oil Price Crash and Oil Price Movements on the Chemical EOR Market
6.4 The Chemical Enhanced Oil Recovery Market Forecast 2019-2029
6.4.1 Improving Polymers and Surfactants
6.4.2 Current Areas of High Production
6.5 What are the Drivers and Restraints of the Global Chemical EOR Market?
6.5.1 Major Chemical EOR Drivers
6.5.1.1 Improvements in Oil Recovery Rates
6.5.1.2 Large Amounts of R&D Support
6.5.1.3 Cost and Concentration of Chemicals Decreasing
6.5.1.4 Increased Hybrid Options
6.5.1.5 Increased Effectiveness in Project Initiation
6.5.1.6 Experience of Tests and Commercial Projects Globally
6.5.2 Major Chemical EOR Restraints
6.5.2.1 Oil Price Sensitivity
6.5.2.2 Limits to the Application of Chemicals
6.5.2.3 High Costs of EOR Implementation
6.5.2.4 Delay Between Initial Injection and First Sign of Improvement in Production
6.5.2.5 Lack of Government and Regulatory Support
6.5.2.6 Limited Field Experience and Environmental Concerns
6.5.2.7 Chemical EOR Projects are Complex
6.5.2.8 Alternative Technologies
6.5.2.9 Supply Chain Restraints and Water Management
6.6 The Current Types of Chemical EOR Projects Globally
6.6.1 Future Geographical and Technological Areas of Growth
6.6.2 Potential Challenges for Chemical EOR: Costs, Timing and Regulation
6.6.3 Chemical EOR Projects
6.7 Emerging Technologies and Future Trends
6.7.1 Biopolymers
6.7.2 Hybrid Chemical Formulas
6.7.3 Nanoplate Surfactants
6.7.4 Microbial EOR
6.7.5 The Outlook for Emerging Technologies
6.8 The Leading National Chemical EOR Markets 2019-2029
6.9 The Chinese Chemical EOR Production and Market Forecast 2019-2029
6.9.1 The Chinese Chemical EOR Spending Market Forecast 2019-2029
6.9.2 The Chinese Chemical EOR Market Analysis
6.9.3 A Focus on Chinese Oil Operators and Opportunities for Chemical EOR
6.9.4 The Drivers and Restraints Impacting the Chinese Market
6.9.4.1 China: A World Leader in Chemical EOR
6.9.4.2 Despite Opportunity, Could the Chinese Chemical EOR Market be Limited by Competition?
6.9.5 The Outlook for China: Will Its Dominance Continue?
6.10 The Canadian Chemical EOR Production and Market Forecast 2019-2029
6.10.1 The Canadian Chemical EOR Spending Market Forecast 2019-2029
6.10.2 The Canadian Chemical EOR Market Analysis
6.10.2.1 Cenovus’ Experience with Chemical EOR at Pelican Lake
6.10.2.2 CNRL’s Experience with Chemical EOR at Pelican Lake
6.10.2.3 Other Projects in Canada
6.10.2.4 A Focus on ASP Projects
6.10.3 What is Driving and Restraining the Canadian Chemical EOR Market?
6.10.3.1 Is Experience Enough to Drive the Canadian Chemical EOR Market Forward?
6.10.3.2 To What Extent Do Oil Prices, Costs and Technicalities Restrict the Canadian Chemical EOR Market?
6.10.4 Future Prospects for Chemical EOR in Canada
6.11 The Russian Chemical EOR Production and Market Forecast 2019-2029
6.11.1 The Russian Chemical EOR Spending Market Forecast 2019-2029
6.11.2 The Russian Chemical EOR Market Analysis
6.11.2.1 The Use of Chemical EOR by Lukoil
6.11.3 Drivers and Restraints in the Russian Chemical EOR Market
6.11.3.1 Western Siberia and Falling Production
6.11.3.2 What Are the Restraints in Russia?
6.12 The Omani Chemical EOR Production and Market Forecast 2019-2029
6.12.1 The Omani Chemical EOR Spending Market Forecast 2019-2029
6.12.2 The Omani Chemical EOR Market Analysis
6.12.2.1 Marmul Chemical EOR: A Case Study
6.12.2.2 Does Oman Have Any Further Chemical EOR Experience?
6.12.3 The Drivers and Restraints Impacting the Omani Chemical EOR Market
6.12.3.1 PDO EOR Strategies
6.12.3.2 Oman’s Pilot Experience and Goals
6.12.3.3 The Implications of Investment in Alternative EOR Techniques
6.12.4 What is the Overall Outlook for Oman?
6.13 The Rest of the Middle East Chemical EOR Production and Market Forecast 2019-2029
6.13.1 The Rest of the Middle East Chemical EOR Spending Market Forecast 2019-2029
6.13.2 The Rest of the Middle East Chemical EOR Market Analysis
6.13.2.1 Opportunities in Kuwait
6.13.2.2 Potential for the UAE
6.13.2.3 The Chemical EOR Market in Saudi Arabia
6.14 The Indonesian Chemical EOR Production and Market Forecast 2019-2029
6.14.1 The Indonesian Chemical EOR Spending Market Forecast 2019-2029
6.14.2 The Indonesian Chemical EOR Market Analysis
6.14.3 Drivers and Restraints for the Indonesian Chemical EOR Market
6.14.3.1 The Importance of Chemical EOR in Indonesia
6.14.3.2 Chemical EOR Potential in Indonesia
6.15 The Egyptian Chemical EOR Production and Market Forecast 2019-2029
6.15.1 The Egyptian Chemical EOR Spending Market Forecast 2019-2029
6.16 The Brazilian Chemical EOR Production and Market Forecast 2019-2029
6.16.1 The Brazilian Chemical EOR Spending Market Forecast 2019-2029
6.17 The Rest of Latin American Chemical EOR Production and Market Forecast 2019-2029
6.17.1 The Rest of Latin America EOR Spending Market Forecast 2019-2029
6.17.2 The Rest of Latin America Chemical EOR Market Analysis
6.17.2.1 Argentina
6.17.2.1.1 What Are the Main Drivers and Restraints Impacting the Argentine Chemical EOR Market?
6.17.2.1.2 The Outlook for Chemical EOR in Argentina
6.17.2.2 Brazil
6.17.2.3 Ecuador
6.18 The United States Chemical EOR Production and Market Forecast 2019-2029
6.18.1 The United States EOR Spending Market Forecast 2019-2029
6.18.2 The United States Chemical EOR Market Analysis
6.18.2.1 What Is the Current Status of Chemical EOR in the US?
6.18.3 The Drivers and Restraints Impacting the US Chemical EOR Market
6.18.3.1 Will the Chemical EOR Market in the US Rebound?
6.18.3.2 Will Increased Energy Security and Competition from Other EOR Techniques Push Chemical EOR Out?
6.18.4 The Outlook for the US: Experience from Pilot Projects
6.19 The Indian Chemical EOR Production and Market Forecast 2019-2029
6.19.1 The Indian Chemical EOR Spending Market Forecast 2019-2029
6.19.2 The Indian Chemical EOR Market Analysis
6.19.3 What are the Major Drivers and Restraints in the Indian Chemical EOR Market?
6.19.3.1 As Energy Consumption Increases, and Oil Fields Mature, Will Chemical EOR be a Panacea for India?
6.19.3.2 How Will Market Restraints Impact the Indian Chemical EOR Market?
6.19.4 Indian Chemical EOR Market Outlook: Future Projects and Opportunities
6.20 The Rest of the World Chemical EOR Production and Market Forecast 2019-2029
6.20.1 The Rest of the World EOR Spending Market Forecast 2019-2029
6.21 The Malaysian Chemical EOR Production and Market Forecast 2019-2029
6.21.1 The Malaysian EOR Spending Market Forecast 2019-2029
6.21.2 The Malaysian Chemical EOR Market
6.21.2.1 Petronas and ExxonMobil’s Angsi Development
6.22.2.2 The Development of the St Joseph Field
6.21.3 Drivers and Restraints for the Malaysian Chemical EOR Market
6.21.3.1 Production Sharing Contracts as a Support Mechanism for Chemical EOR
6.21.3.2 Will Costs and Delays Weigh Down on Market Sentiment?
6.21.4 The Outlook for Chemical EOR in Malaysia
6.22 PEST Analysis of the Chemical EOR Market 2019-2029
7. PEST Analysis of the Enhanced Oil Recovery Market
7.1 Political
7.2 Economic
7.3 Social
7.4 Technological
8. The Leading Companies in the Enhanced Oil Recovery Market
8.1 The Leading Companies in the Thermal EOR Market
8.1.1 Suncor
8.1.2 ConocoPhillips
8.1.3 Imperial Oil
8.1.4 Cenovus
8.1.5 China National Offshore Oil Corporation (CNOOC)
8.2 The Leading Companies in the Thermal Heavy Oil EOR Market
8.2.1 Chevron Corporation
8.2.2 PDVSA
8.2.3 Husky Energy
8.2.4 Sinopec
8.2.5 Occidental Petroleum Corporation
8.2.6 Other Leading Companies in the Thermal EOR Market
8.3 Top Companies in the Chemical EOR Market
8.3.1 BlackPearl Resources
8.3.2 Canadian Natural Resources (CNRL)
8.3.3 Petroleum Development Oman (PDO)
8.3.4 Zargon Oil and Gas
8.4 Top Companies in the CO2 EOR Market
8.4.1 Denbury Resources
8.4.2 Hilcorp Energy Company
8.4.3 Whiting Petroleum Corporation
8.4.4 Fleur de Lis Energy
8.4.5 Linc Energy
8.4.6 Hess Corporation
8.4.7 Chaparral Energy Inc.
9. Conclusions and Recommendations
9.1 Key Findings
9.2 Recommendations
10. Glossary
Associated Visiongain Reports
Visiongain Report Sales Order Form
Appendix A
About Visiongain
Appendix B
Visiongain report evaluation form
List of Tables
Table 3.1 Global EOR Market Spending and Production Forecast 2019-2029 (MMbbl/yr, $bn, AGR %, Cumulative)
Table 3.2 Global EOR Spending Market Forecasts 2019-2029 ($m, AGR %, CAGR%, Cumulative)
Table 3.3 Global EOR Production Forecasts 2019-2029 (Million Barrels/ year)
Table 3.4 EOR Market Drivers & Restraints
Table 3.5 Visiongain’s Anticipated Brent Crude Oil Price, 2018, 2019, 2020-2022, 2023-2025, 2026-2029 ($/bbl)
Table 4.1 In-Situ Oil Sands EOR Submarket Forecast 2019-2029 (MMbbl/yr, $mn, AGR %, CAGR%, Cumulative)
Table 4.2 Steam EOR Submarket Forecasts 2019-2029 (MMbbl/yr, $mn, AGR %, CAGR %, Cumulative)
Table 4.3 Hot Water EOR Submarket Forecasts 2019-2029 (MMbbl/yr, $mn, AGR %, CAGR %, Cumulative)
Table 4.4 Leading National Thermal EOR Market Forecast 2019-2029 (Spending $m, AGR %, Cumulative)
Table 4.5 Leading National Thermal EOR Production Forecasts 2019-2029 (MMbbl/yr)
Table 4.6 Canadian Thermal EOR Market Forecast 2019-2029 (MMbbl/yr production, Spending $m, AGR %, CAGR %, Cumulative)
Table 4.7 Operational Thermal Oil Sands Projects (Company Name, Project Name, Technology, BPD Capacity, Current BPD)
Table 4.8 Operational Thermal Oil Sands Projects (Company Name, Project Name, Technology, BPD Capacity, Current BPD)
Table 4.9 Planned Thermal Oil Sands Projects (Company Name, Project Name, Technology, bpd Capacity, Start Date)
Table 4.10 US Thermal EOR Market Forecast 2019-2029 (MMbbl/yr production, Spending $m, AGR %, CAGR %, Cumulative)
Table 4.11 U.S. Thermal EOR Production (Company, Project Location, Production bpd, Technology)
Table 4.12 Rest of Middle East Thermal EOR Market Forecast 2019-2029 (MMbbl/yr production, Spending $m, AGR %, CAGR %, Cumulative)
Table 4.13 Indonesia Thermal EOR Market Forecast 2019-2029 (MMbbl/yr production, Spending $m, AGR %, CAGR %, Cumulative)
Table 4.14 Kuwait Thermal EOR Market Forecast 2019-2029 (MMbbl/yr production, Spending $m, AGR %, CAGR %, Cumulative)
Table 4.15 Oman Thermal EOR Market Forecast 2019-2029 (MMbbl/yr production, Spending $m, AGR %, CAGR %, Cumulative)
Table 4.16 Omani Thermal EOR Production (Company, Project Location, Production (bpd), Technology)
Table 4.17 China Thermal EOR Market Forecast 2019-2029 (MMbbl/yr production, Spending $m, AGR %, CAGR %, Cumulative)
Table 4.18 Russia Thermal EOR Market Forecast 2019-2029 (MMbbl/yr production, Spending $m, AGR %, CAGR %, Cumulative)
Table 4.19 Egypt Thermal EOR Market Forecast 2019-2029 (MMbbl/yr production, Spending $m, AGR %, CAGR %, Cumulative)
Table 4.20 Rest of the World Thermal EOR Market Forecast 2019-2029 (MMbbl/yr production, Spending $m, AGR %, CAGR %, Cumulative)
Table 4.21 PEST Analysis of the Thermal EOR Market 2019-2029
Table 5.1 Global CO2 EOR Market Forecast 2019-2029 (Spending $m, AGR %, Cumulative)
Table 5.2 Advantages and Disadvantages of Using CO2 for EOR
Table 5.3 Shale Oil Reserves Top 10 Countries (billion bbls)
Table 5.4 Drivers and Restraints in the CO2 EOR Market
Table 5.5 Other Gas EOR Projects (Company, Project, Country, Start Date, Production bpd)
Table 5.6 US CO2 EOR Market Forecast 2019-2029 (MMbbl/yr production, Spending $m, AGR %, CAGR %, Cumulative)
Table 5.7 U.S. Regional Submarkets (Region, Location, Number of CO2 EOR Projects, Production bpd)
Table 5.8 Operating & Planned Anthropogenic CO2 Providers Facilities in the U.S. (Location, Companies, MMtpa Capacity, Operation Date and Clients)
Table 5.9 Drivers and Restraints in the US CO2 EOR Market
Table 5.10 15 Largest Companies in CO2 EOR (Production) and Shale (Tight) Oil in 2015 (CAPEX)
Table 5.11 China CO2 EOR Market Forecast 2019-2029 (MMbbl/yr production, Spending $m, AGR %, CAGR %, Cumulative)
Table 5.12 Operating & Planned Anthropogenic CO2 Provider Facilities in China (Project Name, Location, Companies, MMtpa Capacity and Operation Date)
Table 5.13 Drivers and Restraints in the Chinese CO2 EOR Market
Table 5.14 Canada CO2 EOR Market Forecast 2019-2029 (MMbbl/yr production, Spending $m, AGR %, CAGR %, Cumulative)
Table 5.15 Operational & Planned Canadian CO2 EOR Projects (Name, Company, Gas Source, Start Date, bpd Production and bpd Peak Production)
Table 5.16 Operating & Planned Anthropogenic CO2 Providers Facilities in Canada (Location, Companies, MMtpa Capacity, Operation Date and Clients)
Table 5.17 Drivers and Restraints in the Canadian CO2 EOR Market
Table 5.18 Canadian CO2 EOR Pilots (Project Name, Operator, Operational Dates, Capacity (Mmtpa))
Table 5.19 UAE CO2 EOR Market Forecast 2019-2029 (MMbbl/yr production, Spending $m, AGR %, CAGR %, Cumulative)
Table 5.20 Operational & Planned UAE CO2 EOR Projects (Project, Company, Gas Source, Start Date, Production 2016, Expected Peak Production)
Table 5.21 Operating & Planned Anthropogenic CO2 Provider Facilities in the UAE (Location, Companies, Capacity (MMtpa), Operation date and Clients)
Table 5.22 Drivers and Restraints in the UAE CO2 EOR Market
Table 5.23 Brazil CO2 EOR Market Forecast 2019-2029 (MMbbl/yr production, Spending $m, AGR %, CAGR %, Cumulative)
Table 5.24 Operational & Planned Brazilian CO2 EOR Projects (Name, Company, Gas Source, Start Date, bpd Production 2016 and bpd Peak Production)
Table 5.25 Operating & Planned Anthropogenic CO2 Provider Facilities in Brazil (Project Name, Location, Companies, Capacity (MMtpa), Operation date and Clients)
Table 5.26 Drivers and Restraints in the Brazilian CO2 EOR Market
Table 5.27 Russia CO2 EOR Market Forecast 2019-2029 (MMbbl/yr production, Spending $m, AGR %, CAGR %, Cumulative)
Table 5.28 Rest of Europe CO2 EOR Market Forecast 2019-2029 (MMbbl/yr production, Spending $m, AGR %, CAGR %, Cumulative)
Table 5.29 Drivers and Restraints in the Rest of Europe CO2 EOR Market
Table 5.30 Rest of the World CO2 EOR Market Forecast 2019-2029 (MMbbl/yr production, Spending $m, AGR %, CAGR %, Cumulative)
Table 5.31 PEST Analysis of the Carbon Dioxide EOR Market 2019-2029
Table 6.1 Chemical EOR Submarket Forecast 2019-2029 (MMbbl/yr, $mn, AGR %, CAGR%, Cumulative)
Table 6.2 Drivers and Restraints in the Global Chemical EOR Market
Table 6.3 Leading National Chemical EOR Spending Market Forecasts 2019-2029 ($m, AGR %, CAGR%, Cumulative)
Table 6.4 Leading National Chemical EOR Production Forecasts 2019-2029 (MMbbl/yr)
Table 6.5 The Chinese Chemical EOR Production Forecast, 2019-2029 (MMbbl/yr, AGR %, CAGR%, Cumulative)
Table 6.6 The Chinese Chemical EOR Spending Forecast, 2019-2029 ($mn, AGR %, CAGR%, Cumulative)
Table 6.7 Oil, Population and Economic Growth Statistics for China (Statistic, bn, AGR %)
Table 6.8 Drivers and Restraints in the Chinese Chemical EOR Market
Table 6.9 The Canadian Chemical EOR Production Forecast, 2019-2029 (MMbbl/yr, AGR %, CAGR%, Cumulative)
Table 6.10 The Canadian Chemical EOR Spending Forecast, 2019-2029 ($mn, AGR %, CAGR%, Cumulative)
Table 6.11 Characteristics of the Pelican Lake Field, Canada (Field Name, Location, Geology, Oil Characteristics, Other Characteristics)
Table 6.12 Major ASP Projects in Canada
Table 6.13 Drivers and Restraints in the Canadian Chemical EOR Market
Table 6.14 The Russian Chemical EOR Production Forecast, 2019-2029 (MMbbl/yr, AGR %, CAGR%, Cumulative)
Table 6.15 The Russian Chemical EOR Spending Forecast, 2019-2029 ($mn, AGR %, CAGR%, Cumulative)
Table 6.16 Drivers and Restraints in the Russian Chemical EOR Market
Table 6.17 The Omani Chemical EOR Production Forecast, 2019-2029 (MMbbl/yr, AGR %, CAGR%, Cumulative)
Table 6.18 The Omani Chemical EOR Spending Forecast, 2019-2029 ($mn, AGR %, CAGR%, Cumulative)
Table 6.19 Major Characteristics of the Marmul Field (Field, Operator, Location, Lithology, Oil Type, Discovery Date)
Table 6.20 Drivers and Restraints in the Oman Chemical EOR Market
Table 6.21 Omani Oil Consumption 1990-2014 (Year, Oil Consumption bbl/d, % Change)
Table 6.22 The Rest of Middle East Chemical EOR Production Forecast, 2019-2029 (MMbbl/yr, AGR %, CAGR%, Cumulative)
Table 6.23 The Rest of Middle East Chemical EOR Spending Forecast, 2019-2029 ($mn, AGR %, CAGR%, Cumulative)
Table 6.24 The Indonesian Chemical EOR Production Forecast, 2019-2029 (MMbbl/yr, AGR %, CAGR%, Cumulative)
Table 6.25 The Indonesian Chemical EOR Spending Forecast, 2019-2029 ($mn, AGR %, CAGR%, Cumulative)
Table 6.26 Drivers and Restraints in the Indonesian Chemical EOR Market
Table 6.27 The Egyptian Chemical EOR Production Forecast, 2019-2029 (MMbbl/yr, AGR %, CAGR%, Cumulative)
Table 6.28 The Egyptian Chemical EOR Spending Forecast, 2019-2029 ($mn, AGR %, CAGR%, Cumulative)
Table 6.29 The Brazilian Chemical EOR Production Forecast, 2019-2029 (MMbbl/yr, AGR %, CAGR%, Cumulative)
Table 6.30 The Brazilian Chemical EOR Spending Forecast, 2019-2029 ($mn, AGR %, CAGR%, Cumulative)
Table 6.31 The Rest of Latin America Chemical EOR Production Forecast, 2019-2029 (MMbbl/yr, AGR %, CAGR%, Cumulative)
Table 6.32 The Rest of Latin America Chemical EOR Spending Forecast, 2019-2029 ($mn, AGR %, CAGR%, Cumulative)
Table 6.33 Chemical EOR Pilot Projects in Argentina (Field, Type, Details, Project Dates)
Table 6.34 Drivers and Restraints in the Argentine Chemical EOR Market
Table 6.35 The US Chemical EOR Production Forecast, 2019-2029 (MMbbl/yr, AGR %, CAGR%, Cumulative)
Table 6.36 The US Chemical EOR Spending Forecast, 2019-2029 ($mn, AGR %, CAGR%, Cumulative)
Table 6.37 Drivers and Restraints in the US Chemical EOR Market
Table 6.38 Part-Funded Chemical EOR Projects in the US (Project, Details, Project Dates)
Table 6.39 The Indian Chemical EOR Production Forecast, 2019-2029 (MMbbl/yr, AGR %, CAGR%, Cumulative)
Table 6.40 The Indian Chemical EOR Spending Forecast, 2019-2029 ($mn, AGR %, CAGR%, Cumulative)
Table 6.41 Project Characteristics for the Mangala Chemical EOR Project (Field Name, Operator, Discovery Date, Location, Lithology, Oil Characteristics, Current Production, Project Details)
Table 6.42 Drivers and Restraints in the Indian Chemical EOR Market
Table 6.43 The Rest of the World Chemical EOR Production Forecast, 2019-2029 (MMbbl/yr, AGR %, CAGR%, Cumulative)
Table 6.44 The Rest of the World Chemical EOR Spending Forecast, 2019-2029 ($mn, AGR %, CAGR%, Cumulative)
Table 6.45 The Malaysian Chemical EOR Production Forecast, 2019-2029 (MMbbl/yr, AGR %, CAGR%, Cumulative)
Table 6.46 The Malaysian Chemical EOR Spending Forecast, 2019-2029 ($mn, AGR %, CAGR%, Cumulative)
Table 6.47 Drivers and Restraints in the Malaysian Chemical EOR Market
Table 6.48 PEST Analysis of the Chemical EOR Market 2019-2029
Table 8.1 Overview of Suncor in the Thermal Oil Sands EOR Market (Headquarters, CEO, Address, Website, Total Company Revenue 2017 ($m), Business Segments, No. of Employees, IR Contact, Ticker, Thermal Oil Sands EOR Spending ($m) 2017, Thermal Oil Sands EOR Market Share (%) 2017, Market Rank)
Table 8.2 Overview of ConocoPhillips in the Thermal Oil Sands EOR Market (Headquarters, CEO, Address, Website, Total Company Revenue 2017 ($m), Business Segments, No. of Employees, IR Contact, Ticker, Thermal Oil Sands EOR Spending ($m) 2017, Thermal Oil Sands EOR Market Share (%) 2017, Market Rank)
Table 8.3 Overview of Imperial Oil in the Thermal Oil Sands EOR Market (Headquarters, CEO, Address, Website, Total Company Revenue 2017 ($m), Business Segments, No. of Employees, IR Contact, Ticker, Thermal Oil Sands EOR Spending ($m) 2017, Thermal Oil Sands EOR Market Share (%) 2017, Market Rank)
Table 8.4 Overview of Cenovus in the Thermal Oil Sands EOR Market (Headquarters, CEO, Address, Website, Total Company Revenue 2017 ($m), Business Segments, No. of Employees, IR Contact, Ticker, Thermal Oil Sands EOR Spending ($m) 2017, Thermal Oil Sands EOR Market Share (%) 2017, Market Rank)
Table 8.5 Overview of CNOOC in the Thermal Oil Sands EOR Market (Headquarters, CEO, Address, Website, Total Company Revenue 2017 ($m), Business Segments, No. of Employees, IR Contact, Ticker, Thermal Oil Sands EOR Spending ($m) 2017, Thermal Oil Sands EOR Market Share (%) 2017, Market Rank)
Table 8.6 Overview of Chevron in the Thermal Heavy Oil EOR Market (Headquarters, CEO, Address, Website, Total Company Revenue 2017 ($m), Business Segments, No. of Employees, IR Contact, Ticker, Thermal Oil Sands EOR Spending 2017 ($m), Thermal Oil Sands EOR Market Share (%), Market Rank)
Table 8.7 Overview of PDVSA in the Thermal Heavy Oil EOR Market (Headquarters, CEO, Website, No. of Employees, Thermal Oil Sands EOR Spending ($m) in 2017, Thermal Oil Sands EOR Market Share (%) in 2017, Market Rank)
Table 8.8 Overview of Husky Energy in the Thermal Heavy Oil EOR Market (Headquarters, CEO, Address, Website, Total Company Revenue 2017 ($m), Business Segments, No. of Employees, IR Contact, Ticker, Thermal Oil Sands EOR Spending 2017 ($m), Thermal Oil Sands EOR Market Share (%), Market Rank)
Table 8.9 Overview of Sinopec in the Thermal Heavy Oil EOR Market (Headquarters, CEO, Address, Website, Total Company Revenue 2017 ($m), Business Segments, No. of Employees, IR Contact, Ticker/ Securities Code, Thermal Oil Sands EOR Spending 2017 ($m), Thermal Oil Sands EOR Market Share (%), Market Rank)
Table 8.10 Overview of Occidental Petroleum in the Thermal Heavy Oil EOR Market (Headquarters, CEO, Address, Website, Total Company Revenue 2017 ($m), Business Segments, No. of Employees, IR Contact, Ticker/ Securities Code, Thermal Oil Sands EOR Spending 2017 ($m), Thermal Oil Sands EOR Market Share (%), Market Rank)
Table 8.11 Other Leading Companies in the Thermal EOR Market (Company, Sector, Technology)
Table 8.12 BlackPearl Resources Overview 2017 (Total Daily Crude Oil Production, 2017 Chemical EOR Production Forecast, Oil and Gas Sales 2017, Headquarters, Ticker, Employees, Website)
Table 8.13 CNRL Overview 2017 (Total Daily Crude and NGL Production 2017, Total Sales, 2017 Chemical EOR Production (bbl/d), Headquarters, Employees, Ticker, Website)
Table 8.14 PDO Overview 2017 (Total Daily Production 2017, 2017 Chemical EOR Production, 2017 Global Chemical EOR Production, Headquarters, Employees, Website)
Table 8.15 Zargon Oil and Gas Overview 2017 (Total Daily Production 2017, Total Oil and Liquids Sales 2017, 2017 Chemical EOR Production, Headquarters, Employees, Ticker, Website)
List of Figures
Figure 1.1 Global EOR Market Structure Overview
Figure 2.1 Enhanced Oil Recovery by Segment
Figure 2.2 Main Properties for Chemical EOR
Figure 3.1 Global EOR Spending Forecast 2019-2029 ($mn, AGR %)
Figure 3.2 Global EOR Production Forecast 2019-2029 (MMbbl/yr, AGR %)
Figure 3.3 Global EOR Production Forecasts 2019-2029 (Million Barrels/ year)
Figure 3.4 Global EOR Spending Forecasts 2019-2029 ($mn)
Figure 3.5 World Liquid Fuel Consumption Forecast 2015-2040 (MMbpd)
Figure 3.6 WTI and Brent Oil Prices 2006-2017 ($/bbl)
Figure 3.7 Average Monthly OPEC Crude Oil Price July 2017-July 2018 ($/bbl)
Figure 3.8 China and India Annual GDP Growth 2012-2018 (%)
Figure 3.9 US Refined Product Consumption January 2017 to Sept 2018 Four-Week Average (Mbpd)
Figure 3.10 Visiongain’s Anticipated Brent Crude Oil Price, 2018, 2019, 2020-2022, 2023-2025, 2026-2029 ($/bbl)
Figure 4.1 In-Situ Oil Sands EOR Submarket Production Forecasts 2019-2029 (Million Barrels)
Figure 4.2 In-Situ Oil Sands EOR Submarket Forecasts 2019-2029 ($m, AGR%)
Figure 4.3 Map of US Petroleum Administration for Defense Districts (PADD)
Figure 4.4 Steam EOR Submarket Production Forecasts 2019-2029 (MMbbl/yr)
Figure 4.5 Steam EOR Submarket Spending Forecasts 2019-2029 ($mn)
Figure 4.6 Hot Water EOR Submarket Production Forecasts 2019-2029 (MMbbl/yr)
Figure 4.7 Hot Water EOR Submarket Spending Forecasts 2019-2029 ($mn)
Figure 4.8 Leading National Thermal EOR Production Forecasts 2019-2029 (MMbbl/yr)
Figure 4.9 Leading National Thermal EOR Spending Forecasts 2019-2029 ($mn)
Figure 4.10 Leading National Thermal EOR Production and Market Share Forecast 2019 (%)
Figure 4.11 Leading National Thermal EOR Production and Market Share Forecast 2024 (%
Figure 4.12 Leading National Thermal EOR Production and Market Share Forecast 2029 (%)
Figure 4.13 Canadian Thermal EOR Production Market Forecast 2019-2029 (MMbbl/yr, AGR %)
Figure 4.14 Canadian Thermal EOR Market Share by Production Forecast, 2019, 2024 and 2029 (% Share)
Figure 4.15 Canadian Thermal EOR Spending Market Forecast 2019-2029 ($m, AGR %)
Figure 4.16 Canadian Thermal EOR Market Share by Spending Forecast, 2019, 2024 and 2029 (% Share)
Figure 4.17 Canadian Oil Sands Deposits in Alberta
Figure 4.18 US Thermal EOR Production Market Forecast 2019-2029 (MMbbl/yr, AGR %)
Figure 4.19 US Thermal EOR Market Share by Production Forecast, 2019, 2024 and 2029 (% Share)
Figure 4.20 US Thermal EOR Spending Market Forecast 2019-2029 ($m, AGR %)
Figure 4.21 US Thermal EOR Market Share by Spending Forecast, 2019, 2024 and 2029 (% Share)
Figure 4.22 Rest of Middle East Thermal EOR Production Market Forecast 2019-2029 (MMbbl/yr, AGR %)
Figure 4.23 Rest of Middle East Thermal EOR Market Share by Production Forecast, 2019, 2024 and 2029 (% Share)
Figure 4.24 Rest of Middle East Thermal EOR Spending Market Forecast 2019-2029 ($m, AGR %)
Figure 4.25 Rest of Middle East Thermal EOR Market Share by Spending Forecast, 2019, 2024 and 2029 (% Share)
Figure 4.26 Indonesia Thermal EOR Production Market Forecast 2019-2029 (MMbbl/yr, AGR %)
Figure 4.27 Indonesia Thermal EOR Market Share by Production Forecast, 2019, 2024 and 2029 (% Share)
Figure 4.28 Indonesia Thermal EOR Spending Market Forecast 2019-2029 ($m, AGR %)
Figure 4.29 Indonesia Thermal EOR Market Share by Spending Forecast, 2019, 2024 and 2029 (% Share)
Figure 4.30 Indonesian Oil Production and Proven Reserves 1980-2016 (MMbbl/yr, Billion bpd)
Figure 4.31 Kuwait Thermal EOR Production Market Forecast 2019-2029 (MMbbl/yr, AGR %)
Figure 4.32 Kuwait Thermal EOR Market Share by Production Forecast, 2019, 2024 and 2029 (% Share)
Figure 4.33 Kuwait Thermal EOR Spending Market Forecast 2019-2029 ($m, AGR %)
Figure 4.34 Kuwait Thermal EOR Market Share by Spending Forecast, 2019, 2024 and 2029 (% Share)
Figure 4.35 Oman Thermal EOR Production Market Forecast 2019-2029 (MMbbl/yr, AGR %)
Figure 4.36 Oman Thermal EOR Market Share by Production Forecast, 2019, 2024 and 2029 (% Share)
Figure 4.37 Oman Thermal EOR Spending Market Forecast 2019-2029 ($m, AGR %)
Figure 4.38 Oman Thermal EOR Market Share by Spending Forecast, 2019, 2024 and 2029 (% Share)
Figure 4.39 Omani Oil Production 2007-2017 (Thousand Barrels)
Figure 4.40 China Thermal EOR Production Market Forecast 2019-2029 (MMbbl/yr, AGR %)
Figure 4.41 China Thermal EOR Market Share by Production Forecast, 2019, 2024 and 2029 (% Share)
Figure 4.42 China Thermal EOR Spending Market Forecast 2019-2029 ($m, AGR %)
Figure 4.43 China Thermal EOR Market Share by Spending Forecast, 2019, 2024 and 2029 (% Share)
Figure 4.44 Russia Thermal EOR Production Market Forecast 2019-2029 (MMbbl/yr, AGR %)
Figure 4.45 Russia Thermal EOR Market Share by Production Forecast, 2019, 2024 and 2029 (% Share)
Figure 4.46 Russia Thermal EOR Spending Market Forecast 2019-2029 ($m, AGR %)
Figure 4.47 Russia Thermal EOR Market Share by Spending Forecast, 2019, 2024 and 2029 (% Share)
Figure 4.48 Egypt Thermal EOR Production Market Forecast 2019-2029 (MMbbl/yr, AGR %)
Figure 4.49 Egypt Thermal EOR Market Share by Production Forecast, 2019, 2024 and 2029 (% Share)
Figure 4.50 Egypt Thermal EOR Spending Market Forecast 2019-2029 ($m, AGR %)
Figure 4.51 Egypt Thermal EOR Market Share by Spending Forecast, 2019, 2024 and 2029 (% Share)
Figure 4.52 Rest of the World Thermal EOR Production Market Forecast 2019-2029 (MMbbl/yr, AGR %)
Figure 4.53 Rest of the World Thermal EOR Market Share by Production Forecast, 2019, 2024 and 2029 (% Share)
Figure 4.54 Rest of the World Thermal EOR Spending Market Forecast 2019-2029 ($m, AGR %)
Figure 4.55 Rest of the World Thermal EOR Market Share by Spending Forecast, 2019, 2024 and 2029 (% Share)
Figure 5.1 Global CO2 EOR Market Forecast 2019-2029 (MMbbl/yr, AGR %)
Figure 5.2 Global CO2 EOR Market Forecast 2019-2029 ($m, AGR%)
Figure 5.3 Leading National CO2 EOR Production and Market Share Forecast 2019 (%)
Figure 5.4 Leading National CO2 EOR Production and Market Share Forecast 2024 (%)
Figure 5.5 Leading National CO2 EOR Production and Market Share Forecast 2029 (%)
Figure 5.6 US CO2 EOR Production Market Forecast 2019-2029 (MMbbl/yr, AGR %)
Figure 5.7 US CO2 EOR Market Share by Production Forecast, 2019, 2024 and 2029 (% Share)
Figure 5.8 US CO2 EOR Spending Market Forecast 2019-2029 ($m, AGR %)
Figure 5.9 US CO2 EOR Market Share by Spending Forecast, 2019, 2024 and 2029 (% Share)
Figure 5.10 Location of U.S. Carbon Dioxide Enhanced Oil Recovery Projects, Carbon Dioxide Sources and Carbon Dioxide Pipelines
Figure 5.11 Naturally Occurring CO2 Production in the U.S. (MMscfd)
Figure 5.12 Naturally Occurring CO2 Proven Reserves in the U.S. (Bscf)
Figure 5.13 China CO2 EOR Production Market Forecast 2019-2029 (MMbbl/yr, AGR %)
Figure 5.14 China CO2 EOR Market Share by Production Forecast, 2019, 2024 and 2029 (% Share) 216
Figure 5.15 China CO2 EOR Spending Market Forecast 2019-2029 ($m, AGR %)
Figure 5.16 China CO2 EOR Market Share by Spending Forecast, 2019, 2024 and 2029 (% Share)
Figure 5.17 Canada CO2 EOR Production Market Forecast 2019-2029 (MMbbl/yr, AGR %)
Figure 5.18 Canada CO2 EOR Market Share by Production Forecast, 2019, 2024 and 2029 (% Share)
Figure 5.19 Canada CO2 EOR Spending Market Forecast 2019-2029 ($m, AGR %)
Figure 5.20 Canada CO2 EOR Market Share by Spending Forecast, 2019, 2024 and 2029 (% Share)
Figure 5.21 Illustration of the ACTL Project
Figure 5.22 UAE CO2 EOR Production Market Forecast 2019-2029 (MMbbl/yr, AGR %)
Figure 5.23 UAE CO2 EOR Market Share by Production Forecast, 2019, 2024 and 2029 (% Share)
Figure 5.24 UAE CO2 EOR Spending Market Forecast 2019-2029 ($m, AGR %)
Figure 5.25 UAE CO2 EOR Market Share by Spending Forecast, 2019, 2024 and 2029 (% Share)
Figure 5.26 Brazil CO2 EOR Production Market Forecast 2019-2029 (MMbbl/yr, AGR %)
Figure 5.27 Brazil CO2 EOR Market Share by Production Forecast, 2019, 2024 and 2029 (% Share)
Figure 5.28 Brazil CO2 EOR Spending Market Forecast 2019-2029 ($m, AGR %)
Figure 5.29 Brazil CO2 EOR Market Share by Spending Forecast, 2019, 2024 and 2029 (% Share)
Figure 5.30 Russia CO2 EOR Production Market Forecast 2019-2029 (MMbbl/yr, AGR %)
Figure 5.31 Russia CO2 EOR Market Share by Production Forecast, 2019, 2024 and 2029 (% Share)
Figure 5.32 Russia CO2 EOR Spending Market Forecast 2019-2029 ($m, AGR %)
Figure 5.33 Russia CO2 EOR Market Share by Spending Forecast, 2019, 2024 and 2029 (% Share)
Figure 5.34 Rest of Europe CO2 EOR Production Market Forecast 2019-2029 (MMbbl/yr, AGR %)
Figure 5.35 Rest of Europe CO2 EOR Market Share by Production Forecast, 2019, 2024 and 2029 (% Share)
Figure 5.36 Rest of Europe CO2 EOR Spending Market Forecast 2019-2029 ($m, AGR %)
Figure 5.37 Rest of Europe CO2 EOR Market Share by Spending Forecast, 2019, 2024 and 2029 (% Share)
Figure 5.38 Oil Production in the Leading Five European Countries 2007-2017 (MMbbl/yr)
Figure 5.39 Rest of the World CO2 EOR Production Market Forecast 2019-2029 (MMbbl/yr, AGR %)
Figure 5.40 Rest of the World CO2 EOR Market Share by Production Forecast, 2019, 2024 and 2029 (% Share)
Figure 5.41 Rest of the World CO2 EOR Spending Market Forecast 2019-2029 ($m, AGR %)
Figure 5.42 Rest of the World CO2 EOR Market Share by Spending Forecast, 2019, 2024 and 2029 (% Share)
Figure 6.1 Major Chemicals Used in Enhanced Oil Recovery
Figure 6.2 Major Trends Affecting the Chemical EOR Market
Figure 6.3 Chemical EOR Submarket Production Forecast 2019-2029 (MMbbl/yr, AGR %)
Figure 6.4 Chemical EOR Submarket Spending Forecast 2019-2029 ($mn, AGR %)
Figure 6.5 Factors Influencing the Economic Viability of a Chemical EOR Project
Figure 6.6 2017 Chemical EOR Projects by Location
Figure 6.7 2017 Chemical EOR Projects by API
Figure 6.8 2018 Chemical EOR Projects by Lithology
Figure 6.9 SWOT Analysis for Biopolymers
Figure 6.10 SWOT Analysis for Hybrid Approaches to Chemical EOR
Figure 6.11 SWOT Analysis for Nanotechnology Development
Figure 6.12 Locations of Known Active Chemical EOR Projects and Pilots 2017
Figure 6.13 Leading National Chemical EOR Production Forecasts 2019-2029 (MMbbl/yr)
Figure 6.14 Leading National Chemical EOR Spending Forecasts 2019-2029 ($mn)
Figure 6.15 Leading National Chemical EOR Production and Market Share Forecast 2019 (%)
Figure 6.16 Leading National Chemical EOR Production and Market Share Forecast 2024 (%)
Figure 6.17 Leading National Chemical EOR Production and Market Share Forecast 2029 (%)
Figure 6.18 The Chinese Chemical EOR Production Forecast, 2019-2029 (MMbbl/yr, AGR %)
Figure 6.19 The Chinese Chemical EOR Production Share Forecast 2019, 2024 and 2029 (%)
Figure 6.20 The Chinese Chemical EOR Spending Forecast, 2019-2029 ($mn, AGR %)
Figure 6.21 The Chinese Chemical EOR Spending Share Forecast 2019, 2024 and 2029 (%)
Figure 6.22 Major Chemical EOR Projects in China
Figure 6.23 Chemical EOR Developments within the Daqing Field, China 1970-2007
Figure 6.24 Chinese Chemical EOR Project Breakdown
Figure 6.25 The Canadian Chemical EOR Production Forecast, 2019-2029 (MMbbl/yr, AGR %
Figure 6.26 The Canadian Chemical EOR Production Share Forecast 2019, 2024 and 2029 (%)
Figure 6.27 The Canadian Chemical EOR Spending Forecast, 2019-2029 ($mn, AGR %)
Figure 6.28 The Canadian Chemical EOR Spending Share Forecast 2019, 2024 and 2029 (%)
Figure 6.29 Total Oil Production in Canada by Year 2007-2017 (‘000 bbl/d)
Figure 6.30 Top 10 Oil Producers Globally 2018 (MMbpd)
Figure 6.31 Timeline of Developments in the Pelican Lake Field, Canada 1970-2005
Figure 6.32 Chemical EOR Projects in Alberta, Canada 1982-2014 (Alkaline, AP, ASP, Polymer, Other)
Figure 6.33 The Russian Chemical EOR Production Forecast, 2019-2029 (MMbbl/yr, AGR %)
Figure 6.34 The Russian Chemical EOR Production Share Forecast 2019, 2024 and 2029 (%)
Figure 6.35 The Russian Chemical EOR Spending Forecast, 2019-2029 ($mn, AGR %)
Figure 6.36 The Russian Chemical EOR Spending Share Forecast 2019, 2024 and 2029 (%)
Figure 6.37 The Omani Chemical EOR Production Forecast, 2019-2029 (MMbbl/yr, AGR %)
Figure 6.38 The Omani Chemical EOR Production Share Forecast 2019, 2024 and 2029 (%)
Figure 6.39 The Omani Chemical EOR Spending Forecast, 2019-2029 ($mn, AGR %)
Figure 6.40 The Omani Chemical EOR Spending Share Forecast 2019, 2024 and 2029 (%)
Figure 6.41 Estimated Oil Recovery Before and After Polymer Flooding (%)
Figure 6.42 The Rest of Middle East Chemical EOR Production Forecast, 2019-2029 (MMbbl/yr, AGR %)
Figure 6.43 The Rest of Middle East Chemical EOR Production Share Forecast 2019, 2024 and 2029 (%)
Figure 6.44 The Rest of Middle East Chemical EOR Spending Forecast, 2019-2029 ($mn, AGR %)
Figure 6.45 The Rest of Middle East Chemical EOR Spending Share Forecast 2019, 2024 and 2029 (%)
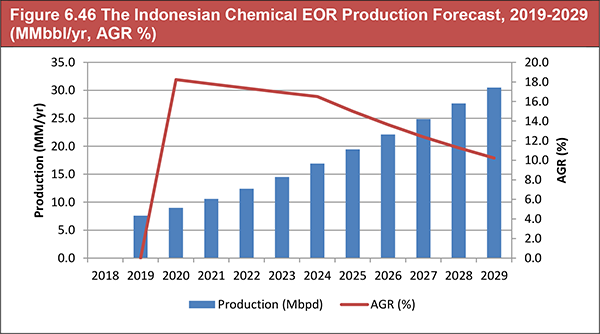
Figure 6.46 The Indonesian Chemical EOR Production Forecast, 2019-2029 (MMbbl/yr, AGR %)
Figure 6.47 The Indonesian Chemical EOR Production Share Forecast 2019, 2024 and 2029 (%)
Figure 6.48 The Indonesian Chemical EOR Spending Forecast, 2019-2029 ($mn, AGR %)
Figure 6.49 The Indonesian Chemical EOR Spending Share Forecast 2019, 2024 and 2029 (%)
Figure 6.50 Indonesian Oil Production and Proven Reserves 1980-2014 (Thousand bpd, Billion Barrels)
Figure 6.51 The Egyptian Chemical EOR Production Forecast, 2019-2029 (MMbbl/yr, AGR %)
Figure 6.52 The Egyptian Chemical EOR Production Share Forecast 2019, 2024 and 2029 (%)
Figure 6.53 The Egyptian Chemical EOR Spending Forecast, 2019-2029 ($mn, AGR %)
Figure 6.54 The Egyptian Chemical EOR Spending Share Forecast 2019, 2024 and 2029 (%)
Figure 6.55 The Brazilian Chemical EOR Production Forecast, 2019-2029 (MMbbl/yr, AGR %)
Figure 6.56 The Brazilian Chemical EOR Production Share Forecast 2019, 2024 and 2029 (%)
Figure 6.57 The Brazilian Chemical EOR Spending Forecast, 2019-2029 ($mn, AGR %)
Figure 6.58 The Brazilian Chemical EOR Spending Share Forecast 2019, 2024 and 2029 (%)
Figure 6.59 The Rest of Latin America Chemical EOR Production Forecast, 2019-2029 (MMbbl/yr, AGR %)
Figure 6.60 The Rest of Latin America Chemical EOR Production Share Forecast 2019, 2024 and 2029 (%)
Figure 6.61 The Rest of Latin America Chemical EOR Spending Forecast, 2019-2029 ($mn, AGR %)
Figure 6.62 The Rest of Latin America Chemical EOR Spending Share Forecast 2019, 2024 and 2029 (%)
Figure 6.63 The US Chemical EOR Production Forecast, 2019-2029 (MMbbl/yr, AGR %)
Figure 6.64 The US Chemical EOR Production Share Forecast 2019, 2024 and 2029 (%)
Figure 6.65 The US Chemical EOR Spending Forecast, 2019-2029 ($mn, AGR %)
Figure 6.66 The US Chemical EOR Spending Share Forecast 2019, 2024 and 2029 (%)
Figure 6.67 Locations of US Chemical Pilot Projects by Type: ASP, Alkaline, AP, AS and SP
Figure 6.68 Department of Energy Funding Allocation, Ultra-Deepwater Vs. Unconventional Resources Vs. Small Producer
Figure 6.69 The Indian Chemical EOR Production Forecast, 2019-2029 (MMbbl/yr AGR %)
Figure 6.70 The Indian Chemical EOR Production Share Forecast 2019, 2024 and 2029 (%)
Figure 6.71 The Indian Chemical EOR Spending Forecast, 2019-2029 ($mn, AGR %)
Figure 6.72 The Indian Chemical EOR Spending Share Forecast 2019, 2024 and 2029 (%)
Figure 6.73 Total Oil Production in India 2007-2017 (‘000 bbl/d)
Figure 6.74 Oil Production and Consumption in India 2007-2017 (‘000 bbl/d, Million Tonnes Oil Equivalent)
Figure 6.75 The Rest of the World Chemical EOR Production Forecast, 2019-2029 (MMbbl/yr, AGR %)
Figure 6.76 The Rest of the World Chemical EOR Production Share Forecast 2019, 2024 and 2029 (%)
Figure 6.77 The Rest of the World Chemical EOR Spending Forecast, 2019-2029 ($mn, AGR %)
Figure 6.78 The Rest of the World Chemical EOR Spending Share Forecast 2019, 2024 and 2029 (%)
Figure 6.79 The Malaysian Chemical EOR Production Forecast, 2019-2029 (MMbbl/yr, AGR %)
Figure 6.80 The Malaysian Chemical EOR Production Share Forecast 2019, 2024 and 2029 (%)
Figure 6.81 The Malaysian Chemical EOR Spending Forecast, 2019-2029 ($mn, AGR %)
Figure 6.82 The Malaysian Chemical EOR Spending Share Forecast 2019, 2024 and 2029 (%)
ADNOC
Aera Energy
Agrium
Andora energy
Athabasca Oil
Basin Electric Power Cooperative
Baytex Energy
BlackPearl Resources
BP
Brion Energy
Cairn Energy India
California Resources
Cenovus
Chaparral Energy Inc
Chevron
Citgo Petroleum Group
CNOOC
CNPC
CNRL
Connacher Oil & Gas
ConocoPhillips
Continental Resources
Denbury Resources
Devon Energy
Emirates Steel Industries
Energy Midale
Enhance Energy
Equinor (Statoil)
ExxonMobil
Fleur de Lis Energy
Harvest Operations
Hess Corporation
Hilcorp Energy Company
Husky Energy
IFP Energies Nouvelles
Imperial Oil
Japan Canada Oil Sands
KGOC
Kuwait Gulf Oil Company
Kuwait Petroleum Corporation
Laricina Energy
Linc Energy
Linn Energy
Lukoil
Maha Energy
Marathon Oil
MEG Energy
Naftex
NAM
Nexen
Occidental
OPEC
Osum
Pan American Energy
PDO
PDVSA
Pengrowth Energy
Pertamina
Petro River Oil
Petro-Canada
Petronas
Prosper Petroleum
Rex Energy
Royal Dutch Shell
SaskPower
Seneca Resources
Sinopec
SKK Migas (BP Migas)
Southern Pacific Resources
Suncor
Sunshine Oil Sands
Total
Touchstone
Whiting Petroleum Corporation
Zargon Oil and Gas
Organisations Mentioned
US Energy Information Administration (EIA)
Research Partnership to Secure Energy for America (RPSEA)
National Energy Technology Laboratory (NETL)
Petroleum Administration for Defense Districts
Enhanced Oil Recovery Institute (EORI)
China National Offshore Oil Corporation (CNOOC)
Centre of Excellence in EOR
Bayou State
Download sample pages
Complete the form below to download your free sample pages for EOR Yearbook 2019: The Ultimate Guide to Enhanced Oil Recovery (EOR)
Related reports
-

Chemical Enhanced Oil Recovery (EOR) Market Report 2022-2032
The Chemical Enhanced Oil Recovery (EOR) market was valued at more than US$4.00 billion in 2022 and is projected to...Full DetailsPublished: 18 November 2022 -

Thermal Enhanced Oil Recovery (EOR) Market Report 2020-2030
This market is expected to grow at a faster pace, owing to continuous work over oil fields, rapid depletion of...
Full DetailsPublished: 27 November 2019 -

Carbon Dioxide (CO2) Enhanced Oil Recovery (EOR) Market 2017-2027
The latest report from business intelligence provider visiongain offers in Depth analysis of the global carbon dioxide (CO2) enhanced oil...
Full DetailsPublished: 08 August 2017 -

Onshore Oil & Gas Pipelines Market Report 2019-2029
Visiongain’s extensive and detailed 427-page report reveals that onshore oil and gas pipeline infrastructure will experience CAPEX of $1,291.3bn in...Full DetailsPublished: 08 March 2019 -

Carbon Dioxide (CO2) Enhanced Oil Recovery (EOR) Market Report 2022-2032
The global CO2 enhanced oil recovery market was valued at US$3,735 million in 2021 and is projected to grow at...Full DetailsPublished: 25 July 2022 -

Land Seismic Equipment & Acquisition Market Forecast 2019-2029
Visiongain has calculated that the global Land Seismic Equipment & Acquisition Market will see a capital expenditure (CAPEX) of $2,405mn...
Full DetailsPublished: 27 March 2019 -

Multi-Well Drilling Market Forecast 2017-2027
The latest research report from business intelligence provider Visiongain offers comprehensive analysis of the Multi-Well Drilling market. Visiongain assesses that...
Full DetailsPublished: 19 May 2017 -

Marine Seismic Equipment & Acquisition Market Forecast 2019-2029
Visiongain assesses that marine seismic equipment and acquisition market will reach $5.39bn in 2019. ...Full DetailsPublished: 21 June 2019 -

Pipeline Leak Detection Market of the Oil and Gas Industry 2019-2029
Pipeline Leak Detection market of the oil and gas industry market worth $2.8 billion in 2019. ...Full DetailsPublished: 06 August 2019 -
Chemical Enhanced Oil Recovery (EOR) Market Report 2020-2030
Increasing oil consumption, high recovery rates through successful implementation of CEOR, coupled with high cost of new exploration is expected...Full DetailsPublished: 13 October 2020
Download sample pages
Complete the form below to download your free sample pages for EOR Yearbook 2019: The Ultimate Guide to Enhanced Oil Recovery (EOR)
Do you have any custom requirements we can help you with?
Any specific country, geo region, market segment or specific company information?
Email us today, we can discuss your needs and see how we can help: jamie.roberts@visiongain.com
Would you like a free report overview of the report of your choice?
If so, please drop an email to Jamie Roberts stating your chosen report title to jamie.roberts@visiongain.com
Visiongain energy reports are compiled using a broad and rich mixture of both primary and secondary information to produce an overall industry outlook. In order to provide our clients with the best product possible product, we do not rely on any one single source of information. Visiongain analysts reach out to market-leading vendors and industry experts where possible but also review a wealth of financial data and product information from a vast range of sources. To find out more about our reports methodology, please email jamie.roberts@visiongain.com
Would you like to get the latest Visiongain energy reports catalogue?
What are the dynamic growth sectors? where are the regional business opportunities?
Which technologies will prevail and who are the leading companies succeeding in these sectors and why?
If you want definitive answers to business critical questions, discover Visiongain’s full range of business intelligence reports.
If so, please email Jamie Roberts on jamie.roberts@visiongain.com or call her today on +44 207 336 6100
“The Visiongain report was extremely insightful and helped us construct our basic go-to market strategy for our solution.”
H.
“F.B has used Visiongain to prepare two separate market studies on the ceramic proppants market over the last 12 months. These reports have been professionally researched and written and have assisted FBX greatly in developing its business strategy and investment plans.”
F.B
“We just received your very interesting report on the Energy Storage Technologies (EST) Market and this is a very impressive and useful document on that subject.”
I.E.N
“Visiongain does an outstanding job on putting the reports together and provides valuable insight at the right informative level for our needs. The EOR Visiongain report provided confirmation and market outlook data for EOR in MENA with the leading countries being Oman, Kuwait and eventually Saudi Arabia.”
E.S
“Visiongain produced a comprehensive, well-structured GTL Market report striking a good balance between scope and detail, global and local perspective, large and small industry segments. It is an informative forecast, useful for practitioners as a trusted and upto-date reference.”
Y.N Ltd
Association of Dutch Suppliers in the Oil & Gas Industry
Society of Naval Architects & Marine Engineers
Association of Diving Contractors
Association of Diving Contractors International
Associazione Imprese Subacquee Italiane
Australian Petroleum Production & Exploration Association
Brazilian Association of Offshore Support Companies
Brazilian Petroleum Institute
Canadian Energy Pipeline
Diving Medical Advisory Committee
European Diving Technology Committee
French Oil and Gas Industry Council
IMarEST – Institute of Marine Engineering, Science & Technology
International Association of Drilling Contractors
International Association of Geophysical Contractors
International Association of Oil & Gas Producers
International Chamber of Shipping
International Shipping Federation
International Marine Contractors Association
International Tanker Owners Pollution Federation
Leading Oil & Gas Industry Competitiveness
Maritime Energy Association
National Ocean Industries Association
Netherlands Oil and Gas Exploration and Production Association
NOF Energy
Norsk olje og gass Norwegian Oil and Gas Association
Offshore Contractors’ Association
Offshore Mechanical Handling Equipment Committee
Oil & Gas UK
Oil Companies International Marine Forum
Ontario Petroleum Institute
Organisation of the Petroleum Exporting Countries
Regional Association of Oil and Natural Gas Companies in Latin America and the Caribbean
Society for Underwater Technology
Society of Maritime Industries
Society of Petroleum Engineers
Society of Petroleum Enginners – Calgary
Step Change in Safety
Subsea UK
The East of England Energy Group
UK Petroleum Industry Association
All the events postponed due to COVID-19.
Don’t Miss Out!
Subscribe to receive the latest Industry news, trending insight and analysis straight to your inbox.Choose your preferences:
Latest Energy news
Energy as a Service (EaaS) Market
The global Energy as a Service (EaaS) market is projected to grow at a CAGR of 12.6% by 2034
25 July 2024
Synthetic Fuels Market
The global Synthetic Fuels market is projected to grow at a CAGR of 23% by 2034
18 July 2024
Power-to-X (P2X) Market
The global Power-to-X (P2X) market is projected to grow at a CAGR of 10.6% by 2034
09 July 2024
Airborne Wind Energy Market
The global Airborne Wind Energy market is projected to grow at a CAGR of 9.7% by 2034
05 June 2024
