Industries > Energy > Onshore Oil & Gas Pipelines Market Report 2019-2029
Onshore Oil & Gas Pipelines Market Report 2019-2029
CAPEX ($bn) and Added and Existing Pipeline Length (km) Forecasts for Cross Border & Interstate Trunk and Transmission Pipelines Transporting Heavy, Ultra Heavy and Light Crude Oil and Dilbit, Refined Petroleum Products, NGLs (e.g. Condensate, LPG) and Processed and Unprocessed Natural Gas Plus Analysis on Leading Companies and Regional and Leading National Market Analysis and Forecasts
Visiongain’s extensive and detailed 427-page report reveals that onshore oil and gas pipeline infrastructure will experience CAPEX of $1,291.3bn in 2019.
If you are involved in the pipelines industry or intend to be, then you must read this report. It’s vital you keep your market knowledge up to date.
Market scope: Oil & gas pipelines are an essential part of hydrocarbon transportation and distribution and required to ensure the smooth operation of the energy industry. They are the most effective and economical means of transporting oil and gas. 2018 was an exciting year for the industry as many new projects kicked off and received government clearances for the standoff pipeline projects. The market is currently experiencing several important changes, with strong economic and population growth in some developing countries. The stabilising oil price in mid-2018 has created a positive scenario for the new investments across the oil and gas pipeline industry.
This report represents a significantly expanded scope with freshly analysed content including an updated database of major existing pipelines in each region, analysis of 10 leading national markets, five regions, a description of major geopolitical trends, analysis of the factors leading to the oil price collapse, PLUS an in-depth analysis of the oil price’s relevance to the pipelines market.
You will find in-depth discussions of five of the largest market uncertainties presently:
• Analysis and scenario forecasts relating to the oil price fall
• Argentina shale possibilities
• Mexican constitutional reform
• Asia’s growing demand
• Geopolitical instability in the Middle East
Read on to discover more. This extensive 427-page report contains 215 tables and figures for you to examine, providing a thorough assessment of the pipelines market.
The Onshore Oil & Gas Pipelines Market Report 2019-2029 report responds to your need for definitive oil & gas pipelines market data:
• Where are the oil & gas pipelines market opportunities?
– 215 tables, charts, and graphs reveal market data allowing you to target your strategy. Find global baselines and forecasts for onshore pipeline network length (km) in each of the 10 forecast countries, in each of the 5 regions, and globally.
• When will the oil & gas pipelines market grow?
– Global, regional and leading national market oil & gas pipelines CAPEX and pipeline length (km) forecasts and analysis from 2019-2029
• Which oil & gas pipelines application submarkets will flourish from 2019-2029 by CAPEX and Pipeline Length?
– Oil Pipeline Submarket Forecast 2019-2029
– Gas Pipeline Submarket Forecast 2019-2029
• Where are the regional oil & gas pipelines market opportunities from 2019-2029?
– Five regions are analysed in the report both in terms of CAPEX levels from 2019-2029, but also in terms of additional pipeline network length (km) and total length (km):
– North America Oil & Gas Pipelines Forecast 2019-2029
– Europe Oil & Gas Pipelines Forecast 2019-2029
– Asia Pacific Oil & Gas Pipelines Forecast 2019-2029
– Middle East And Africa Oil & Gas Pipelines Forecast 2019-2029
– Latin America Oil & Gas Pipelines Forecast 2019-2029
– The following 10 national markets represent the countries of greatest opportunity in the coming ten years in terms of overall market growth into 2029. Capex, additional pipeline network length (km) and total length (km) are revealed from 2019-2029:
– United States Oil & Gas Pipelines Forecast 2019-2029
– Canada Oil & Gas Pipelines Forecast 2019-2029
– Mexico Oil & Gas Pipelines Forecast 2019-2029
– Russia Oil & Gas Pipelines Forecast 2019-2029
– China Oil & Gas Pipelines Forecast 2019-2029
– India Oil & Gas Pipelines Forecast 2019-2029
– Iran Oil & Gas Pipelines Forecast 2019-2029
– Egypt Oil & Gas Pipelines Forecast 2019-2029
– Brazil Oil & Gas Pipelines Forecast 2019-2029
– Argentina Oil & Gas Pipelines Forecast 2019-2029
• Where are the major oil & gas pipelines contracts, projects and programmes?
– An extensive database of 38 tables reveals existing and proposed major trunk/transmission oil and gas pipelines globally, divided by region and country.
• Who are the leading oil & gas pipelines companies?
– Dominion Energy
– Enbridge
– Energy Transfer LP
– Gas India Limited
– Gazprom
– Kinder Morgan
– Plains All American
– The Comision Federal de Electricidad
– TransCanada
– William Partners LP
• What are the factors influencing oil & gas pipelines market dynamics?
– Technological issues and constraints
– Political risk and security issues
– Supply and demand dynamics
– Analysis of barriers to entry
– Demographic changes
Buy our report the Onshore Oil & Gas Pipelines Market Report 2019-2029: CAPEX ($bn) and Added and Existing Pipeline Length (km) Forecasts for Cross Border & Interstate Trunk and Transmission Pipelines Transporting Heavy, Ultra Heavy and Light Crude Oil and Dilbit, Refined Petroleum Products, NGLs (e.g. Condensate, LPG) and Processed and Unprocessed Natural Gas Plus Analysis on Leading Companies and Regional and Leading National Market Analysis and Forecasts today. Avoid missing out – order our report now and keep your knowledge ahead of your competitors.
Visiongain is a trading partner with the US Federal Government
CCR Ref number: KD4R6
1.1 Global Onshore Oil & Gas Pipelines Market Overview
1.2 Market Segmentation
1.3 Market Definition
1.4 Methodology
1.5 Why You Should Read This Report
1.6 How This Report Delivers
1.7 Key Questions Answered by This Analytical Report Include:
1.8 Who is This Report For?
1.9 Frequently Asked Questions (FAQ)
1.10 Associated Visiongain Reports
1.11 About Visiongain
2. Introduction to the Onshore Oil & Gas Pipelines Market
2.1 Pipeline Types
2.2 Pipeline Construction
2.2.1 The Pipeline Construction Process
2.3 Pipeline Operation
2.4 Safety and Leak Detection
3. Global Onshore Oil & Gas Pipelines Market 2019-2029
3.1 Global Onshore Oil & Gas Pipelines Market Forecast 2019-2029
3.1.1 Regional Oil & Gas Pipelines Market Forecast 2019-2029
3.2 Drivers and Restraints in the Onshore Oil & Gas Pipelines Market
3.2.1 Drivers in the Onshore Oil & Gas Pipelines Market
3.2.1.1 Demand & Supply Dynamics
3.2.1.2 Unconventional Oil & Gas Development
3.2.1.3 Emerging Markets Growth
3.2.1.4 The Desire for Energy Security
3.2.1.5 Technological Advances
3.2.1.6 International Relations
3.2.2 Restraints in the Onshore Oil & Gas Pipelines Market
3.2.2.1 Ability to Raise Capital
3.2.2.2 Liquefied Natural Gas (LNG) Competition
3.2.2.3 Slow Economic Growth and Energy Demand
3.2.2.4 Political Instability/Security Concerns
3.2.2.5 Complex Monitoring Processes
3.2.2.6 Pipeline Damage
3.2.2.7 Social and Environmental Concerns
4. Global Onshore Oil & Gas Pipelines Submarket Forecast 2019-2029
4.1 Global Oil Pipelines Submarket Forecast 2019-2029
4.2 Global Gas Pipelines Submarket Forecast 2019-2029
5. North America Onshore Oil & Gas Pipelines Market 2019-2029
5.1 The North America Onshore Oil & Gas Pipelines CAPEX and Length Forecasts and Analysis 2019-2029
5.1.1 The North American Oil & Gas Pipelines Market Drivers and Restraints
5.1.2 Drivers
5.1.2.1 Low Risk
5.1.2.2 Large Distances
5.1.2.3 Increased Supply
5.1.2.4 Transportation Advantages
5.1.3 Restraints
5.1.3.1 Expanding Environmental Movement
5.1.3.2 Transport Competition
5.2 The North America Oil & Gas Pipelines Submarket Forecasts and Analysis 2019-2029
5.2.1 North American Oil Pipelines Submarket Analysis 2019-2029
5.2.2 North American Gas Pipelines Submarket Analysis 2019-2029
5.3 North American Oil & Gas Pipeline Project Tables
5.4 The US Onshore Oil & Gas Pipelines CAPEX and Length Forecasts and Analysis 2019-2029
5.4.1 US Oil Pipelines Submarket Analysis 2019-2029
5.4.1.1 Dakota Access Pipeline
5.4.2 US Gas Pipelines Submarket Analysis 2019-2029
5.5 Canada Onshore Oil & Gas Pipelines Submarket Forecasts and Analysis 2019-2029
5.5.1 Canada Oil Pipelines Submarket Analysis 2019-2029
5.5.1.1 Keystone XL
5.5.2 Canada Gas Pipelines Submarket Analysis 2019-2029
5.6 Mexico Oil & Gas Pipelines Submarket Forecasts and Analysis 2019-2029
5.6.1 Mexico Oil Pipelines Submarket Analysis 2019-2029
5.6.2 Mexico Gas Pipelines Submarket Analysis 2019-2029
6. Europe Onshore Oil & Gas Pipelines Market 2019-2029
6.1 Europe Onshore Oil & Gas Pipeline Market CAPEX and Length Forecasts and Analysis 2019-2029
6.2 Europe Oil & Gas Pipelines Submarket Forecasts and Analysis 2019-2029
6.2.1 Europe Oil & Gas Pipelines Market Drivers and Restraints
6.2.2 Drivers
6.2.2.1 Shift to Natural Gas
6.2.2.2 Resource Independence
6.2.2.3 Ageing Existing Infrastructure
6.2.3 Restraints
6.2.3.1 Slow Consumption Growth
6.2.3.2 Slow Production
6.2.3.3 Focus on Renewable Energy
6.2.4 Europe Oil Pipelines Submarket Analysis 2019-2029
6.2.5 Europe Gas Pipelines Submarket Analysis 2019-2029
6.2.5.1 Trans-Adriatic Pipeline (TAP)
6.3 Europe Oil & Gas Pipeline Project Tables
6.4 Russia Oil & Gas Pipelines Submarket Forecasts and Analysis 2019-2029
6.4.1 Russia Oil Pipelines Submarket Analysis 2019-2029
6.4.2 Russia Gas Pipelines Submarket Analysis 2019-2029
6.4.2.1 TurkStream
6.4.2.2 Nord Stream 2
6.5 Rest of Europe Oil & Gas Pipelines Submarket Forecasts and Analysis 2019-2029
6.5.1 Rest of Europe Oil Pipelines Submarket Analysis 2019-2029
6.5.2 Rest of Europe Gas Pipelines Submarket Analysis 2019-2029
7. Asia Pacific Onshore Oil & Gas Pipelines Market 2019-2029
7.1 Asia Pacific Onshore Oil & Gas Pipeline Market CAPEX and Length Forecasts and Analysis 2019-2029
7.2 Asia Pacific Oil & Gas Pipelines Submarket Forecasts and Analysis 2019-2029
7.2.1 Asia Pacific Oil & Gas Pipelines Market Drivers and Restraints
7.2.2 Drives
7.2.2.1 High Demand
7.2.2.2 Unconventional Production Potential
7.2.2.3 Political Support and International Relations
7.2.3 Restraints
7.2.3.1 Slow Consumption Demand
7.2.3.2 Renewable Energy Expansion
7.2.3.3 LNG Competition
7.2.4 Asia Pacific Oil Pipelines Submarket Analysis 2019-2029
7.2.5 Asia Pacific Gas Pipelines Submarket Analysis 2019-2029
7.3 Asia Pacific Oil & Gas Pipeline Project Tables
7.4 China Oil & Gas Pipelines Submarket Forecasts and Analysis 2019-2029
7.4.1 China Oil Pipelines Submarket Analysis 2019-2029
7.4.2 China Gas Pipelines Submarket Analysis 2019-2029
7.4.2.1 The Power of Siberia Pipeline
7.5 India Oil & Gas Pipelines Submarket Forecasts and Analysis 2019-2029
7.5.1 India Oil Pipelines Submarket Analysis 2019-2029
7.5.2 India Gas Pipelines Submarket Analysis 2019-2029
7.6 Rest of Asia Pacific Oil & Gas Pipelines Submarket Forecasts and Analysis 2019-2029
7.6.1 Rest of Asia Pacific Oil Pipelines Submarket Analysis 2019-2029
7.6.2 Rest of Asia Pacific Gas Pipelines Submarket Analysis 2019-2029
8. The Middle East and Africa Onshore Oil & Gas Pipelines Market 2019-2029
8.1 The Middle East and Africa Onshore Oil & Gas Pipeline Market CAPEX and Length Forecasts and Analysis 2019-2029
8.2 Middle East and Africa Oil & Gas Pipelines Submarket Forecasts and Analysis 2019-2029
8.2.1 The Middle East and Africa Oil & Gas Pipelines Drivers and Restraints
8.2.2 Drivers
8.2.2.1 Large Reserves and High Output
8.2.2.2 Rising Population and Consumption
8.2.2.3 Positive International Relations
8.2.2.4 Low-Cost labour
8.2.2.5 Substantial Undeveloped Reserves
8.2.2.6 Shale Potential
8.2.3 Restraints
8.2.3.1 Shifting from Oil Dependence
8.2.3.2 The Threat of Violence and Political Instability
8.2.4 Middle East & Africa Oil Pipelines Submarket Analysis
8.2.5 Middle East & Africa Gas Pipelines Submarket Analysis
8.3 Middle East and Africa Oil & Gas Pipeline Project Tables
8.4 Iran Oil & Gas Pipelines Submarket Forecasts and Analysis 2019-2029
8.4.1 Iran Oil Pipelines Submarket Analysis 2019-2029
8.4.2 Iran Gas Pipelines Submarket Analysis 2019-2029
8.5 Egypt Oil & Gas Pipelines Submarket Forecasts and Analysis 2019-2029
8.5.1 Egypt Oil Pipelines Submarket Analysis 2019-2029
8.5.2 Egypt Gas Pipelines Submarket Analysis 2019-2029
8.6 Rest of MEA Oil & Gas Pipelines Submarket Forecasts and Analysis 2019-2029
8.6.1 Rest of MEA Oil Pipelines Submarket Analysis 2019-2029
8.6.2 Rest of MEA Gas Pipelines Submarket Analysis 2019-2029
9. Latin America Onshore Oil & Gas Pipelines Market 2019-2029
9.1 Latin America Onshore Oil & Gas Pipeline Market CAPEX and Length Forecasts and Analysis 2019-2029
9.2 Latin America Oil & Gas Pipelines Submarket Forecasts and Analysis 2019-2029
9.2.1 Latin America Oil & Gas Pipeline Market Drivers and Restraints
9.2.2 Drivers
9.2.2.1 Abundant Conventional and Unconventional Oil and Gas Resources
9.2.2.2 Increasing Demand
9.2.2.3 Lack of Cross-Border Connectivity
9.2.2.4 Political Reform
9.2.2.5 International Relationships
9.2.3 Restraints
9.2.3.1 Low Security/High Risk
9.2.3.2 Oil Price Sensitivity
9.2.3.3 Growth in Renewable Energy Sources
9.2.4 Latin America Oil Pipelines Submarket Analysis
9.2.5 Latin America Gas Pipelines Submarket Analysis
9.3 Latin America Oil & Gas Pipeline Project Tables
9.4 Brazil Oil & Gas Pipelines Submarket Forecasts and Analysis 2019-2029
9.4.1 Brazil Oil Pipelines Submarket Analysis 2019-2029
9.4.2 Brazil Gas Pipelines Submarket Analysis 2019-2029
9.5 Argentina Oil & Gas Pipelines Submarket Forecasts and Analysis 2019-2029
9.5.1 Argentina Oil Pipelines Submarket Analysis 2019-2029
9.5.2 Argentina Gas Pipelines Submarket Analysis 2019-2029
9.6 Rest of Latin America Oil & Gas Pipelines Submarket Forecasts and Analysis 2019-2029
9.6.1 Rest of Latin America Oil Pipelines Submarket Analysis 2019-2029
9.6.2 Rest of Latin America Gas Pipelines Submarket Analysis 2019-2029
10. PEST Analysis of the Onshore Oil & Gas Pipeline Market
10.1 Political
10.2 Economic
10.3 Social
10.4 Technological
11. The Leading Companies in the Onshore Oil & Gas Pipelines Market
11.1 Dominion Energy
11.2 Enbridge Inc.
11.3 Energy Transfer LP
11.4 Gas India Limited (GAIL)
11.5 Gazprom
11.6 Kinder Morgan
11.7 Plains All American
11.8 TransCanada Corporation
11.9 The Comisión Federal de Electricidad (CFE)
11.10 Williams Partners L.P.
12. Conclusions and Recommendations
12.1 Key Findings
12.2 Recommendations
13. Glossary
Appendix 1 Database of Existing Major Oil and Gas Pipelines
Appendix 1.1 North American Oil and Gas Pipelines
Appendix 1.2 Latin America Oil and Gas Pipelines
Appendix 1.3 Europe Oil and Gas Pipelines
Appendix 1.4 Asia Pacific Oil and Gas Pipelines
Appendix 1.5 Middle East Oil and Gas Pipelines
Appendix 1.6 Africa Oil and Gas Pipelines
Associated Visiongain Reports
Visiongain Report Sales Order Form
Appendix A
About Visiongain
Appendix B
Visiongain Report Evaluation Form
List of Figures
Figure 1.1 Global Oil and Gas Consumption Forecasts 2015-2035 (MMtoe)
Figure 1.2 Global Oil & Gas Pipelines Market Segmentation Overview
Figure 1.3 Global Oil & Gas Geographical Market Segmentation Overview
Figure 3.1 Global Onshore Oil & Gas Pipelines CAPEX Forecast 2019-2029 ($bn, AGR %)
Figure 3.2 Global Onshore Oil & Gas Pipelines Total Length Forecast 2019-2029 (Thousand KM, AGR %)
Figure 3.3 Regional Onshore Oil & Gas Pipelines CAPEX Forecast 2019-2029 ($bn, AGR %)
Figure 3.4 Regional Onshore Oil & Gas Pipelines Added and Existing Length Forecast 2019-2029 (Thousand KM, AGR %)
Figure 3.5 Global Onshore Oil & Gas Pipelines Share Forecast By CAPEX and Total Length 2019 (%)
Figure 3.6 Global Onshore Oil & Gas Pipelines Share Forecast By CAPEX and Total Length 2024 (%)
Figure 3.7 Global Onshore Oil & Gas Pipelines Share Forecast By CAPEX and Total Length 2029 (%)
Figure 4.1 Global Oil Pipelines CAPEX Forecast 2019-2029 ($bn, AGR %)
Figure 4.2 Regional Oil Pipelines CAPEX Forecast 2019-2029 ($bn, AGR %)
Figure 4.3 Global Oil Pipelines Total Length Forecast 2019-2029 (‘000 km, AGR %)
Figure 4.4 Regional Oil Pipelines Total Length 2019-2029 (‘000 km, AGR %)
Figure 4.5 Global Gas Pipelines CAPEX Forecast 2019-2029 ($bn, AGR %)
Figure 4.6 Regional Gas Pipelines CAPEX Forecast 2019-2029 ($bn, AGR %)
Figure 4.7 Global Gas Pipelines Total Length Forecast 2019-2029 (‘000 km, AGR %)
Figure 4.8 Regional Gas Pipelines Total Length Forecast 2019-2029 (‘000 km, AGR %)
Figure 5.1 North America Onshore Oil & Gas Pipelines CAPEX Forecast By Country 2019-2029 ($bn, AGR %)
Figure 5.2 North America Onshore Oil & Gas Pipelines Total Length Forecast by Country 2019-2029 (Thousand KM, AGR %)
Figure 5.3 North America Onshore Oil & Gas Pipelines CAPEX Forecast by Submarket 2019-2029 ($bn, AGR %)
Figure 5.4 North America Onshore Oil & Gas Pipelines CAPEX Share Forecast by Submarket 2019, 2024 and 2029 (% Share)
Figure 5.5 North America Onshore Oil & Gas Pipelines Total Length Forecast by Submarket 2019-2029 (Thousand KM, AGR %)
Figure 5.6 North America Onshore Oil & Gas Pipelines Total Length Share Forecast By Submarket 2019, 2024 and 2029 (% Share)
Figure 5.7 US Onshore Oil & Gas Pipelines CAPEX Forecast by Submarket 2019-2029 ($bn, AGR %)
Figure 5.8 US Onshore Oil & Gas Pipelines CAPEX Share Forecast by Submarket 2019, 2024 and 2029 (% Share)
Figure 5.9 US Onshore Oil & Gas Pipelines Total Length Forecast by Submarket 2019-2029 (Thousand KM, AGR %)
Figure 5.10 US Onshore Oil & Gas Pipelines Total Length Forecast by Submarket 2019, 2024 and 2029 (% Share)
Figure 5.11 Canada Onshore Oil & Gas Pipelines CAPEX Forecast by Submarket 2019-2029 ($bn, AGR %)
Figure 5.12 Canada Onshore Oil & Gas Pipelines CAPEX Forecast by Submarket 2019, 2024 and 2029 (% Share)
Figure 5.13 Canada Onshore Oil & Gas Pipelines Total Lenght Forecast by Submarket 2019-2029 (Thousand KM, AGR %)
Figure 5.14 Canada Onshore Oil & Gas Pipelines Total Length Share Forecast by Submarket 2019, 2024 and 2029 (% Share)
Figure 5.15 Mexico Onshore Oil & Gas Pipelines CAPEX Forecast by Submarket 2019-2029 ($bn, AGR %)
Figure 5.16 Mexico Onshore Oil & Gas Pipelines CAPEX Share Forecast by Submarket 2019, 2024 and 2029 (% Share)
Figure 5.17 Mexico Onshore Oil & Gas Pipelines Total Length Forecast by Submarket 2019-2029 (Thousand KM, AGR %)
Figure 5.18 Mexico Onshore Oil & Gas Pipelines Total Length Share Forecast by Submarket 2019, 2024 and 2029 (% Share)
Figure 6.1 Europe Onshore Oil & Gas Pipelines CAPEX Forecast By Country 2019-2029 ($bn, AGR %)
Figure 6.2 Europe Onshore Oil & Gas Pipelines Total Length Forecast By Country 2019-2029 (Thousand KM, AGR %)
Figure 6.3 Europe Onshore Oil & Gas Pipelines CAPEX Forecast by Submarket 2019-2029 ($bn, AGR %)
Figure 6.4 Europe Onshore Oil & Gas Pipelines CAPEX Share Forecast by Submarket 2019, 2024 and 2029 (% Share)
Figure 6.5 Europe Onshore Oil & Gas Pipelines Total Length Forecast by Submarket 2019-2029 (Thousand KM, AGR %)
Figure 6.6 Europe Onshore Oil & Gas Pipelines Total Length Forecast by Submarket 2019, 2024 and 2029 (% Share)
Figure 6.7 Russia Onshore Oil & Gas Pipelines CAPEX Forecast by Submarket 2019-2029 ($bn, AGR %)
Figure 6.8 Russia Onshore Oil & Gas Pipelines CAPEX Share Forecast by Submarket 2019, 2024 and 2029 (% Share)
Figure 6.9 Russia Onshore Oil & Gas Pipelines Total Length Forecast by Submarket 2019-2029 (Thousand KM, AGR %)
Figure 6.10 Russia Onshore Oil & Gas Pipelines Total Length Forecast by Submarket 2019, 2024 and 2029 (% Share)
Figure 6.11 Rest of Europe Onshore Oil & Gas Pipelines CAPEX Forecast by Submarket 2019-2029 ($bn, AGR %)
Figure 6.12 Rest of Europe Onshore Oil & Gas Pipelines CAPEX Share Forecast by Submarket 2019, 2024 and 2029 (% Share)
Figure 6.13 Rest of Europe Onshore Oil & Gas Pipelines Total Length Forecast by Submarket 2019-2029 (Thousand KM, AGR %)
Figure 6.14 Rest of Europe Onshore Oil & Gas Pipelines Total Length Share Forecast by Submarket 2019, 2024 and 2029 (% Share)
Figure 7.1 Asia Pacific Onshore Oil & Gas Pipelines CAPEX Forecast By Country 2019-2029 ($bn, AGR %)
Figure 7.2 Asia Pacific Onshore Oil & Gas Pipelines Total Length Forecast By Country 2019-2029 (Thousand KM, AGR %)
Figure 7.3 Asia Pacific Onshore Oil & Gas Pipelines CAPEX Forecast by Submarket 2019-2029 ($bn, AGR %)
Figure 7.4 Asia Pacific Onshore Oil & Gas Pipelines CAPEX Forecast by Submarket 2019, 2024 and 2029 (% Share)
Figure 7.5 Asia Pacific Onshore Oil & Gas Pipelines Total Length Forecast by Submarket 2019-2029 (Thousand KM, AGR %)
Figure 7.6 Asia Pacific Onshore Oil & Gas Pipelines Total Length Share Forecast by Submarket 2019, 2024 and 2029 (% Share)
Figure 7.7 China Onshore Oil & Gas Pipelines CAPEX Forecast by Submarket 2019-2029 ($bn, AGR %)
Figure 7.8 China Onshore Oil & Gas Pipelines CAPEX Share Forecast by Submarket 2019, 2024 and 2029 (% Share)
Figure 7.9 China Onshore Oil & Gas Pipelines Total Length Forecast by Submarket 2019-2029 (Thousand KM, AGR %)
Figure 7.10 China Onshore Oil & Gas Pipelines Total Length Forecast by Submarket 2019, 2024 and 2029 (% Share)
Figure 7.11 India Onshore Oil & Gas Pipelines CAPEX Forecast by Submarket 2019-2029 ($bn, AGR %)
Figure 7.12 India Onshore Oil & Gas Pipelines CAPEX Share Forecast by Submarket 2019, 2024 and 2029 (% Share)
Figure 7.13 India Onshore Oil & Gas Pipelines Total Length Forecast by Submarket 2019-2029 (Thousand KM, AGR %)
Figure 7.14 India Onshore Oil & Gas Pipelines Total Length Share Forecast by Submarket 2019, 2024 and 2029 (% Share)
Figure 7.15 Rest of Asia Pacific Onshore Oil & Gas Pipelines CAPEX Forecast by Submarket 2019-2029 ($bn, AGR %)
Figure 7.16 Rest of Asia Pacific Onshore Oil & Gas Pipelines CAPEX Share Forecast by Submarket 2019, 2024 and 2029 (% Share)
Figure 7.17 Rest of Asia Pacific Onshore Oil & Gas Pipelines Total Length Forecast by Submarket 2019-2029 (Thousand KM, AGR %)
Figure 7.18 Rest of Asia Pacific Onshore Oil & Gas Pipelines Total Length Forecast by Submarket 2019, 2024 and 2029 (% Share)
Figure 8.1 Middle East and Africa Onshore Oil & Gas Pipelines CAPEX Forecast by Country 2019-2029 ($bn, AGR %)
Figure 8.2 Middle East and Africa Onshore Oil & Gas Pipelines Total Length Forecast by Country 2019-2029 (Thousand KM, AGR %)
Figure 8.3 Middle East and Africa Onshore Oil & Gas Pipelines CAPEX Forecast by Submarket 2019-2029 ($bn, AGR %)
Figure 8.4 Middle East and Africa Onshore Oil & Gas Pipelines CAPEX Share Forecast by Submarket 2019, 2024 and 2029 (% Share)
Figure 8.5 Middle East and Africa Onshore Oil & Gas Pipelines Total Length Forecast by Submarket 2019-2029 (Thousand KM, AGR %)
Figure 8.6 Middle East and Africa Onshore Oil & Gas Pipelines Total Length Forecast by Submarket 2019, 2024 and 2029 (% Share)
Figure 8.7 Iran Onshore Oil & Gas Pipelines CAPEX Forecast by Submarket 2019-2029 ($bn, AGR %)
Figure 8.8 Iran Onshore Oil & Gas Pipelines CAPEX Share Forecast by Submarket 2019, 2024 and 2029 (% Share)
Figure 8.9 Iran Onshore Oil & Gas Pipelines Total Length Forecast by Submarket 2019-2029 (Thousand KM, AGR %)
Figure 8.10 Iran Onshore Oil & Gas Pipelines Total Length Share Forecast by Submarket 2019, 2024 and 2029 (% Share)
Figure 8.11 Egypt Onshore Oil & Gas Pipelines CAPEX Forecast by Submarket 2019-2029 ($bn, AGR %)
Figure 8.12 Egypt Onshore Oil & Gas Pipelines CAPEX Share Forecast by Submarket 2019, 2024 and 2029 (% Share)
Figure 8.13 Egypt Onshore Oil & Gas Pipelines Total Length Forecast by Submarket 2019-2029 (Thousand KM, AGR %)
Figure 8.14 Egypt Onshore Oil & Gas Pipelines Total Length Forecast by Submarket 2019, 2024 and 2029 (% Share)
Figure 8.15 Rest of MEA Onshore Oil & Gas Pipelines CAPEX Forecast by Submarket 2019-2029 ($bn, AGR %)
Figure 8.16 Rest of MEA Onshore Oil & Gas Pipelines CAPEX Share Forecast by Submarket 2019, 2024 and 2029 (% Share)
Figure 8.17 Rest of MEA Onshore Oil & Gas Pipelines Total Length Forecast by Submarket 2019-2029 (Thousand KM, AGR %)
Figure 8.18 Rest of MEA Onshore Oil & Gas Pipelines Total Length Share Forecast by Submarket 2019, 2024 and 2029 (% Share)
Figure 9.1 Latin America Onshore Oil & Gas Pipelines CAPEX Forecast by Country 2019-2029 ($bn, AGR %)
Figure 9.2 Latin America Onshore Oil & Gas Pipelines Total Length Forecast by Country 2019-2029 (Thousand KM, AGR %)
Figure 9.3 Latin America Onshore Oil & Gas Pipelines CAPEX Forecast by Submarket 2019-2029 ($bn, AGR %)
Figure 9.4 Latin America Onshore Oil & Gas Pipelines CAPEX Share Forecast by Submarket 2019, 2024 and 2029 (% Share)
Figure 9.5 Latin America Onshore Oil & Gas Pipelines Total Length Forecast by Submarket 2019-2029 (Thousand KM, AGR %)
Figure 9.6 Latin America Onshore Oil & Gas Pipelines Total Length Forecast by Submarket 2019, 2024 and 2029 (% Share)
Figure 9.7 Brazil Onshore Oil & Gas Pipelines CAPEX Forecast by Submarket 2019-2029 ($bn, AGR %)
Figure 9.8 Brazil Onshore Oil & Gas Pipelines CAPEX Share Forecast by Submarket 2019, 2024 and 2029 (% Share)
Figure 9.9 Brazil Onshore Oil & Gas Pipelines Total Length Forecast by Submarket 2019-2029 (Thousand KM, AGR %)
Figure 9.10 Brazil Onshore Oil & Gas Pipelines Total Length Forecast by Submarket 2019, 2024 and 2029 (% Share)
Figure 9.11 Argentina Onshore Oil & Gas Pipelines CAPEX Forecast by Submarket 2019-2029 ($bn, AGR %)
Figure 9.12 Argentina Onshore Oil & Gas Pipelines CAPEX Share Forecast by Submarket 2019, 2024 and 2029 (% Share)
Figure 9.13 Argentina Onshore Oil & Gas Pipelines Total Length Forecast by Submarket 2019-2029 (Thousand KM, AGR %)
Figure 9.14 Argentina Onshore Oil & Gas Pipelines Total Length Forecast by Submarket 2019, 2024 and 2029 (% Share)
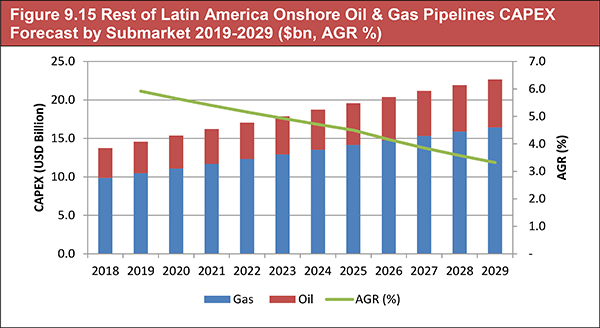
Figure 9.15 Rest of Latin America Onshore Oil & Gas Pipelines CAPEX Forecast by Submarket 2019-2029 ($bn, AGR %)
Figure 9.16 Rest of Latin America Onshore Oil & Gas Pipelines CAPEX Share Forecast by Submarket 2019, 2024 and 2029 (% Share)
Figure 9.17 Rest of Latin America Onshore Oil & Gas Pipelines Total Length Forecast by Submarket 2019-2029 (Thousand KM, AGR %)
Figure 9.18 Rest of Latin America Onshore Oil & Gas Pipelines Total Length Forecast by Submarket 2019, 2024 and 2029 (% Share)
List of Tables
Table 3.1 Global Onshore Oil & Gas Pipelines CAPEX Forecast 2019-2029 ($bn, AGR %, CAGR %, Cumulative)
Table 3.2 Global Onshore Oil & Gas Pipelines Added and Existing Length Forecast 2019-2029 (Thousand KM, AGR %, CAGR %, Cumulative)
Table 3.3 Regional Onshore Oil & Gas Pipelines CAPEX Forecast 2019-2029 ($bn, AGR %, CAGR %, Cumulative)
Table 3.4 Regional Onshore Oil & Gas Pipelines Added and Existing Length Forecast 2019-2029 (Thousand km, AGR %, CAGR %, Cumulative)
Table 3.5 Drivers and Restraints in the Onshore Oil & Gas Pipelines Market
Table 4.1 Global Oil Pipelines CAPEX Forecast 2019-2029 ($bn, AGR %, CAGR %, Cumulative)
Table 4.2 Regional Oil Pipelines CAPEX Forecast 2019-2029 ($bn, AGR %, CAGR %, Cumulative)
Table 4.3 Global Oil Pipelines Forecast By Added and Existing Length 2019-2029 (‘000 km, AGR %, CAGR %, Cumulative)
Table 4.4 Regional Oil Pipelines Forecast By Added and Existing Length 2019-2029 (‘000 km, AGR %, CAGR %, Cumulative)
Table 4.5 Global Gas Pipelines CAPEX Forecast 2019-2029 ($bn, AGR %, CAGR %, Cumulative)
Table 4.6 Regional Gas Pipelines CAPEX Forecast 2019-2029 ($bn, AGR %, CAGR %, Cumulative)
Table 4.7 Global Gas Pipelines Forecast By Added and Existing Length 2019-2029 (‘000 km, AGR %, Cumulative)
Table 4.8 Regional Gas Pipelines Forecast By Added and Existing Length 2019-2029 (‘000 km, AGR %, Cumulative)
Table 5.1 North America Onshore Oil & Gas Pipelines CAPEX Forecast By Country 2019-2029 ($bn, AGR %, CAGR %, Cumulative)
Table 5.2 North America Onshore Oil & Gas Pipelines Added and Existing Length Forecast By Country 2019-2029 (Thousand KM, AGR %, Cumulative)
Table 5.3 North America Onshore Oil & Gas Pipelines CAPEX Forecast 2019-2029 ($bn, AGR %, CAGR %, Cumulative)
Table 5.4 North America Onshore Oil & Gas Pipelines Added and Existing Length Forecast by Submarket 2019-2029 (Thousand KM, AGR %, CAGR %, Cumulative)
Table 5.5 United States Proposed Oil Pipelines (Name, Length km, Capacity Bpd, Origin, Destination, Developer, Scheduled Start Date, Cost US $m, Status)
Table 5.6 United States Proposed Gas Pipelines (Name, Length km, Capacity MMcf/d, Origin, Destination, Developer, Cost US $m)
Table 5.7 North American Cross Border Proposed Oil Pipelines (Name, Length km, Capacity Bpd, Origin, Destination, Developer, Scheduled Start Date, Cost US$m, Status)
Table 5.8 Canadian Proposed Oil Pipelines (Name, Length km, Capacity Bpd, Origin, Destination, Developer, Scheduled Start Date, Cost US$m, Status)
Table 5.9 Canadian Proposed Gas Pipelines (Name, Length km, Capacity Bcm/y, Origin, Destination, Developer, Scheduled Start Date, Cost $m, Status)
Table 5.10 Proposed North American Cross Border Gas Pipelines (Name, Length km, Capacity Bcm/y, Origin, Destination, Developer, Scheduled Start Date, Cost $m, Status)
Table 5.11 Central American Cross Border Proposed Gas Pipelines (Name, Length km, Capacity Bcm/y, Origin, Destination, Developer, Scheduled Start Date, Cost $m, Status)
Table 5.12 Mexico Cross Border and Domestic Proposed Gas Pipelines (Name, Length km, Capacity Bcm/y, Origin, Destination, Developer, Scheduled Start Date, Cost $m, Status)
Table 5.13 US Onshore Oil & Gas Pipelines CAPEX Forecast 2019-2029 ($bn, AGR %, CAGR %, Cumulative)
Table 5.14 US Onshore Oil & Gas Pipelines Added and Existing Length Forecast by Submarket 2019-2029 (Thousand KM, AGR %, CAGR %, Cumulative)
Table 5.15 Canada Onshore Oil & Gas Pipelines CAPEX Forecast 2019-2029 ($bn, AGR %, CAGR %, Cumulative)
Table 5.16 Canada Onshore Oil & Gas Pipelines Added and Existing Length Forecast by Submarket 2019-2029 (Thousand KM, AGR %, CAGR %, Cumulative)
Table 5.17 Mexico Onshore Oil & Gas Pipelines CAPEX Forecast 2019-2029 ($bn, AGR %, CAGR %, Cumulative)
Table 5.18 Mexico Onshore Oil & Gas Pipelines Added and Existing Length Forecast by Submarket 2019-2029 (Thousand KM, AGR %, CAGR %, Cumulative)
Table 6.1 Europe Onshore Oil & Gas Pipelines CAPEX Forecast By Country 2019-2029 ($bn, AGR %, CAGR %, Cumulative)
Table 6.2 Europe Onshore Oil & Gas Pipelines Added and Existing Lenght Forecast By Country 2019-2029 (Thousand KM, AGR %, CAGR %, Cumulative)
Table 6.3 Europe Onshore Oil & Gas Pipelines CAPEX Forecast by Submarket 2019-2029 ($bn, AGR %, Cumulative)
Table 6.4 Europe Onshore Oil & Gas Pipelines Added and Existing Length Forecast 2019-2029 (Thousand KM, AGR %, CAGR %, Cumulative)
Table 6.5 Europe Proposed Oil Pipelines (Name, Length km, Capacity Bpd, Origin, Destination, Developer, Scheduled Start Date, Cost $m, Status)
Table 6.6 Europe Proposed Gas Pipelines (Name, Length km, Capacity Bpd, Origin, Destination, Developer, Scheduled Start Date, Cost $m)
Table 6.7 Russia Onshore Oil & Gas Pipelines CAPEX Forecast by Submarket 2019-2029 ($bn, AGR %, CAGR %, Cumulative)
Table 6.8 Russia Onshore Oil & Gas Pipelines Added and Existing Length Forecast by Submarket 2019-2029 (Thousand KM, AGR %, CAGR %, Cumulative)
Table 6.9 Rest of Europe Onshore Oil & Gas Pipelines CAPEX Forecast by Submarket 2019-2029 ($bn, AGR %, CAGR %, Cumulative)
Table 6.10 Rest of Europe Onshore Oil & Gas Pipelines Added and Existing Length Forecast by Submarket 2019-2029 (Thousand KM, AGR %, CAGR %, Cumulative)
Table 7.1 Asia Pacific Onshore Oil & Gas Pipelines CAPEX Forecast By Country 2019-2029 ($bn, AGR %, CAGR %, Cumulative)
Table 7.2 Asia Pacific Onshore Oil & Gas Pipelines Added and Existing Length Forecast by Country 2019-2029 (Thousand KM, AGR %, CAGR %, Cumulative)
Table 7.3 Asia Pacific Onshore Oil & Gas Pipelines CAPEX Forecast by Submarket 2019-2029 ($bn, AGR %, CAGR %, Cumulative)
Table 7.4 Asia Pacific Onshore Oil & Gas Pipelines Added and Existing Length Forecast by Submarket 2019-2029 (Thousand KM, AGR %, CAGR %, Cumulative)
Table 7.5 Asia Pacific Proposed Gas Pipelines (Name, Length km, Capacity Bcm/y, Origin, Destination, Developer, Scheduled Start Date, Cost $m, Status)
Table 7.6 Asia Pacific Cross-border Proposed Gas Pipelines (Name, Length km, Capacity Bcm/y, Origin, Destination, Developer, Scheduled Start Date, Cost $m)
Table 7.7 China Onshore Oil & Gas Pipelines CAPEX Forecast by Submarket 2019-2029 ($bn, AGR %, CAGR %, Cumulative)
Table 7.8 China Onshore Oil & Gas Pipelines Added and Existing Length by Submarket 2019-2029 (Thousand KM, AGR %, CAGR %, Cumulative)
Table 7.9 India Onshore Oil & Gas Pipelines CAPEX Forecast by Submarket 2019-2029 ($bn, AGR %, CAGR %, Cumulative)
Table 7.10 India Onshore Oil & Gas Pipelines Added and Existing Length Forecast by Submarket 2019-2029 (Thousand KM, AGR %, CAGR %, Cumulative)
Table 7.11 Rest of Asia Pacific Onshore Oil & Gas Pipelines CAPEX Forecast by Submarket 2019-2029 ($bn, AGR %, CAGR %, Cumulative)
Table 7.12 Rest of Asia Pacific Onshore Oil & Gas Pipelines Added and Existing Length Forecast by Submarket 2019-2029 (Thousand KM, AGR %, CAGR %, Cumulative)
Table 8.1 The Middle East and Africa Onshore Oil & Gas Pipelines CAPEX Forecast by Country 2019-2029 ($bn, AGR %, CAGR %, Cumulative)
Table 8.2 Middle East and Africa Onshore Oil & Gas Pipelines Added and Existing Length Forecast by Country 2019-2029 (Thousand KM, AGR %, CAGR %, Cumulative)
Table 8.3 Middle East and Africa Onshore Oil & Gas Pipelines CAPEX Forecast by Submarket 2019-2029 ($bn, AGR %, CAGR %, Cumulative)
Table 8.4 Middle East and Africa Onshore Oil & Gas Pipelines Added and Existing Length Forecast by Submarket 2019-2029 (Thousand KM, AGR %, CAGR %, Cumulative)
Table 8.5 Middle Eastern Proposed Oil Pipelines (Name, Length km, Capacity Bpd, Origin, Destination, Developer, Scheduled Start Date, Cost $m)
Table 8.6 Middle Eastern Proposed Gas Pipelines (Name, Length km, Capacity Bcm/y, Origin, Destination, Developer, Scheduled Start Date, Cost $m)
Table 8.7 African Proposed Oil Pipelines (Name, Length km, Capacity Bpd, Origin, Destination, Developer, Scheduled Start Date, Cost $m)
Table 8.8 African Proposed Gas Pipelines (Name, Length km, Capacity Bcm/y, Origin, Destination, Developer, Scheduled Start Date, Cost $m)
Table 8.9 Iran Onshore Oil & Gas Pipelines CAPEX Forecast by Submarket 2019-2029 ($bn, AGR %, CAGR %, Cumulative)
Table 8.10 Iran Onshore Oil & Gas Pipelines Added and Existing Length Forecast by Submarket 2019-2029 (Thousand KM, AGR %, CAGR %, Cumulative)
Table 8.11 Egypt Onshore Oil & Gas Pipelines CAPEX Forecast by Submarket 2019-2029 ($bn, AGR %, CAGR %, Cumulative)
Table 8.12 Egypt Onshore Oil & Gas Pipelines Added and Existing Length Forecast by Submarket 2019-2029 (Thousand KM, AGR %, CAGR %, Cumulative)
Table 8.13 Rest of MEA Onshore Oil & Gas Pipelines CAPEX Forecast by Submarket 2019-2029 ($bn, AGR %, CAGR %, Cumulative)
Table 8.14 Rest of MEA Onshore Oil & Gas Pipelines Added and Existing Length Forecast by Submarket 2019-2029 (Thousand KM, AGR %, CAGR %, Cumulative)
Table 9.1 Latin America Onshore Oil & Gas Pipelines CAPEX Forecast by Country 2019-2029 ($bn, AGR %, CAGR %, Cumulative)
Table 9.2 Latin America Onshore Oil & Gas Pipelines Added and Existing Length Forecast by Forecast 2019-2029 (Thousand KM, AGR %, CAGR %, Cumulative)
Table 9.3 Latin America Onshore Oil & Gas Pipelines CAPEX Forecast 2019-2029 ($bn, AGR %, Cumulative)
Table 9.4 Latin America Onshore Oil & Gas Pipelines Added and Existing Length Forecast by Submarket 2019-2029 (Thousand KM, AGR %, CAGR %, Cumulative)
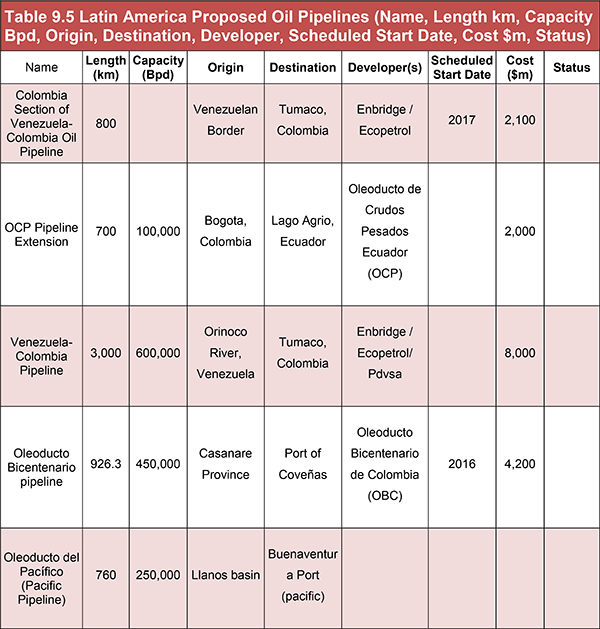
Table 9.5 Latin America Proposed Oil Pipelines (Name, Length km, Capacity Bpd, Origin, Destination, Developer, Scheduled Start Date, Cost $m, Status)
Table 9.6 Brazil Onshore Oil & Gas Pipelines CAPEX Forecast by Submarket 2019-2029 ($bn, AGR %, CAGR %, Cumulative)
Table 9.7 Brazil Onshore Oil & Gas Pipelines Added and Existing Length by Submarket 2019-2029 (Thousand KM, AGR %, CAGR %, Cumulative)
Table 9.8 Argentina Onshore Oil & Gas Pipelines CAPEX Forecast by Submarket 2019-2029 ($bn, AGR %, CAGR %, Cumulative)
Table 9.9 Argentina Onshore Oil & Gas Pipelines Added and Existing Length Forecast by Submarket 2019-2029 (Thousand KM, AGR %, CAGR %, Cumulative)
Table 9.10 Rest of Latin America Onshore Oil & Gas Pipelines CAPEX Forecast by Submarket 2019-2029 ($bn, AGR %, CAGR %, Cumulative)
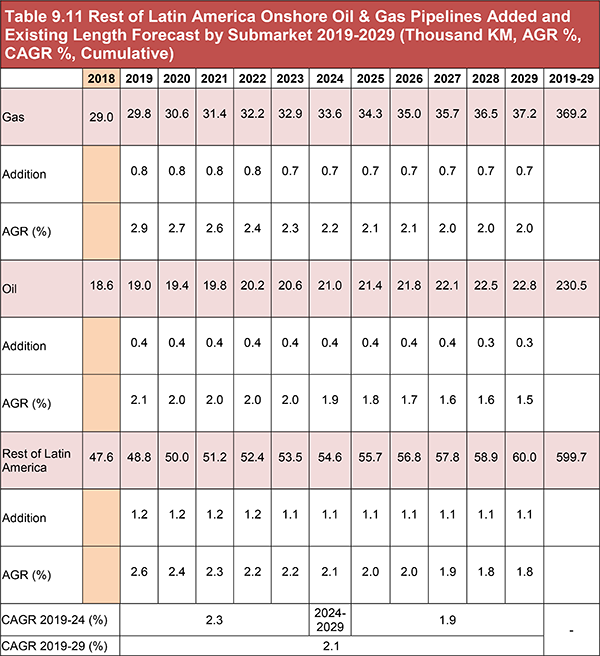
Table 9.11 Rest of Latin America Onshore Oil & Gas Pipelines Added and Existing Length Forecast By Submarket 2019-2029 (Thousand KM, AGR %, CAGR %, Cumulative)
Table 11.1 Dominion Energy 2019
(CEO, Strongest Business Region, HQ, Founded, No. of Employees, IR Contact, Ticker, Website)
Table 11.2 Enbridge Inc. 2019 (CEO, Strongest Business Region, HQ, Founded, No. of Employees, IR Contact, Ticker, Website)
Table 11.3 Energy Transfer LP 2019 (CEO, Strongest Business Region, HQ, Founded, No. of Employees, IR Contact, Ticker, Website)
Table 11.4 Gas India Limited 2019 (CEO, Strongest Business Region, HQ, Founded, No. of Employees, IR Contact, Ticker, Website)
Table 11.5 Gazprom 2019 (CEO, Strongest Business Region, HQ, Founded, No. of Employees, IR Contact, Ticker, Website)
Table 11.6 Kinder Morgan 2019 (CEO, Strongest Business Region, HQ, Founded, No. of Employees, IR Contact, Ticker, Website)
Table 11.7 Plains All American 2019 (CEO, Strongest Business Region, HQ, Founded, No. of Employees, IR Contact, Ticker, Website)
Table 11.8 TransCanada Corporation 2019 (CEO, Strongest Business Region, HQ, Founded, No. of Employees, IR Contact, Ticker, Website)
Table 11.9 The Comisión Federal de Electricidad 2019 (CEO, Strongest Business Region, HQ, Founded, No. of Employees, IR Contact, Ticker, Website)
Table 11.10 Williams Partners L.P. 2019 (CEO, Strongest Business Region, HQ, Founded, No. of Employees, IR Contact, Ticker, Website)
Table 12.1 Global Onshore Oil & Gas Pipeline CAPEX and Added and Existing Length Forecast 2019-2029 (CAPEX $bn, Length ‘000 km, AGR %, Cumulative)
Table 1 North American Existing Oil Pipeline Network (Name, Length km, Diameter inch, Capacity Bpd, Origin, Destination, Developer/ Operator, Commissioned, Pumping Stations, Cost $m, Note)
Table 2 North American Existing Gas Pipeline Network (Name, Length km, Diameter inch, Capacity Bcm/y, Origin, Destination, Developer/ Operator, Commissioned, Pumping Stations/Compressors, Cost $m, Note)
Table 3 Latin American Existing Oil Pipeline Network (Name, Length km, Diameter inch, Capacity Bpd, Origin, Destination, Developer/ Operator, Commissioned, Pumping Stations, Cost $m, Note)
Table 4 Latin American Existing Gas Pipeline Network (Name, Length km, Diameter inch, Capacity Bpd, Origin, Destination, Developer/ Operator, Commissioned, Compressors, Cost $m, Note)
Table 5 Europe Existing Oil Pipeline Network (Name, Length km, Diameter inch, Capacity Bpd, Origin, Destination, Partners, Commissioned, Pumping Stations, Cost $m, Note)
Table 6 Europe Existing Gas Pipeline Network (Name, Length km, Diameter inch, Capacity Bcm/y, Origin, Destination, Partners, Commissioned, Pumping Stations, Cost $m, Note)
Table 7 Asia Pacific Existing Oil Pipeline Network (Name, Length km, Diameter cm, Capacity Mto/y, Origin, Destination, Partners, Commissioned, Pumping Stations, Cost $m, Note)
Table 8 India Existing Oil Product Pipeline Network (Name, Length km, Diameter inch, Capacity Bpd, Origin, Destination, Developer/ Operator, Commissioned, Pumping Stations/Compressors, Cost $m, Note)
Table 9 India Existing LPG Pipeline Network (Name, Length km, Diameter inch, Capacity Bpd, Origin, Destination, Developer/ Operator, Commissioned, Pumping Stations/Compressors, Cost $m, Note)
Table 10 Asia Pacific Existing Gas Pipeline Network (Name, Length km, Diameter inch, Capacity Bcm/y, Origin, Destination, Developer/ Operator, Commissioned, Pumping Stations/Compressors, Cost $m, Note)
Table 11 China Existing Gas Pipeline Network (Name, Length km, Diameter inch, Capacity Bcm/y, Origin, Destination, Developer/ Operator, Commissioned, Pumping Stations/Compressors, Cost $m, Note)
Table 12 Kazakhstan Existing Gas Pipeline Network (Name, Length km, Diameter inch, Capacity Bcm/y, Origin, Destination, Developer/ Operator, Commissioned, Pumping Stations/Compressors, Cost $m, Note)
Table 13 Australian Existing Gas Pipeline Network (Name, Length km, Diameter inch, Capacity TJ/D, Origin, Destination, Developer/ Operator, Commissioned, Pumping Stations/Compressors, Cost $m, Note)
Table 14 Malaysia Existing Gas Pipeline Network (Name, Length km, Diameter inch, Capacity Bcm/y, Origin, Destination, Developer/ Operator, Commissioned, Pumping Stations/Compressors, Cost $m, Note)
Table 15 India Existing Gas Pipeline Network (Name, Length km, Diameter inch, Capacity Bcm/y, Origin, Destination, Developer/ Operator, Commissioned, Pumping Stations/Compressors, Cost $m, Note)
Table 16 Iran Existing Crude Oil Pipeline Network (Name, Length (km), Diameter (inch), Capacity (Bpd), Origin, Destination, Developer/ Operator, Commissioned, Pumping Stations/Compressors, Cost ($m), Note)
Table 17 Iran Existing Gas Pipeline Network (Name, Length (km), Diameter (inch), Capacity (Bcm/y), Origin, Destination, Developer/ Operator, Commissioned, Pumping Stations/Compressors, Cost ($m), Note)
Table 18 Iraq Existing Oil & Gas Pipeline Network (Name, Length (km), Diameter (inch), Capacity (Bpd/Bcm/y), Origin, Destination, Developer/ Operator, Commissioned, Pumping Stations/Compressors, Cost ($m), Note)
Table 19 Rest of Middle East Existing Oil Pipeline Network (Name, Length (km), Diameter (inch), Capacity (Bpd/Bcm/y), Origin, Destination, Developer/ Operator, Commissioned, Pumping Stations/Compressors, Cost ($m), Note)
Table 20 Middle East Major Cross-Border Oil & Gas Pipeline Network (Name, Length km, Diameter inch, Capacity Bpd/Bcm/y, Origin, Destination, Developer/ Operator, Commissioned, Pumping Stations/Compressors, Cost $m, Note)
Table 21 Africa Oil & Gas Pipeline Network (Name, Length km, Diameter inch, Capacity Bpd, Origin, Destination, Developer/ Operator, Commissioned, Pumping Stations/Compressors, Cost $m, Note)
American Midstream
Anadarko Petroleum
ANGDA
ANR
Apache
Apex Pipeline Services
Atlanta Gas Light
Atlantic Coast
Axpo
Bahrain Petroleum Company Bapco
Bangladesh Petroleum Corporation
Baseli Ba Liseli Resources (BBLR)
BG Group
BG Overseas
Black Hills Energy
Black Rhino
Black Rock
Blueknight Energy Partners
BOTAS
BP
Brion Energy Corp (Phoenix Energy Holdings Limited)
Bulgartransgaz
Canyon Midstream
Central New York Oil & Gas
Cheniere Energy
Chevron
China National Petroleum (CNPC)
Clarksville Gas & Water Department
CNPC
Columbia Gulf Transmission
Columbia Pipeline Group, Inc.
Comision Federal de Electricidad
ConocoPhillips Canada
CPC Company
CPG
Delaware Basin Express
Delek Logistics Partners LP
Dominion Energy
Duke Energy
E. ON
Eastern Shore Natural Gas
Ecopetrol
Elba Express Pipeline
Empire Pipeline
Enbridge Energy
Energy Transfer Partners
Eni
Enstar
Enterprise Products Partners
EPIC
EQT Midstream Partners
Equitrans
ExxonMobil
First Reserve
Florida Gas Trans Co
Fluxys
Gas India Limited (GAIL)
Gastec
Gazprom
Gaz-System
GDF Suez
Golden Pass Pipeline
Gujarat State Petronet Ltd (GSPL)
Gulf South Pipeline Company
Howard Energy
Imperial
Indian Oil Corporation
Iroquois Pipeline Co
Japan Petroleum Exploration Company
Japan's Toyota Tshusho
JSC National Company
Jupiter MLP
Kaiser-Frontier Midstream
Kazakhstan Pipeline Ventures
Kaztec Engineering Limited
Kenya Pipeline Company (KPC)
Kinder Morgan
Kuwait Gulf Oil Co. (KGOC)
Lukoil
Magellan Midstream Partners
Magnum Gas Storage LLC
Midcoast Energy Partners
Millennium Pipeline
NAmerico
Nat Gas P L Co of America
National Fuel Gas Supply Corporation
National Iranian Gas Company (NIGC)
National Oil Company
Navitas Midstream Partners
NextEra Energy, Inc
NEXUS Gas Transmission
Nigerian National Petroleum Corporation (NNPC)
Nippon Steel & Sumikin Engineering Company
Northern Natural Gas Co
Northwest Natural Gas Company
Northwest Pipeline Co
Nova Gas Transmission Ltd (NGTL)
Nustar Energy
Oleoducto Bicentenario de Colombia (OBC)
Oleoducto de Crudos Pesados Ecuador (OCP)
Oman Gas Company (OGC)
OMV
ONEOK
Országos Villamostávvezeték (OVIT)
Pacific Natural Gas
Panhandle Eastern Pipeline Co
Paso Norte Pipeline Group
Pdvsa
Pembina
Pemex
PennEast Pipeline Co
Perryville Gas Storage LLC
PetroChina
Petroleum Development Oman (PDO)
Philippine National Oil Co.
Phillips 66
Plains All American Pipelines
Portland Natural Gas Transmission System
Rangeland Energy
Rimrock Midstream and NGL Energy Partners
Rosneft
Ryckman Creek Resources
SacOil Holdings
Sarmatia
Saudi Aramco
Sempra
SGC Midstream
Shell
Socar
Sonatrach
South Oil Company (SOC)
Southern Star Central Corp.
Spectra Energy Corp
Statoil
Sunoco Logistics Partners
Tallgrass Energy
Targa Resources
Tellurian
Tennessee Gas
TETCO
Texas Gas Transmission
The Aboriginal Pipeline Group
Tokyo Gas Company
Total
TPAO
TransCanada
Transco
Transgaz
Transneft
Transpetrol
Transportadora de Gas del Sur (TGS)
Transwestern Pipeline Co
Trunkline Gas Co
UGI Energy Services
Vermont Gas
WBI Energy
Western Refining Inc
Williams Partners L.P.
List of Other Organisations Mentioned in this Report
Canadian Government
Energy Community Secretariat
Environmental Investigation Agency (EIA)
International Monetary Fund (IMF)
The Canadian Association of Petroleum Producers (CAPP)
The Federal Energy Regulatory Commission (FERC)
The Mexican Government
The National Liberation Army (ELN)
The Revolutionary Armed Forces of Colombia (FARC)
World Bank
Download sample pages
Complete the form below to download your free sample pages for Onshore Oil & Gas Pipelines Market Report 2019-2029
Related reports
-

Global Land Drill Rigs Market Analysis to 2027
Visiongain has calculated that the global Land Drill Rigs market will see a capital expenditure (CAPEX) of $2,823.7 mn in...Full DetailsPublished: 28 November 2017 -

LPG Vaporizer Market Report 2019-2029
Visiongain has calculated that the LPG Vaporizing market will see a capital expenditure (CAPEX) of $1.9 bn in 2019. Read...
Full DetailsPublished: 09 May 2019 -

Pipeline Leak Detection Market of the Oil and Gas Industry 2018-2028
The growing environmental concerns has led Visiongain to publish this timely report. The pipeline leak detection market is expected to...
Full DetailsPublished: 01 May 2018 -

Top 100 Border Security Companies to Watch in 2019
Do you need analysis of the leading 100 border security companies?...Full DetailsPublished: 26 November 2018 -
Small Scale Liquefied Natural Gas (LNG) Market Forecast 2019-2029
Visiongain has calculated that the global Small Scale Liquefied Natural Gas (LNG) Market will see a capital expenditure (CAPEX) of...
Full DetailsPublished: 18 June 2019 -

Fibre Optic Market Outlook to 2027
Fibre optics is the technology used to transmit information through very fine glass or plastic optical fibres from one source...
Full DetailsPublished: 04 December 2017 -

Marine Seismic Equipment & Acquisition Market Forecast 2018-2028
This latest report by business intelligence provider Visiongain assesses that marine seismic equipment and acquisition market will reach $5.01bn in...
Full DetailsPublished: 26 June 2018 -

Floating Liquefied Natural Gas (FLNG) Market Report 2018-2028
This latest report by business intelligence provider visiongain assesses that Floating Liquefied Natural Gas spending will reach $9.6bn in 2018.
...Full DetailsPublished: 28 June 2018 -

Pipeline Leak Detection Market of the Oil and Gas Industry 2019-2029
Pipeline Leak Detection market of the oil and gas industry market worth $2.8 billion in 2019. ...Full DetailsPublished: 06 August 2019 -
LNG Yearbook 2018: The Ultimate Guide to Liquefied Natural Gas Infrastructure 2018-2028
The definitive LNG Yearbook 2018 is the ultimate reference source for the liquefied natural gas industry. The yearbook indicates that...
Full DetailsPublished: 14 June 2018
Download sample pages
Complete the form below to download your free sample pages for Onshore Oil & Gas Pipelines Market Report 2019-2029
Do you have any custom requirements we can help you with?
Any specific country, geo region, market segment or specific company information?
Email us today, we can discuss your needs and see how we can help: jamie.roberts@visiongain.com
Would you like a free report overview of the report of your choice?
If so, please drop an email to Jamie Roberts stating your chosen report title to jamie.roberts@visiongain.com
Visiongain energy reports are compiled using a broad and rich mixture of both primary and secondary information to produce an overall industry outlook. In order to provide our clients with the best product possible product, we do not rely on any one single source of information. Visiongain analysts reach out to market-leading vendors and industry experts where possible but also review a wealth of financial data and product information from a vast range of sources. To find out more about our reports methodology, please email jamie.roberts@visiongain.com
Would you like to get the latest Visiongain energy reports catalogue?
What are the dynamic growth sectors? where are the regional business opportunities?
Which technologies will prevail and who are the leading companies succeeding in these sectors and why?
If you want definitive answers to business critical questions, discover Visiongain’s full range of business intelligence reports.
If so, please email Jamie Roberts on jamie.roberts@visiongain.com or call her today on +44 207 336 6100
“The Visiongain report was extremely insightful and helped us construct our basic go-to market strategy for our solution.”
H.
“F.B has used Visiongain to prepare two separate market studies on the ceramic proppants market over the last 12 months. These reports have been professionally researched and written and have assisted FBX greatly in developing its business strategy and investment plans.”
F.B
“We just received your very interesting report on the Energy Storage Technologies (EST) Market and this is a very impressive and useful document on that subject.”
I.E.N
“Visiongain does an outstanding job on putting the reports together and provides valuable insight at the right informative level for our needs. The EOR Visiongain report provided confirmation and market outlook data for EOR in MENA with the leading countries being Oman, Kuwait and eventually Saudi Arabia.”
E.S
“Visiongain produced a comprehensive, well-structured GTL Market report striking a good balance between scope and detail, global and local perspective, large and small industry segments. It is an informative forecast, useful for practitioners as a trusted and upto-date reference.”
Y.N Ltd
Association of Dutch Suppliers in the Oil & Gas Industry
Society of Naval Architects & Marine Engineers
Association of Diving Contractors
Association of Diving Contractors International
Associazione Imprese Subacquee Italiane
Australian Petroleum Production & Exploration Association
Brazilian Association of Offshore Support Companies
Brazilian Petroleum Institute
Canadian Energy Pipeline
Diving Medical Advisory Committee
European Diving Technology Committee
French Oil and Gas Industry Council
IMarEST – Institute of Marine Engineering, Science & Technology
International Association of Drilling Contractors
International Association of Geophysical Contractors
International Association of Oil & Gas Producers
International Chamber of Shipping
International Shipping Federation
International Marine Contractors Association
International Tanker Owners Pollution Federation
Leading Oil & Gas Industry Competitiveness
Maritime Energy Association
National Ocean Industries Association
Netherlands Oil and Gas Exploration and Production Association
NOF Energy
Norsk olje og gass Norwegian Oil and Gas Association
Offshore Contractors’ Association
Offshore Mechanical Handling Equipment Committee
Oil & Gas UK
Oil Companies International Marine Forum
Ontario Petroleum Institute
Organisation of the Petroleum Exporting Countries
Regional Association of Oil and Natural Gas Companies in Latin America and the Caribbean
Society for Underwater Technology
Society of Maritime Industries
Society of Petroleum Engineers
Society of Petroleum Enginners – Calgary
Step Change in Safety
Subsea UK
The East of England Energy Group
UK Petroleum Industry Association
All the events postponed due to COVID-19.
Latest Energy news
Visiongain Publishes Carbon Capture Utilisation and Storage (CCUS) Market Report 2024-2034
The global carbon capture utilisation and storage (CCUS) market was valued at US$3.75 billion in 2023 and is projected to grow at a CAGR of 20.6% during the forecast period 2024-2034.
19 April 2024
Visiongain Publishes Liquid Biofuels Market Report 2024-2034
The global Liquid Biofuels market was valued at US$90.7 billion in 2023 and is projected to grow at a CAGR of 6.7% during the forecast period 2024-2034.
03 April 2024
Visiongain Publishes Hydrogen Generation Market Report 2024-2034
The global Hydrogen Generation market was valued at US$162.3 billion in 2023 and is projected to grow at a CAGR of 3.7% during the forecast period 2024-2034.
28 March 2024
Visiongain Publishes Biofuel Industry Market Report 2024-2034
The global Biofuel Industry market was valued at US$123.2 billion in 2023 and is projected to grow at a CAGR of 7.6% during the forecast period 2024-2034.
27 March 2024
