Industries > Energy > Chemical Enhanced Oil Recovery (EOR) Market Report 2020-2030
 Market Report 2020-2030")
Chemical Enhanced Oil Recovery (EOR) Market Report 2020-2030
Forecasts by Type (Polymer, Surfactant Polymer, ASP, Other Chemicals), by Application (Onshore, Offshore). PLUS Profiles of Leading Chemical Enhanced Oil Recovery Companies and Regional and Leading National Market Analysis. PLUS COVID-19 Recovery Scenarios
Chemical Enhanced Oil Recovery Market–our new study reveals trends, R&D progress, and predicted revenues
The increasing consumption of crude oil in energy generation, transportation, petroleum products etc. coupled with growing need for energy security within a country expected to drive implementation of CEOR technologies
If you read only 1 Chemical EOR report this year – this is the report you need to read.
Key questions answered in this exclusive report are:
• What are the implication to oil prices of CEOR projects taking place now and over the next 10 years?
• How viable is extracted oil through these processes in the global trade due to prices?
• Is there a greater need for product commercialisation to further scale the market?
• Where is the Chemical Enhanced Oil Recovery market heading? And how can you ensure you are at the forefront of the market?
You need to discover how this will impact the market today, and over the next 10 years:
• Our 439-page report provides 319 tables and 211 charts/graphs exclusively to you.
• The report highlights key lucrative areas in the industry so you can target them – NOW.
• Contains in-depth analyse of global, regional and national sales and growth
• Highlights for you the key successful trends, changes and revenue projections made by your competitors
This report tells you TODAY how the Chemical Enhanced Oil Recovery market will develop in the next 10 years, and in-line with the variations in COVID-19 economic recession and bounce. This market is more critical now than at any point over the last 10 years.
Delivers exclusive COVID-19 variations economic data specific to your market.
To access the data contained in this document please email contactus@visiongain.com
Forecasts to 2030 and other analyses reveal the commercial prospects
• In addition to revenue forecasting to 2030, our new study provides you with recent results, growth rates, and market shares.
• You find original analyses, with business outlooks and developments.
• Discover qualitative analyses (including market dynamics, drivers, opportunities, restraints and challenges), cost structure, impact of oil prices on CEOR, project profiles and recent developments.
This report includes data analysis and invaluable insight into how COVID-19 will affect your industry. Four COVID-19 recovery patterns and their impact, namely, V, L, W and U are discussed in this report.
Discover sales predictions for the world, country market and submarkets
Chemical Enhanced Oil Recovery: By Type
• Polymer
• Surfactant Polymer
• ASP
• Other Chemicals
Chemical Enhanced Oil Recovery: By Application
• Onshore
• Offshore

In addition to the revenue predictions for the overall world market and segments, you will also find revenue forecasts for 19 leading national markets:
• U.S.
• Canada
• Mexico
• Colombia
• Venezuela
• Argentina
• Rest of LATAM
• North Sea
• UAE
• Oman
• Rest of Middle East and Africa
• China
• India
• Indonesia
• Thailand
• Malaysia
• Russia
• Angola
• Rest of the World
Need industry data? Please contact us today.
The report also includes profiles and for some of the leading companies in the Chemical Enhanced Oil Recovery Market, with a focus on this segment of these companies’ operations.
Leading companies and the potential for market growth
Overall world revenue for Chemical Enhanced Oil Recovery Market will surpass $xx billion in 2020, our work calculates. We forecast strong revenue growth through to 2030, especially in countries with experience in handling EOR projects. Some of the leading companies in the market are PetroChina Company Limited (CNPC), International Petroleum Corporation (IPC), and China National Offshore Oil Corporation (CNOOC) among others. Our work identifies which organizations hold the greatest potential. Discover their capabilities, progress, and commercial prospects, helping you stay ahead.
How the Chemical Enhanced Oil Recovery Market report helps you
In summary, our 430+ page report provides you with the following knowledge:
• Revenue forecasts to 2030 for Chemical Enhanced Oil Recovery Market, with forecasts for Type of Chemical and Application forecasted at a global and regional level– discover the industry’s prospects, finding the most lucrative places for investments and revenues
• Revenue forecasts to 2030 for 19 key national markets – See forecasts for the Chemical Enhanced Oil Recovery market in the US, Canada, Mexico, Argentina, China, India, Indonesia, the North Sea and Russia among other prominent economies.
• Prospects for established firms and those seeking to enter the market– including company profiles for 15 of the major companies involved in the Chemical Enhanced Oil Recovery Market. Some of the company’s profiled in this report include PetroChina Company Limited (CNPC), International Petroleum Corporation (IPC), China National Offshore Oil Corporation (CNOOC), Cenovus Energy Inc., Murphy Oil Corporation, Petroleum Development Oman, Sinopec Group (China Petrochemical Corporation), Canadian Natural Resources (CNRL), Zargon Oil & Gas Ltd., BP p.l.c, Oil & Gas Natural Gas Corporation Ltd. (ONGC), Equinor ASA, OMV AG, Rosneft Oil Company, and Total SA.
Find quantitative and qualitative analyses with independent predictions. Receive information that only our report contains, staying informed with this invaluable business intelligence.
Information found nowhere else
With our newly report title, you are less likely to fall behind in knowledge or miss out on opportunities. See how our work could benefit your research, analyses, and decisions. Visiongain’s study is for everybody needing commercial analyses for the Chemical Enhanced Oil Recovery Market and leading companies. You will find data, trends, predictions, expert opinions, oil & gas outlook for the future, cost structure, and impact of oil prices in the report.
To access the data contained in this document please email contactus@visiongain.com
Buy our report today Chemical Enhanced Oil Recovery (EOR) Market Report 2020-2030: Forecasts by Type (Polymer, Surfactant Polymer, ASP, Other Chemicals), by Application (Onshore, Offshore). PLUS Profiles of Leading Chemical Enhanced Oil Recovery Companies and Regional and Leading National Market Analysis. PLUS COVID-19 Recovery Scenarios. Avoid missing out by staying informed – order our report now.
Visiongain is a trading partner with the US Federal Government
CCR Ref number: KD4R6
Do you have any custom requirements we can help you with? Any need for a specific country, geo region, market segment or specific company information? Contact us today, we can discuss your needs and see how we can help: sara.peerun@visiongain.com
1.1 Introduction to Chemical Enhanced Oil Recovery (EOR) Market
1.2 Oil Recovery Market Structure
1.2.1 Primary Recovery
1.2.2 Secondary Recovery
1.2.3 Tertiary Recovery
1.2.4 Introduction to Enhanced Oil Recovery Market
1.3 Global Chemical Enhanced Oil Recovery (EOR) Market Segmentation
1.4 Chemical Enhanced Oil Recovery (EOR) Market Definition
1.4.1 Chemical Enhanced Oil Recovery (EOR)
1.4.1.1 Polymer Flooding
1.4.1.2 Surfactant Flooding
1.4.1.3 Alkaline Flooding
1.4.1.4 Surfactant Polymer (SP) Flooding
1.4.1.5 Alkaline Surfactant Polymer (ASP) Flooding
1.4.2 Major Chemicals Used in EOR Projects
1.4.3 Major Factors Influencing the CEOR Market
1.5 Why You Should Read This Report
1.6 What This Report Delivers
1.7 Key Questions Answered By This Analytical Report Include:
1.8 Who is This Report For?
1.9 Methodology
1.9.1 COVID-19 Impact: Recovery Scenarios
1.9.2 Market Evaluation & Forecasting Methodology
1.9.3 Market Size Estimation
1.5 Frequently Asked Questions (FAQs)
1.10 Associated Visiongain Reports
1.11 About Visiongain
2 Executive Summary
3 Market Overview
3.4 Drivers
3.4.1 Increasing crude oil consumption
3.4.2 Offshore Adoption of CEOR in early oilfield development
3.4.3 Continuously improving oil recovery rates through CEOR
3.5 Restraints
3.5.1 Declining oil prices
3.5.2 Environmental Concerns
3.5.3 Investments in Renewable Energy can prove more sustainable
3.6 Opportunities
3.6.1 Investment in R&D activities for new & natural chemistries
3.6.2 High cost associated with new explorations
3.6.3 Maturing oilfields across the world
1.6 Challenges
3.6.4 Product commercialization
3.6.5 Lack of government policies
3.6.6 High cost & lead time of CEOR projects
3.7 SWOT Analysis
3.7.1 Strengths
3.7.1.1 Increasing R&D investment
3.7.1.2 High success rates in several CEOR projects
3.7.2 Weaknesses
3.7.2.1 High cost of EOR projects
3.7.2.2 Long lead times in current research
3.7.3 Opportunities
3.7.3.1 Maturing oilfields
3.7.3.2 Introduction of Nanotechnology
3.7.4 Threats
3.7.4.1 EOR alternatives
3.7.4.2 Environmental concerns
3.8 PEST Analysis
3.8.1 Political
3.8.1.1 Production and Revenues
3.8.1.2 Energy Security
3.8.2 Economical
3.8.2.1 Oil Prices
3.8.2.2 Project Costs and Delays
3.8.2.3 Infrastructure and Supply Chain
3.8.2.3 Financing Opportunities
3.8.3 Social
3.8.3.1 Environmental Concerns
3.8.3.2 Clean energy presents a strong opposition
3.8.4 Technological
3.8.4.1 Alternative Technologies and Unconventional Production
3.8.4.2 Complexity of Projects
4 Oil Prices and their Impact on CEOR Market
4.1 Challenges to Oil & Gas Producers: Current Scenario
4.2 Forecasted Oil Prices and their Impact on CEOR
5 CEOR Cost Structure
6 Global Chemical Enhanced Oil Recovery (EOR) Market Size Forecast 2020-2030, by Type (Pre COVID and V, U, W and L COVID Recovery Scenarios)
6.1 Global Chemical Enhanced Oil Recovery (EOR) Market for Polymer Segment: Production & Revenue Forecast 2020-2030
6.1.1 Extensive Usage on account of high success rate experience
6.2 Global Chemical Enhanced Oil Recovery (EOR) Market for Surfactant Polymer Segment: Production & Revenue Forecast 2020-2030
6.2.1 High recovery rates observed in large scale deployments
6.3 Global Chemical Enhanced Oil Recovery (EOR) Market for ASP Segment: Production & Revenue Forecast 2020-2030
6.3.1 Large number of projects undertaken in China & Canada
6.4 Global Chemical Enhanced Oil Recovery (EOR) Market for Other Chemicals Segment: Production & Revenue Forecast 2020-2030
6.4.1 Nanofluids and Biopolymers expected to withness significant demand
7 Global Chemical Enhanced Oil Recovery (EOR) Market Size Forecast 2020-2030 by Application (Pre COVID and V, U, W and L COVID Recovery Scenarios)
7.1 Global Chemical Enhanced Oil Recovery (EOR) Market for Onshore Segment: Production & Revenue Forecast 2020-2030
7.1.1 Favorable government policies expected to push demand onshore
7.2 Global Chemical Enhanced Oil Recovery (EOR) Market for Offshore Segment: Production & Revenue Forecast 2020-2030
7.2.1 Significant progress made in early stage implementation at offshore location
8 Regional and Leading National Chemical Enhanced Oil Recovery (EOR) Market Forecasts 2020-2030 (Pre COVID and V, U, W and L COVID Recovery Scenarios)
8.1 Global Chemical Enhanced Oil Recovery (EOR) Production & Revenue Forecast by Region/Country Market 2020-2030
8.2 U.S.
8.2.1 U.S. Oil & Gas Outlook
8.2.2 U.S. CEOR Market Analysis
8.2.2.1 Pilot CEOR and ASP projects implemented in the U.S.
8.2.2.2 Energy Security Valued Over EOR
8.2.2.3 Drivers & Restraints for the U.S. CEOR Market
8.2.2.4 Future Outlook for CEOR in U.S.
8.2.3 U.S. Chemical Enhanced Oil Recovery (EOR) Market Forecast, 2020-2030
8.2.3.1 U.S. Chemical Enhanced Oil Recovery (EOR) Market: Recovery Scenarios (V, U, W, L)
8.3 Canada
8.3.1 Canada Oil & Gas Outlook
8.3.2 Canada CEOR Market Analysis
8.3.2.1 List of CEOR Projects in Canada
8.3.2.2 Pelican Lake CEOR Project
8.3.2.3 Other CEOR projects in Canada
8.3.2.4 Nano-particle technology discussed at the Wainwright site
8.3.2.5 Polymer Flood at Mantario, Saskatchewan
8.3.2.6 Drivers & Restraints for the Canada CEOR Market
8.3.2.7 Future Outlook for CEOR in Canada
8.3.3 Canada Chemical Enhanced Oil Recovery (EOR) Market Forecast, 2020-2030
8.3.3.1 Canada Chemical Enhanced Oil Recovery (EOR) Market: Recovery Scenarios (V, U, W, L)
8.4 Mexico
8.4.1 Mexico Oil & Gas Outlook
8.4.2 Mexico CEOR Market Analysis
8.4.2.1 PEMEX Focus on EOR
8.4.2.2 Drivers & Restraints for the Mexican CEOR Market
8.4.2.3 Future Outlook for CEOR in Mexico
8.4.3 Mexico Chemical Enhanced Oil Recovery (EOR) Market Forecast, 2020-2030
8.4.3.1 Mexico Chemical Enhanced Oil Recovery (EOR) Market: Recovery Scenarios (V, U, W, L)
8.5 Colombia
8.5.1 Colombia Oil & Gas Outlook
8.5.2 Colombia CEOR Market Analysis
8.5.2.1 Ecopetrol EOR Developments
8.5.2.2 Drivers & Restraints for the Colombia CEOR Market
8.5.2.3 Future Outlook for CEOR in Colombia
8.5.3 Colombia Chemical Enhanced Oil Recovery (EOR) Market Forecast, 2020-2030
8.5.3.1 Colombia Chemical Enhanced Oil Recovery (EOR) Market: Recovery Scenarios (V, U, W, L)
8.6 Venezuela
8.6.1 Venezuela Oil & Gas Outlook
8.6.2 Venezuela CEOR Market Analysis
8.6.2.1 CEOR at the Orinoco Belt
8.6.2.2 Extra-heavy oil properties could lead CEOR implementation
8.6.2.3 Drivers & Restraints for the Venezuela CEOR Market
8.6.2.4 Future Outlook for CEOR in Venezuela
8.6.3 Venezuela Chemical Enhanced Oil Recovery (EOR) Market Forecast, 2020-2030
8.6.3.1 Venezuela Chemical Enhanced Oil Recovery (EOR) Market: Recovery Scenarios (V, U, W, L)
8.7 Argentina
8.7.1 Argentina Oil & Gas Outlook
8.7.2 Argentina CEOR Market Analysis
8.7.2.1 Large number of pilot projects
8.7.2.2 Large Investments in Unconventional Oil Exploration
8.7.2.3 BASF Installed an HPAM Injection plant for EOR
8.7.2.4 Drivers & Restraints for the Argentina CEOR Market
8.7.2.5 Future Outlook for CEOR in Argentina
8.7.3 Argentina Chemical Enhanced Oil Recovery (EOR) Market Forecast, 2020-2030
8.7.3.1 Argentina Chemical Enhanced Oil Recovery (EOR) Market: Recovery Scenarios (V, U, W, L)
8.8 Rest of LATAM
8.8.1 Rest of LATAM Oil & Gas Outlook
8.8.2 Rest of LATAM CEOR Market Analysis
8.8.2.1 Brazil Focuses on EOR technologies
8.8.2.2 Potential for EOR in Ecuador
8.8.2.3 Drivers & Restraints for the Rest of LATAM CEOR Market
8.8.2.4 Future Outlook for CEOR in Rest of LATAM
8.8.3 Rest of LATAM Chemical Enhanced Oil Recovery (EOR) Market Forecast, 2020-2030
8.8.3.1 Rest of LATAM Chemical Enhanced Oil Recovery (EOR) Market: Recovery Scenarios (V, U, W, L)
8.9 North Sea
8.9.1 North Sea Oil & Gas Outlook
8.9.2 North Sea CEOR Market Analysis
8.9.2.1 EOR Potential in UKCS Field
8.9.2.2 NCS Field Opportunities
8.9.2.3 Drivers & Restraints for the North Sea CEOR Market
8.9.2.4 Future Outlook for CEOR in North Sea
8.9.3 North Sea Chemical Enhanced Oil Recovery (EOR) Market Forecast, 2020-2030
8.9.3.1 North Sea Chemical Enhanced Oil Recovery (EOR) Market: Recovery Scenarios (V, U, W, L)
8.10 UAE
8.10.1 UAE Oil & Gas Outlook
8.10.2 UAE CEOR Market Analysis
8.10.2.1 Al-Bukhoosh Offshore Field
8.10.2.2 Opportunities in Umm Shaif and Nasr and Lower Zakum concession
8.10.2.3 ADNOC Plans Investments in Hybrid EOR
8.10.2.4 Drivers & Restraints for the UAE CEOR Market
8.10.2.5 Future Outlook for CEOR in UAE
8.10.3 UAE Chemical Enhanced Oil Recovery (EOR) Market Forecast, 2020-2030
8.10.3.1 UAE Chemical Enhanced Oil Recovery (EOR) Market: Recovery Scenarios (V, U, W, L)
8.11 Oman
8.11.1 Oman Oil & Gas Outlook
8.11.2 Oman CEOR Market Analysis
8.11.2.1 Marmul Polymer Flooding Project
8.11.2.2 Drivers & Restraints for the Oman CEOR Market
8.11.2.3 Future Outlook for CEOR in Oman
8.11.3 Oman Chemical Enhanced Oil Recovery (EOR) Market Forecast, 2020-2030
8.11.3.1 Oman Chemical Enhanced Oil Recovery (EOR) Market: Recovery Scenarios (V, U, W, L)
8.12 Rest Of MEA
8.12.1 Rest of MEA Oil & Gas Outlook
8.12.2 Rest of MEA CEOR Market Analysis
8.12.2.1 Opportunities for CEOR in Kuwait
8.12.2.2 Opportunities for CEOR in Saudi Arabia
8.12.2.3 Drivers & Restraints for the RoMEA CEOR Market
8.12.3 Rest Of MEA Chemical Enhanced Oil Recovery (EOR) Market Forecast, 2020-2030
8.12.3.1 Rest Of MEA Chemical Enhanced Oil Recovery (EOR) Market: Recovery Scenarios (V, U, W, L)
8.13 China
8.13.1 China Oil & Gas Outlook
8.13.2 China CEOR Market Analysis
8.13.2.1 Daqing Field Developments
8.13.2.2 Bohai Bay Offshore EOR
8.13.2.3 Shengli field
8.13.2.4 China CEOR Projects
8.13.2.5 Drivers & Restraints for the China CEOR Market
8.13.2.6 Future Outlook for CEOR in China
8.13.3 China Chemical Enhanced Oil Recovery (EOR) Market Forecast, 2020-2030
8.13.3.1 China Chemical Enhanced Oil Recovery (EOR) Market: Recovery Scenarios (V, U, W, L)
8.14 India
8.14.1 India Oil & Gas Outlook
8.14.2 India CEOR Market Analysis
8.14.2.1 Cairn Oil EOR project in Mangala, Bhagyam, and Aishwariya fields
8.14.2.2 Successful CEOR pilot project at the ONGC Becharji heavy oil field
8.14.2.3 Ongoing & conceptualized projects in India
8.14.2.4 Government Policies aiming to boost EOR Implementations
8.14.2.5 Drivers & Restraints for the India CEOR Market
8.14.2.6 Future Outlook for CEOR in India
8.14.3 India Chemical Enhanced Oil Recovery (EOR) Market Forecast, 2020-2030
8.14.3.1 India Chemical Enhanced Oil Recovery (EOR) Market: Recovery Scenarios (V, U, W, L)
8.15 Indonesia
8.15.1 Indonesia Oil & Gas Outlook
8.15.2 Indonesia CEOR Market Analysis
8.15.2.1 SP Flooding Project at Minas Oilfield
8.15.2.2 Surfactant Flooding at Tanjung Field in South Kalimantan
8.15.2.3 CEOR Implementation at Kaji Field
8.15.2.4 Efficient Chemical Supply Chain Infrastructure
8.15.2.5 Drivers & Restraints for the Indonesian CEOR Market
8.15.2.6 Future Outlook for CEOR in Indonesia
8.15.3 Indonesia Chemical Enhanced Oil Recovery (EOR) Market Forecast, 2020-2030
8.15.3.1 Indonesia Chemical Enhanced Oil Recovery (EOR) Market: Recovery Scenarios (V, U, W, L)
8.16 Thailand
8.16.1 Thailand Oil & Gas Outlook
8.16.2 Thailand CEOR Market Analysis
8.16.2.1 Drivers & Restraints for the Thailand CEOR Market
8.16.2.2 Future Outlook for CEOR in Thailand
8.16.3 Thailand Chemical Enhanced Oil Recovery (EOR) Market Forecast, 2020-2030
8.16.3.1 Thailand Chemical Enhanced Oil Recovery (EOR) Market: Recovery Scenarios (V, U, W, L)
8.17 Malaysia
8.17.1 Malaysia Oil & Gas Outlook
8.17.2 Malaysian CEOR Market Analysis
8.17.2.1 Angsi Field Offshore Development
8.17.2.2 St Joseph Field Offshore Development
8.17.2.3 The Petronas and Shell Malaysia EOR Deal
8.17.2.4 Government Incentives to Promote Marginal Field Developments
8.17.2.5 Shift from PSC to RSC Regime
8.17.2.6 Drivers & Restraints for the Malaysian CEOR Market
8.17.2.7 Future Outlook for CEOR in Malaysia
8.17.3 Malaysia Chemical Enhanced Oil Recovery (EOR) Market Forecast, 2020-2030
8.17.3.1 Malaysia Chemical Enhanced Oil Recovery (EOR) Market: Recovery Scenarios (V, U, W, L)
8.18 Russia
8.18.1 Russian Oil & Gas Outlook
8.18.2 Russian CEOR Market Analysis
8.18.2.1 Declining Oil Recovery in West Siberia presents a Lucrative Opportunity
8.18.2.2 Drivers & Restraints for the Russian CEOR Market
8.18.2.3 Lukoil Actively involved in CEOR Implementation
8.18.2.4 Future Outlook for CEOR in Russia
8.18.3 Russia Chemical Enhanced Oil Recovery (EOR) Market Forecast, 2020-2030
8.18.3.1 Russia Chemical Enhanced Oil Recovery (EOR) Market: Recovery Scenarios (V, U, W, L)
8.19 Angola
8.19.1 Angola Oil & Gas Outlook
8.19.2 Angola’s CEOR Market Analysis
8.19.2.1 Favourable Government Regulations
8.19.2.2 Drivers & Restraints for Angola’s CEOR Market
8.19.2.3 Future Outlook for CEOR in Angola
8.19.3 Angola Chemical Enhanced Oil Recovery (EOR) Market Forecast, 2020-2030
8.19.3.1 Angola Chemical Enhanced Oil Recovery (EOR) Market: Recovery Scenarios (V, U, W, L)
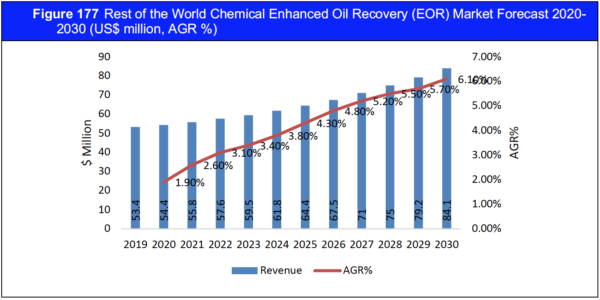
8.20 Rest of the World
8.20.1 Rest of the World Chemical Enhanced Oil Recovery (EOR) Market Forecast, 2020-2030
8.20.1.1 Rest of the World Chemical Enhanced Oil Recovery (EOR) Market: Recovery Scenarios (V, U, W, L)
9 Expert Opinion
9.1 UEORS Consultant
9.1.1 Introduction
9.1.2 Effects of The Oil Price Collapse and COVID-19 pandemic
9.1.3 Future Role of Emerging Chemical EOR Projects
9.1.4 Offshore Chemical EOR Developments
9.1.5 What Are Other Important Drivers and Restraints in The Market?
9.1.6 Biopolymers and their Impact
9.1.7 Future Outlook
10 Leading Companies in the Chemical Enhanced Oil Recovery (EOR) Market
10.1 Chemical EOR Market: Company Share Analysis
10.2 Chemical EOR Industry Chain Analysis
10.3 Major Oil Companies in the Chemical EOR Market
10.3.1 PetroChina Company Limited (CNPC)
10.3.1.1 Company Snapshot
10.3.1.2 Company Overview
10.3.1.3 Company Financials, 2015-2019
10.3.1.4 Project Portfolio
10.3.1.5 Future Outlook
10.3.1.6 Recent Developments
10.3.2 International Petroleum Corporation (IPC)
10.3.2.1 Company Snapshot
10.3.2.2 Company Overview
10.3.2.3 Company Financials, 2016-2019
10.3.2.4 Project Portfolio
10.3.2.5 Future Outlook
10.3.2.6 Recent Developments, 2018-2020
10.3.3 China National Offshore Oil Corporation (CNOOC)
10.3.3.1 Company Snapshot
10.3.3.2 Company Overview
10.3.3.3 Company Financials, 2015-2019
10.3.3.4 Project Portfolio
10.3.3.5 Future Outlook
10.3.3.6 Recent Developments, 2019-2020
10.3.4 Cenovus Energy Inc.
10.3.4.1 Company Snapshot
10.3.4.2 Company Overview
10.3.4.3 Company Financials, 2015-2019
10.3.4.4 Project Portfolio
10.3.4.5 Future Outlook
10.3.4.6 Recent Developments, 2017-2018
10.3.5 Murphy Oil Corporation
10.3.5.1 Company Snapshot
10.3.5.2 Company Overview
10.3.5.3 Company Financials, 2015-2019
10.3.5.4 Project Portfolio
10.3.5.5 Future Outlook
10.3.5.6 Recent Developments, 2018-2020
10.3.6 Petroleum Development Oman (PDO)
10.3.6.1 Company Snapshot
10.3.6.2 Company Overview
10.3.6.3 Project Portfolio
10.3.6.4 Future Outlook
10.3.6.5 Recent Developments, 2020
10.3.7 Sinopec Group (China Petrochemical Corporation)
10.3.7.1 Company Snapshot
10.3.7.2 Company Overview
10.3.7.3 Company Financials, 2015-2019
10.3.7.4 Project Portfolio
10.3.7.5 Future Outlook
10.3.8 Canadian Natural Resources (CNRL)
10.3.8.1 Company Snapshot
10.3.8.2 Company Overview
10.3.8.3 Financials, 2015-2019
10.3.8.4 Project Portfolio
10.3.8.5 Future Outlook
10.3.8.6 Recent Developments, 2018-2020
10.3.9 Zargon Oil & Gas Ltd.
10.3.9.1 Company Snapshot
10.3.9.2 Company Overview
10.3.9.3 Zargon Oil & Gas Ltd.: Financials, 2015-2019
10.3.9.4 Project Portfolio
10.3.9.5 Future Outlook
10.3.10 BP p.l.c
10.3.10.1 Company Snapshot
10.3.10.2 Company Overview
10.3.10.3 Company Financials, 2015-2019
10.3.10.4 Project Portfolio
10.3.10.5 Future Outlook
10.3.11 Oil and Natural Gas Corporation Ltd. (ONGC)
10.3.11.1 Company Snapshot
10.3.11.2 Company Overview
10.3.11.3 Company Financials, 2015-2019
10.3.11.4 Project Portfolio
10.3.11.5 Future Outlook
10.3.11.6 Recent Developments, 2019-2020
10.3.12 Equinor ASA
10.3.12.1 Company Snapshot
10.3.12.2 Company Overview
10.3.12.3 Company Financials, 2015-2019
10.3.12.4 Project Portfolio
10.3.12.5 Future Outlook
10.3.12.6 Recent Developments, 2019-2020
10.3.13 OMV AG
10.3.13.1 Company Snapshot
10.3.13.2 Company Overview
10.3.13.3 Company Financials, 2015-2019
10.3.13.4 Project Portfolio
10.3.13.5 Future Outlook
10.3.13.6 Recent Developments, 2019
10.3.14 Rosneft Oil Company
10.3.14.1 Company Snapshot
10.3.14.2 Company Overview
10.3.14.3 Company Financials, 2015-2019
10.3.14.4 Project Portfolio
10.3.14.5 Future Outlook
10.3.15 Total S.A.
10.3.15.1 Company Snapshot
10.3.15.2 Company Overview
10.3.15.3 Company Financials, 2015-2019
10.3.15.4 Project Portfolio
10.3.15.5 Future Outlook
10.4 Chemical Companies: Providers & Developers in the Chemical EOR Market
10.4.1 BASF
10.4.2 Kemira
10.4.3 Sasol
10.4.4 Shandong Polymer
10.4.5 SNF Group
10.4.6 Solvay
10.4.7 Surtek
10.4.8 Tiorco
10.4.9 ChemEOR
10.4.10 Clariant
10.4.11 Dow Chemicals
10.5 List of Notable Players in the CEOR Market
11 Conclusions and Recommendations
11.1 Concluding Remarks
11.2 Recommendations
12 Glossary
12.1 Associated Visiongain Reports
LIST OF TABLES
Table 1 Global Chemical Enhanced Oil Recovery (EOR) Market, 2020-2030 (US$ million, CAGR %)
Table 2 World crude oil & liquid fuel production (million barrels per day)
Table 3 Successful chemical EOR projects
Table 4 Number of EOR and Disposal Wells in the US, by State/Region
Table 5 Cost Elements of EOR Projects
Table 6 Cost Structure for CEOR Projects through Polymer Injection (%)
Table 7 OPEX for CEOR using ASP Formulation
Table 8 Total Cost per barrel of oil, by Country
Table 9 Global Chemical Enhanced Oil Recovery (EOR) Market Forecast by Type, 2020-2030 (bbl/d, AGR %, CAGR %)
Table 10 Global Chemical Enhanced Oil Recovery (EOR) Market Forecast by Type, 2020-2030 (US$ million, AGR %, CAGR %)
Table 11 Global Chemical Enhanced Oil Recovery (EOR) Market for Polymer Segment: Production Forecast 2020-2030 (bbl/d, AGR%, CAGR%)
Table 12 Global Chemical Enhanced Oil Recovery (EOR) Market for Polymer Segment: Revenue Forecast 2020-2030 (US$ million, AGR%, CAGR%)
Table 13 “V” Shaped Recovery: Global Chemical Enhanced Oil Recovery (EOR) Market for Polymer Segment, Production Forecast 2020-2030 (bbl/d, AGR%, CAGR%)
Table 14 “V” Shaped Recovery: Global Chemical Enhanced Oil Recovery (EOR) Market for Polymer Segment, Revenue Forecast 2020-2030 (US$ million, AGR%, CAGR%)
Table 15 “U” Shaped Recovery: Global Chemical Enhanced Oil Recovery (EOR) Market for Polymer Segment, Production Forecast 2020-2030 (bbl/d, AGR%, CAGR%)
Table 16 “U” Shaped Recovery: Global Chemical Enhanced Oil Recovery (EOR) Market for Polymer Segment, Revenue Forecast 2020-2030 (US$ million, AGR%, CAGR%)
Table 17 “L” Shaped Recovery: Global Chemical Enhanced Oil Recovery (EOR) Market for Polymer Segment, Production Forecast 2020-2030 (bbl/d, AGR%, CAGR%)
Table 18 “L” Shaped Recovery: Global Chemical Enhanced Oil Recovery (EOR) Market for Polymer Segment, Revenue Forecast 2020-2030 (US$ million, AGR%, CAGR%)
Table 19 “W” Shaped Recovery: Global Chemical Enhanced Oil Recovery (EOR) Market for Polymer Segment, Production Forecast 2020-2030 (bbl/d, AGR%, CAGR%)
Table 20 “W” Shaped Recovery: Global Chemical Enhanced Oil Recovery (EOR) Market for Polymer Segment, Revenue Forecast 2020-2030 (US$ million, AGR%, CAGR%)
Table 21 Global Chemical Enhanced Oil Recovery (EOR) Market for Surfactant Polymer Segment: Production Forecast 2020-2030 (bbl/d, AGR%, CAGR%)
Table 22 Global Chemical Enhanced Oil Recovery (EOR) Market for Surfactant Polymer Segment: Revenue Forecast 2020-2030 (US$ million, AGR%, CAGR%)
Table 23 “V” Shaped Recovery: Global Chemical Enhanced Oil Recovery (EOR) Market for Surfactant Polymer Segment, Production Forecast 2020-2030 (bbl/d, AGR%, CAGR%)
Table 24 “V” Shaped Recovery: Global Chemical Enhanced Oil Recovery (EOR) Market for Surfactant Polymer Segment, Revenue Forecast 2020-2030 (US$ million, AGR%, CAGR%)
Table 25 “U” Shaped Recovery: Global Chemical Enhanced Oil Recovery (EOR) Market for Surfactant Polymer Segment, Production Forecast 2020-2030 (bbl/d, AGR%, CAGR%)
Table 26 “U” Shaped Recovery: Global Chemical Enhanced Oil Recovery (EOR) Market for Surfactant Polymer Segment, Revenue Forecast 2020-2030 (US$ million, AGR%, CAGR%)
Table 27 “L” Shaped Recovery: Global Chemical Enhanced Oil Recovery (EOR) Market for Surfactant Polymer Segment, Production Forecast 2020-2030 (bbl/d, AGR%, CAGR%)
Table 28 “L” Shaped Recovery: Global Chemical Enhanced Oil Recovery (EOR) Market for Surfactant Polymer Segment, Revenue Forecast 2020-2030 (US$ million, AGR%, CAGR%)
Table 29 “W” Shaped Recovery: Global Chemical Enhanced Oil Recovery (EOR) Market for Surfactant Polymer Segment, Production Forecast 2020-2030 (bbl/d, AGR%, CAGR%)
Table 30 “W” Shaped Recovery: Global Chemical Enhanced Oil Recovery (EOR) Market for Surfactant Polymer Segment, Revenue Forecast 2020-2030 (US$ million, AGR%, CAGR%)
Table 31 Global Chemical Enhanced Oil Recovery (EOR) Market for ASP Segment: Production Forecast 2020-2030 (bbl/d, AGR%, CAGR%)
Table 32 Global Chemical Enhanced Oil Recovery (EOR) Market for ASP Segment: Revenue Forecast 2020-2030 (US$ million, AGR%, CAGR%)
Table 33 “V” Shaped Recovery: Global Chemical Enhanced Oil Recovery (EOR) Market for ASP Segment, Production Forecast 2020-2030 (bbl/d, AGR%, CAGR%)
Table 34 “V” Shaped Recovery: Global Chemical Enhanced Oil Recovery (EOR) Market for ASP Segment, Revenue Forecast 2020-2030 (US$ million, AGR%, CAGR%)
Table 35 “U” Shaped Recovery: Global Chemical Enhanced Oil Recovery (EOR) Market for ASP Segment, Production Forecast 2020-2030 (bbl/d, AGR%, CAGR%)
Table 36 “U” Shaped Recovery: Global Chemical Enhanced Oil Recovery (EOR) Market for ASP Segment, Revenue Forecast 2020-2030 (US$ million, AGR%, CAGR%)
Table 37 “L” Shaped Recovery: Global Chemical Enhanced Oil Recovery (EOR) Market for ASP Segment, Production Forecast 2020-2030 (bbl/d, AGR%, CAGR%)
Table 38 “L” Shaped Recovery: Global Chemical Enhanced Oil Recovery (EOR) Market for ASP Segment, Revenue Forecast 2020-2030 (US$ million, AGR%, CAGR%)
Table 39 “W” Shaped Recovery: Global Chemical Enhanced Oil Recovery (EOR) Market for ASP Segment, Production Forecast 2020-2030 (bbl/d, AGR%, CAGR%)
Table 40 “W” Shaped Recovery: Global Chemical Enhanced Oil Recovery (EOR) Market for ASP Segment, Revenue Forecast 2020-2030 (US$ million, AGR%, CAGR%)
Table 41 Merits & Demerits of Biopolymer in CEOR
Table 42 Global Chemical Enhanced Oil Recovery (EOR) Market for Other Chemicals Segment: Production Forecast 2020-2030 (bbl/d, AGR%, CAGR%)
Table 43 Global Chemical Enhanced Oil Recovery (EOR) Market for Other Chemicals Segment: Revenue Forecast 2020-2030 (US$ million, AGR%, CAGR%)
Table 44 “V” Shaped Recovery: Global Chemical Enhanced Oil Recovery (EOR) Market for Other Chemicals Segment, Production Forecast 2020-2030 (bbl/d, AGR%, CAGR%)
Table 45 “V” Shaped Recovery: Global Chemical Enhanced Oil Recovery (EOR) Market for Other Chemicals Segment, Revenue Forecast 2020-2030 (US$ million, AGR%, CAGR%)
Table 46 “U” Shaped Recovery: Global Chemical Enhanced Oil Recovery (EOR) Market for Other Chemicals Segment, Production Forecast 2020-2030 (bbl/d, AGR%, CAGR%)
Table 47 “U” Shaped Recovery: Global Chemical Enhanced Oil Recovery (EOR) Market for Other Chemicals Segment, Revenue Forecast 2020-2030 (US$ million, AGR%, CAGR%)
Table 48 “L” Shaped Recovery: Global Chemical Enhanced Oil Recovery (EOR) Market for Other Chemicals Segment, Production Forecast 2020-2030 (bbl/d, AGR%, CAGR%)
Table 49 “L” Shaped Recovery: Global Chemical Enhanced Oil Recovery (EOR) Market for Other Chemicals Segment, Revenue Forecast 2020-2030 (US$ million, AGR%, CAGR%)
Table 50 “W” Shaped Recovery: Global Chemical Enhanced Oil Recovery (EOR) Market for Other Chemicals Segment, Production Forecast 2020-2030 (bbl/d, AGR%, CAGR%)
Table 51 “W” Shaped Recovery: Global Chemical Enhanced Oil Recovery (EOR) Market for Other Chemicals Segment, Revenue Forecast 2020-2030 (US$ million, AGR%, CAGR%)
Table 52 Global Chemical Enhanced Oil Recovery (EOR) Market Forecast by Application, 2020-2030 (bbl/d, AGR %, CAGR %)
Table 53 Global Chemical Enhanced Oil Recovery (EOR) Market Forecast by Application, 2020-2030 (US$ million, AGR %, CAGR %)
Table 54 Global Chemical Enhanced Oil Recovery (EOR) Market for Onshore Segment: Production Forecast 2020-2030 (bbl/d, AGR%, CAGR%)
Table 55 Global Chemical Enhanced Oil Recovery (EOR) Market for Onshore Segment: Revenue Forecast 2020-2030 (US$ million, AGR%, CAGR%)
Table 56 “V” Shaped Recovery: Global Chemical Enhanced Oil Recovery (EOR) Market for Onshore Segment, Production Forecast 2020-2030 (bbl/d, AGR%, CAGR%)
Table 57 “V” Shaped Recovery: Global Chemical Enhanced Oil Recovery (EOR) Market for Onshore Segment, Revenue Forecast 2020-2030 (US$ million, AGR%, CAGR%)
Table 58 “U” Shaped Recovery: Global Chemical Enhanced Oil Recovery (EOR) Market for Onshore Segment, Production Forecast 2020-2030 (bbl/d, AGR%, CAGR%)
Table 59 “U” Shaped Recovery: Global Chemical Enhanced Oil Recovery (EOR) Market for Onshore Segment, Revenue Forecast 2020-2030 (US$ million, AGR%, CAGR%)
Table 60 “L” Shaped Recovery: Global Chemical Enhanced Oil Recovery (EOR) Market for Onshore Segment, Production Forecast 2020-2030 (bbl/d, AGR%, CAGR%)
Table 61 “L” Shaped Recovery: Global Chemical Enhanced Oil Recovery (EOR) Market for Onshore Segment, Revenue Forecast 2020-2030 (US$ million, AGR%, CAGR%)
Table 62 “W” Shaped Recovery: Global Chemical Enhanced Oil Recovery (EOR) Market for Onshore Segment, Production Forecast 2020-2030 (bbl/d, AGR%, CAGR%)
Table 63 “W” Shaped Recovery: Global Chemical Enhanced Oil Recovery (EOR) Market for Onshore Segment, Revenue Forecast 2020-2030 (US$ million, AGR%, CAGR%)
Table 64 Global Chemical Enhanced Oil Recovery (EOR) Market for Offshore Segment: Production Forecast 2020-2030 (bbl/d, AGR%, CAGR%)
Table 65 Global Chemical Enhanced Oil Recovery (EOR) Market for Offshore Segment: Revenue Forecast 2020-2030 (US$ million, AGR%, CAGR%)
Table 66 “V” Shaped Recovery: Global Chemical Enhanced Oil Recovery (EOR) Market for Offshore Segment, Production Forecast 2020-2030 (bbl/d, AGR%, CAGR%)
Table 67 “V” Shaped Recovery: Global Chemical Enhanced Oil Recovery (EOR) Market for Offshore Segment, Revenue Forecast 2020-2030 (US$ million, AGR%, CAGR%)
Table 68 “U” Shaped Recovery: Global Chemical Enhanced Oil Recovery (EOR) Market for Offshore Segment, Production Forecast 2020-2030 (bbl/d, AGR%, CAGR%)
Table 69 “U” Shaped Recovery: Global Chemical Enhanced Oil Recovery (EOR) Market for Offshore Segment, Revenue Forecast 2020-2030 (US$ million, AGR%, CAGR%)
Table 70 “L” Shaped Recovery: Global Chemical Enhanced Oil Recovery (EOR) Market for Offshore Segment, Production Forecast 2020-2030 (bbl/d, AGR%, CAGR%)
Table 71 “L” Shaped Recovery: Global Chemical Enhanced Oil Recovery (EOR) Market for Offshore Segment, Revenue Forecast 2020-2030 (US$ million, AGR%, CAGR%)
Table 72 “W” Shaped Recovery: Global Chemical Enhanced Oil Recovery (EOR) Market for Offshore Segment, Production Forecast 2020-2030 (bbl/d, AGR%, CAGR%)
Table 73 “W” Shaped Recovery: Global Chemical Enhanced Oil Recovery (EOR) Market for Offshore Segment, Revenue Forecast 2020-2030 (US$ million, AGR%, CAGR%)
Table 74 Global Chemical Enhanced Oil Recovery (EOR) Market Forecast by Region, 2020-2030 (bbl/d, AGR %)
Table 75 Global Chemical Enhanced Oil Recovery (EOR) Market Forecast by Region, 2020-2030 (US$ Million, AGR %)
Table 76 U.S. CEOR Pilot Projects
Table 77 U.S. Implemented ASP CEOR Projects
Table 78 Drivers & Restraints for the U.S. CEOR Market
Table 79 U.S. Chemical Enhanced Oil Recovery (EOR) Market, Production Forecast 2020-2030 (bbl/d, AGR%, CAGR%)
Table 80 U.S. Chemical Enhanced Oil Recovery (EOR) Market, Revenue Forecast 2020-2030 (US$ million, AGR%, CAGR%)
Table 81 U.S. Chemical Enhanced Oil Recovery (EOR) Market, Production Forecast 2020-2030 (bbl/d, AGR%, CAGR%): V-Shaped Recovery
Table 82 U.S. Chemical Enhanced Oil Recovery (EOR) Market, Revenue Forecast 2020-2030 (US$ million, AGR%, CAGR%): V-Shaped Recovery
Table 83 U.S. Chemical Enhanced Oil Recovery (EOR) Market, Production Forecast 2020-2030 (bbl/d, AGR%, CAGR%): U-Shaped Recovery
Table 84 U.S. Chemical Enhanced Oil Recovery (EOR) Market, Revenue Forecast 2020-2030 (US$ million, AGR%, CAGR%): U-Shaped Recovery
Table 85 U.S. Chemical Enhanced Oil Recovery (EOR) Market, Production Forecast 2020-2030 (bbl/d, AGR%, CAGR%): L-Shaped Recovery
Table 86 U.S. Chemical Enhanced Oil Recovery (EOR) Market, Revenue Forecast 2020-2030 (US$ million, AGR%, CAGR%): L-Shaped Recovery
Table 87 U.S. Chemical Enhanced Oil Recovery (EOR) Market, Production Forecast 2020-2030 (bbl/d, AGR%, CAGR%): W-Shaped Recovery
Table 88 U.S. Chemical Enhanced Oil Recovery (EOR) Market, Production Forecast 2020-2030 (US$ million, AGR%, CAGR%): W-Shaped Recovery
Table 89 Canada CEOR Projects
Table 90 CNRL Polymer Flooding CAPEX
Table 91 Drivers & Restraints for the Canada CEOR Market
Table 92 Canada Chemical Enhanced Oil Recovery (EOR) Market, Production Forecast 2020-2030 (bbl/d, AGR%, CAGR%)
Table 93 Canada Chemical Enhanced Oil Recovery (EOR) Market, Revenue Forecast 2020-2030 (US$ million, AGR%, CAGR%)
Table 94 Canada Chemical Enhanced Oil Recovery (EOR) Market, Production Forecast 2020-2030 (bbl/d, AGR%, CAGR%): V-Shaped Recovery
Table 95 Canada Chemical Enhanced Oil Recovery (EOR) Market, Revenue Forecast 2020-2030 (US$ million, AGR%, CAGR%): V-Shaped Recovery
Table 96 Canada Chemical Enhanced Oil Recovery (EOR) Market, Production Forecast 2020-2030 (bbl/d, AGR%, CAGR%): U-Shaped Recovery
Table 97 Canada Chemical Enhanced Oil Recovery (EOR) Market, Revenue Forecast 2020-2030 (US$ million, AGR%, CAGR%): U-Shaped Recovery
Table 98 Canada Chemical Enhanced Oil Recovery (EOR) Market, Production Forecast 2020-2030 (bbl/d, AGR%, CAGR%): L-Shaped Recovery
Table 99 Canada Chemical Enhanced Oil Recovery (EOR) Market, Revenue Forecast 2020-2030 (US$ million, AGR%, CAGR%): L-Shaped Recovery
Table 100 Canada Chemical Enhanced Oil Recovery (EOR) Market, Production Forecast 2020-2030 (bbl/d, AGR%, CAGR%): W-Shaped Recovery
Table 101 Canada Chemical Enhanced Oil Recovery (EOR) Market, Revenue Forecast 2020-2030 (US$ million, AGR%, CAGR%): W-Shaped Recovery
Table 102 Mexico CEOR Pilot Projects
Table 103 Drivers & Restraints for the Mexican CEOR Market
Table 104 Mexico Chemical Enhanced Oil Recovery (EOR) Market, Production Forecast 2020-2030 (bbl/d, AGR%, CAGR%)
Table 105 Mexico Chemical Enhanced Oil Recovery (EOR) Market, Revenue Forecast 2020-2030 (US$ million, AGR%, CAGR%)
Table 106 Mexico Chemical Enhanced Oil Recovery (EOR) Market, Production Forecast 2020-2030 (bbl/d, AGR%, CAGR%): V-Shaped Recovery
Table 107 Mexico Chemical Enhanced Oil Recovery (EOR) Market, Revenue Forecast 2020-2030 (US$ million, AGR%, CAGR%): V-Shaped Recovery
Table 108 Mexico Chemical Enhanced Oil Recovery (EOR) Market, Production Forecast 2020-2030 (bbl/d, AGR%, CAGR%): U-Shaped Recovery
Table 109 Mexico Chemical Enhanced Oil Recovery (EOR) Market, Production Forecast 2020-2030 (US$ Million, AGR%, CAGR%): U-Shaped Recovery
Table 110 Mexico Chemical Enhanced Oil Recovery (EOR) Market, Production Forecast 2020-2030 (bbl/d, AGR%, CAGR%): L-Shaped Recovery
Table 111 Mexico Chemical Enhanced Oil Recovery (EOR) Market, Revenue Forecast 2020-2030 (US$ million, AGR%, CAGR%): L-Shaped Recovery
Table 112 Mexico Chemical Enhanced Oil Recovery (EOR) Market, Production Forecast 2020-2030 (bbl/d, AGR%, CAGR%): W-Shaped Recovery
Table 113 Mexico Chemical Enhanced Oil Recovery (EOR) Market, Revenue Forecast 2020-2030 (US$ million, AGR%, CAGR%): W-Shaped Recovery
Table 114 Colombia Polymer Flooding Projects
Table 115 Drivers & Restraints for the Colombia CEOR Market
Table 116 Colombia Chemical Enhanced Oil Recovery (EOR) Market, Production Forecast 2020-2030 (bbl/d, AGR%, CAGR%)
Table 117 Colombia Chemical Enhanced Oil Recovery (EOR) Market, Revenue Forecast 2020-2030 (US$ million, AGR%, CAGR%)
Table 118 Colombia Chemical Enhanced Oil Recovery (EOR) Market, Production Forecast 2020-2030 (bbl/d, AGR%, CAGR%): V-Shaped Recovery
Table 119 Colombia Chemical Enhanced Oil Recovery (EOR) Market, Revenue Forecast 2020-2030 (US$ million, AGR%, CAGR%): V-Shaped Recovery
Table 120 Colombia Chemical Enhanced Oil Recovery (EOR) Market, Production Forecast 2020-2030 (bbl/d, AGR%, CAGR%): U-Shaped Recovery
Table 121 Colombia Chemical Enhanced Oil Recovery (EOR) Market, Revenue Forecast 2020-2030 (US$ million, AGR%, CAGR%): U-Shaped Recovery
Table 122 Colombia Chemical Enhanced Oil Recovery (EOR) Market, Production Forecast 2020-2030 (bbl/d, AGR%, CAGR%): L-Shaped Recovery
Table 123 Colombia Chemical Enhanced Oil Recovery (EOR) Market, Revenue Forecast 2020-2030 (US$ million, AGR%, CAGR%): L-Shaped Recovery
Table 124 Colombia Chemical Enhanced Oil Recovery (EOR) Market, Production Forecast 2020-2030 (bbl/d, AGR%, CAGR%): W-Shaped Recovery
Table 125 Colombia Chemical Enhanced Oil Recovery (EOR) Market, Revenue Forecast 2020-2030 (US$ million, AGR%, CAGR%): W-Shaped Recovery
Table 126 Drivers & Restraints for the Venezuela CEOR Market
Table 127 Venezuela Chemical Enhanced Oil Recovery (EOR) Market, Production Forecast 2020-2030 (bbl/d, AGR%, CAGR%)
Table 128 Venezuela Chemical Enhanced Oil Recovery (EOR) Market, Revenue Forecast 2020-2030 (US$ million, AGR%, CAGR%)
Table 129 Venezuela Chemical Enhanced Oil Recovery (EOR) Market, Production Forecast 2020-2030 (bbl/d, AGR%, CAGR%): V-Shaped Recovery
Table 130 Venezuela Chemical Enhanced Oil Recovery (EOR) Market, Revenue Forecast 2020-2030 (US$ million, AGR%, CAGR%): V-Shaped Recovery
Table 131 Venezuela Chemical Enhanced Oil Recovery (EOR) Market, Production Forecast 2020-2030 (bbl/d, AGR%, CAGR%): U-Shaped Recovery
Table 132 Venezuela Chemical Enhanced Oil Recovery (EOR) Market, Revenue Forecast 2020-2030 (US$ million, AGR%, CAGR%): U-Shaped Recovery
Table 133 Venezuela Chemical Enhanced Oil Recovery (EOR) Market, Production Forecast 2020-2030 (bbl/d, AGR%, CAGR%): L-Shaped Recovery
Table 134 Venezuela Chemical Enhanced Oil Recovery (EOR) Market, Revenue Forecast 2020-2030 (US$ million, AGR%, CAGR%): L-Shaped Recovery
Table 135 Venezuela Chemical Enhanced Oil Recovery (EOR) Market, Production Forecast 2020-2030 (bbl/d, AGR%, CAGR%): W-Shaped Recovery
Table 136 Venezuela Chemical Enhanced Oil Recovery (EOR) Market, Revenue Forecast 2020-2030 (US$ million, AGR%, CAGR%): W-Shaped Recovery
Table 137 Argentina CEOR Projects
Table 138 Drivers & Restraints for the Argentina CEOR Market
Table 139 Argentina Chemical Enhanced Oil Recovery (EOR) Market, Production Forecast 2020-2030 (bbl/d, AGR%, CAGR%)
Table 140 Argentina Chemical Enhanced Oil Recovery (EOR) Market, Revenue Forecast 2020-2030 (US$ million, AGR%, CAGR%)
Table 141 Argentina Chemical Enhanced Oil Recovery (EOR) Market, Production Forecast 2020-2030 (bbl/d, AGR%, CAGR%): V-Shaped Recovery
Table 142 Argentina Chemical Enhanced Oil Recovery (EOR) Market, Revenue Forecast 2020-2030 (US$ million, AGR%, CAGR%): V-Shaped Recovery
Table 143 Argentina Chemical Enhanced Oil Recovery (EOR) Market, Production Forecast 2020-2030 (bbl/d, AGR%, CAGR%): U-Shaped Recovery
Table 144 Argentina Chemical Enhanced Oil Recovery (EOR) Market, Revenue Forecast 2020-2030 (US$ million, AGR%, CAGR%): U-Shaped Recovery
Table 145 Argentina Chemical Enhanced Oil Recovery (EOR) Market, Production Forecast 2020-2030 (bbl/d, AGR%, CAGR%): L-Shaped Recovery
Table 146 Argentina Chemical Enhanced Oil Recovery (EOR) Market, Revenue Forecast 2020-2030 (US$ million, AGR%, CAGR%): L-Shaped Recovery
Table 147 Argentina Chemical Enhanced Oil Recovery (EOR) Market, Production Forecast 2020-2030 (bbl/d, AGR%, CAGR%): W-Shaped Recovery
Table 148 Argentina Chemical Enhanced Oil Recovery (EOR) Market, Revenue Forecast 2020-2030 (US$ million, AGR%, CAGR%): W-Shaped Recovery
Table 149 Drivers & Restraints for the Rest of LATAM CEOR Market
Table 150 Rest of LATAM Chemical Enhanced Oil Recovery (EOR) Market, Production Forecast 2020-2030 (bbl/d, AGR%, CAGR%)
Table 151 Rest of LATAM Chemical Enhanced Oil Recovery (EOR) Market, Revenue Forecast 2020-2030 (US$ million, AGR%, CAGR%)
Table 152 Rest of LATAM Chemical Enhanced Oil Recovery (EOR) Market, Production Forecast 2020-2030 (bbl/d, AGR%, CAGR%): V-Shaped Recovery
Table 153 Rest of LATAM Chemical Enhanced Oil Recovery (EOR) Market, Revenue Forecast 2020-2030 (US$ million, AGR%, CAGR%): V-Shaped Recovery
Table 154 Rest of LATAM Chemical Enhanced Oil Recovery (EOR) Market, Production Forecast 2020-2030 (bbl/d, AGR%, CAGR%): U-Shaped Recovery
Table 155 Rest of LATAM Chemical Enhanced Oil Recovery (EOR) Market, Revenue Forecast 2020-2030 (US$ million, AGR%, CAGR%): U-Shaped Recovery
Table 156 Rest of LATAM Chemical Enhanced Oil Recovery (EOR) Market, Production Forecast 2020-2030 (bbl/d, AGR%, CAGR%): L-Shaped Recovery
Table 157 Rest of LATAM Chemical Enhanced Oil Recovery (EOR) Market, Revenue Forecast 2020-2030 (US$ million, AGR%, CAGR%): L-Shaped Recovery
Table 158 Rest of LATAM Chemical Enhanced Oil Recovery (EOR) Market, Production Forecast 2020-2030 (bbl/d, AGR%, CAGR%): W-Shaped Recovery
Table 159 Rest of LATAM Chemical Enhanced Oil Recovery (EOR) Market, Revenue Forecast 2020-2030 (US$ million, AGR%, CAGR%): W-Shaped Recovery
Table 160 Drivers & Restraints for the North Sea CEOR Market
Table 161 North Sea Chemical Enhanced Oil Recovery (EOR) Market, Production Forecast 2020-2030 (bbl/d, AGR%, CAGR%)
Table 162 North Sea Chemical Enhanced Oil Recovery (EOR) Market, Revenue Forecast 2020-2030 (US$ million, AGR%, CAGR%)
Table 163 North Sea Chemical Enhanced Oil Recovery (EOR) Market, Production Forecast 2020-2030 (bbl/d, AGR%, CAGR%): V-Shaped Recovery
Table 164 North Sea Chemical Enhanced Oil Recovery (EOR) Market, Revenue Forecast 2020-2030 (US$ million, AGR%, CAGR%): V-Shaped Recovery
Table 165 North Sea Chemical Enhanced Oil Recovery (EOR) Market, Production Forecast 2020-2030 (bbl/d, AGR%, CAGR%): U-Shaped Recovery
Table 166 North Sea Chemical Enhanced Oil Recovery (EOR) Market, Revenue Forecast 2020-2030 (US$ million, AGR%, CAGR%): U-Shaped Recovery
Table 167 North Sea Chemical Enhanced Oil Recovery (EOR) Market, Production Forecast 2020-2030 (bbl/d, AGR%, CAGR%): L-Shaped Recovery
Table 168 North Sea Chemical Enhanced Oil Recovery (EOR) Market, Revenue Forecast 2020-2030 (US$ million, AGR%, CAGR%): L-Shaped Recovery
Table 169 North Sea Chemical Enhanced Oil Recovery (EOR) Market, Production Forecast 2020-2030 (bbl/d, AGR%, CAGR%): W-Shaped Recovery
Table 170 North Sea Chemical Enhanced Oil Recovery (EOR) Market, Revenue Forecast 2020-2030 (US$ million, AGR%, CAGR%): W-Shaped Recovery
Table 171 Drivers & Restraints for the UAE CEOR Market
Table 172 UAE Chemical Enhanced Oil Recovery (EOR) Market, Production Forecast 2020-2030 (bbl/d, AGR%, CAGR%)
Table 173 UAE Chemical Enhanced Oil Recovery (EOR) Market, Revenue Forecast 2020-2030 (US$ million, AGR%, CAGR%)
Table 174 UAE Chemical Enhanced Oil Recovery (EOR) Market, Production Forecast 2020-2030 (bbl/d, AGR%, CAGR%): V-Shaped Recovery
Table 175 UAE Chemical Enhanced Oil Recovery (EOR) Market, Revenue Forecast 2020-2030 (US$ million, AGR%, CAGR%): V-Shaped Recovery
Table 176 UAE Chemical Enhanced Oil Recovery (EOR) Market, Production Forecast 2020-2030 (bbl/d, AGR%, CAGR%): U-Shaped Recovery
Table 177 UAE Chemical Enhanced Oil Recovery (EOR) Market, Revenue Forecast 2020-2030 (US$ million, AGR%, CAGR%): U-Shaped Recovery
Table 178 UAE Chemical Enhanced Oil Recovery (EOR) Market, Production Forecast 2020-2030 (bbl/d, AGR%, CAGR%): L-Shaped Recovery
Table 179 UAE Chemical Enhanced Oil Recovery (EOR) Market, Revenue Forecast 2020-2030 (US$ million, AGR%, CAGR%): L-Shaped Recovery
Table 180 UAE Chemical Enhanced Oil Recovery (EOR) Market, Production Forecast 2020-2030 (bbl/d, AGR%, CAGR%): W-Shaped Recovery
Table 181 UAE Chemical Enhanced Oil Recovery (EOR) Market, Revenue Forecast 2020-2030 (US$ million, AGR%, CAGR%): W-Shaped Recovery
Table 182 Drivers & Restraints for the Oman CEOR Market
Table 183 Oman Chemical Enhanced Oil Recovery (EOR) Market, Production Forecast 2020-2030 (bbl/d, AGR%, CAGR%)
Table 184 Oman Chemical Enhanced Oil Recovery (EOR) Market, Revenue Forecast 2020-2030 (US$ million, AGR%, CAGR%)
Table 185 Oman Chemical Enhanced Oil Recovery (EOR) Market, Production Forecast 2020-2030 (bbl/d, AGR%, CAGR%): V-Shaped Recovery
Table 186 Oman Chemical Enhanced Oil Recovery (EOR) Market, Revenue Forecast 2020-2030 (US$ million, AGR%, CAGR%): V-Shaped Recovery
Table 187 Oman Chemical Enhanced Oil Recovery (EOR) Market, Production Forecast 2020-2030 (bbl/d, AGR%, CAGR%): U-Shaped Recovery
Table 188 Oman Chemical Enhanced Oil Recovery (EOR) Market, Revenue Forecast 2020-2030 (US$ million, AGR%, CAGR%): U-Shaped Recovery
Table 189 Oman Chemical Enhanced Oil Recovery (EOR) Market, Production Forecast 2020-2030 (bbl/d, AGR%, CAGR%): L-Shaped Recovery
Table 190 Oman Chemical Enhanced Oil Recovery (EOR) Market, Revenue Forecast 2020-2030 (US$ million, AGR%, CAGR%): L-Shaped Recovery
Table 191 Oman Chemical Enhanced Oil Recovery (EOR) Market, Production Forecast 2020-2030 (bbl/d, AGR%, CAGR%): W-Shaped Recovery
Table 192 Oman Chemical Enhanced Oil Recovery (EOR) Market, Revenue Forecast 2020-2030 (US$ million, AGR%, CAGR%): W-Shaped Recovery
Table 193 Drivers & Restraints for the RoMEA CEOR Market
Table 194 Rest of MEA Chemical Enhanced Oil Recovery (EOR) Market, Production Forecast 2020-2030 (bbl/d, AGR%, CAGR%)
Table 195 Rest of MEA Chemical Enhanced Oil Recovery (EOR) Market, Revenue Forecast 2020-2030 (US$ million, AGR%, CAGR%)
Table 196 Rest of MEA Chemical Enhanced Oil Recovery (EOR) Market, Production Forecast 2020-2030 (bbl/d, AGR%, CAGR%): V-Shaped Recovery
Table 197 Rest of MEA Chemical Enhanced Oil Recovery (EOR) Market, Revenue Forecast 2020-2030 (US$ million, AGR%, CAGR%): V-Shaped Recovery
Table 198 Rest of MEA Chemical Enhanced Oil Recovery (EOR) Market, Production Forecast 2020-2030 (bbl/d, AGR%, CAGR%): U-Shaped Recovery
Table 199 Rest of MEA Chemical Enhanced Oil Recovery (EOR) Market, Revenue Forecast 2020-2030 (US$ million, AGR%, CAGR%): U-Shaped Recovery
Table 200 Rest of MEA Chemical Enhanced Oil Recovery (EOR) Market, Production Forecast 2020-2030 (bbl/d, AGR%, CAGR%): L-Shaped Recovery
Table 201 Rest of MEA Chemical Enhanced Oil Recovery (EOR) Market, Revenue Forecast 2020-2030 (US$ million, AGR%, CAGR%): L-Shaped Recovery
Table 202 Rest of MEA Chemical Enhanced Oil Recovery (EOR) Market, Production Forecast 2020-2030 (bbl/d, AGR%, CAGR%): W-Shaped Recovery
Table 203 Rest of MEA Chemical Enhanced Oil Recovery (EOR) Market, Revenue Forecast 2020-2030 (US$ million, AGR%, CAGR%): W-Shaped Recovery
Table 204 China CEOR Projects
Table 205 Drivers & Restraints for the China CEOR Market
Table 206 China Chemical Enhanced Oil Recovery (EOR) Market, Production Forecast 2020-2030 (bbl/d, AGR%, CAGR%)
Table 207 China Chemical Enhanced Oil Recovery (EOR) Market, Revenue Forecast 2020-2030 (US$ million, AGR%, CAGR%)
Table 208 China Chemical Enhanced Oil Recovery (EOR) Market, Production Forecast 2020-2030 (bbl/d, AGR%, CAGR%): V-Shaped Recovery
Table 209 China Chemical Enhanced Oil Recovery (EOR) Market, Revenue Forecast 2020-2030 (US$ million, AGR%, CAGR%): V-Shaped Recovery
Table 210 China Chemical Enhanced Oil Recovery (EOR) Market, Production Forecast 2020-2030 (bbl/d, AGR%, CAGR%): U-Shaped Recovery
Table 211 China Chemical Enhanced Oil Recovery (EOR) Market, Revenue Forecast 2020-2030 (US$ million, AGR%, CAGR%): U-Shaped Recovery
Table 212 China Chemical Enhanced Oil Recovery (EOR) Market, Production Forecast 2020-2030 (bbl/d, AGR%, CAGR%): L-Shaped Recovery
Table 213 China Chemical Enhanced Oil Recovery (EOR) Market, Revenue Forecast 2020-2030 (US$ million, AGR%, CAGR%): L-Shaped Recovery
Table 214 China Chemical Enhanced Oil Recovery (EOR) Market, Production Forecast 2020-2030 (bbl/d, AGR%, CAGR%): W-Shaped Recovery
Table 215 China Chemical Enhanced Oil Recovery (EOR) Market, Revenue Forecast 2020-2030 (US$ million, AGR%, CAGR%): W-Shaped Recovery
Table 216 Drivers & Restraints for the India CEOR Market
Table 217 India Chemical Enhanced Oil Recovery (EOR) Market, Production Forecast 2020-2030 (bbl/d, AGR%, CAGR%)
Table 218 India Chemical Enhanced Oil Recovery (EOR) Market, Revenue Forecast 2020-2030 (US$ million, AGR%, CAGR%)
Table 219 India Chemical Enhanced Oil Recovery (EOR) Market, Production Forecast 2020-2030 (bbl/d, AGR%, CAGR%): V-Shaped Recovery
Table 220 India Chemical Enhanced Oil Recovery (EOR) Market, Revenue Forecast 2020-2030 (US$ million, AGR%, CAGR%): V-Shaped Recovery
Table 221 India Chemical Enhanced Oil Recovery (EOR) Market, Production Forecast 2020-2030 (bbl/d, AGR%, CAGR%): U-Shaped Recovery
Table 222 India Chemical Enhanced Oil Recovery (EOR) Market, Revenue Forecast 2020-2030 (US$ million, AGR%, CAGR%): U-Shaped Recovery
Table 223 India Chemical Enhanced Oil Recovery (EOR) Market, Production Forecast 2020-2030 (bbl/d, AGR%, CAGR%): L-Shaped Recovery
Table 224 India Chemical Enhanced Oil Recovery (EOR) Market, Revenue Forecast 2020-2030 (US$ million, AGR%, CAGR%): L-Shaped Recovery
Table 225 India Chemical Enhanced Oil Recovery (EOR) Market, Production Forecast 2020-2030 (bbl/d, AGR%, CAGR%): W-Shaped Recovery
Table 226 India Chemical Enhanced Oil Recovery (EOR) Market, Revenue Forecast 2020-2030 (US$ million, AGR%, CAGR%): W-Shaped Recovery
Table 227 Indonesia CEOR Projects
Table 228 Drivers & Restraints for the Indonesian CEOR Market
Table 229 Indonesia Chemical Enhanced Oil Recovery (EOR) Market, Production Forecast 2020-2030 (bbl/d, AGR%, CAGR%)
Table 230 Indonesia Chemical Enhanced Oil Recovery (EOR) Market, Revenue Forecast 2020-2030 (US$ million, AGR%, CAGR%)
Table 231 Indonesia Chemical Enhanced Oil Recovery (EOR) Market, Production Forecast 2020-2030 (bbl/d, AGR%, CAGR%): V-Shaped Recovery
Table 232 Indonesia Chemical Enhanced Oil Recovery (EOR) Market, Revenue Forecast 2020-2030 (US$ million, AGR%, CAGR%): V-Shaped Recovery
Table 233 Indonesia Chemical Enhanced Oil Recovery (EOR) Market, Production Forecast 2020-2030 (bbl/d, AGR%, CAGR%): U-Shaped Recovery
Table 234 Indonesia Chemical Enhanced Oil Recovery (EOR) Market, Revenue Forecast 2020-2030 (US$ million, AGR%, CAGR%): U-Shaped Recovery
Table 235 Indonesia Chemical Enhanced Oil Recovery (EOR) Market, Production Forecast 2020-2030 (bbl/d, AGR%, CAGR%): L-Shaped Recovery
Table 236 Indonesia Chemical Enhanced Oil Recovery (EOR) Market, Revenue Forecast 2020-2030 (US$ million, AGR%, CAGR%): L-Shaped Recovery
Table 237 Indonesia Chemical Enhanced Oil Recovery (EOR) Market, Production Forecast 2020-2030 (bbl/d, AGR%, CAGR%): W-Shaped Recovery
Table 238 Indonesia Chemical Enhanced Oil Recovery (EOR) Market, Revenue Forecast 2020-2030 (US$ million, AGR%, CAGR%): W-Shaped Recovery
Table 239 Drivers & Restraints for the Thailand CEOR Market
Table 240 Thailand Chemical Enhanced Oil Recovery (EOR) Market, Production Forecast 2020-2030 (bbl/d, AGR%, CAGR%)
Table 241 Thailand Chemical Enhanced Oil Recovery (EOR) Market, Revenue Forecast 2020-2030 (US$ million, AGR%, CAGR%)
Table 242 Thailand Chemical Enhanced Oil Recovery (EOR) Market, Production Forecast 2020-2030 (bbl/d, AGR%, CAGR%): V-Shaped Recovery
Table 243 Thailand Chemical Enhanced Oil Recovery (EOR) Market, Revenue Forecast 2020-2030 (US$ million, AGR%, CAGR%): V-Shaped Recovery
Table 244 Thailand Chemical Enhanced Oil Recovery (EOR) Market, Production Forecast 2020-2030 (bbl/d, AGR%, CAGR%): U-Shaped Recovery
Table 245 Thailand Chemical Enhanced Oil Recovery (EOR) Market, Revenue Forecast 2020-2030 (US$ million, AGR%, CAGR%): U-Shaped Recovery
Table 246 Thailand Chemical Enhanced Oil Recovery (EOR) Market, Production Forecast 2020-2030 (bbl/d, AGR%, CAGR%): L-Shaped Recovery
Table 247 Thailand Chemical Enhanced Oil Recovery (EOR) Market, Revenue Forecast 2020-2030 (US$ million, AGR%, CAGR%): L-Shaped Recovery
Table 248 Thailand Chemical Enhanced Oil Recovery (EOR) Market, Production Forecast 2020-2030 (bbl/d, AGR%, CAGR%): W-Shaped Recovery
Table 249 Thailand Chemical Enhanced Oil Recovery (EOR) Market, Revenue Forecast 2020-2030 (US$ million, AGR%, CAGR%): W-Shaped Recovery
Table 250 Drivers & Restraints for the Malaysian CEOR Market
Table 251 Malaysia Chemical Enhanced Oil Recovery (EOR) Market, Production Forecast 2020-2030 (bbl/d, AGR%, CAGR%)
Table 252 Malaysia Chemical Enhanced Oil Recovery (EOR) Market, Revenue Forecast 2020-2030 (US$ million, AGR%, CAGR%)
Table 253 Malaysia Chemical Enhanced Oil Recovery (EOR) Market, Production Forecast 2020-2030 (bbl/d, AGR%, CAGR%): V-Shaped Recovery
Table 254 Malaysia Chemical Enhanced Oil Recovery (EOR) Market, Revenue Forecast 2020-2030 (US$ million, AGR%, CAGR%): V-Shaped Recovery
Table 255 Malaysia Chemical Enhanced Oil Recovery (EOR) Market, Production Forecast 2020-2030 (bbl/d, AGR%, CAGR%): U-Shaped Recovery
Table 256 Malaysia Chemical Enhanced Oil Recovery (EOR) Market, Revenue Forecast 2020-2030 (US$ million, AGR%, CAGR%): U-Shaped Recovery
Table 257 Malaysia Chemical Enhanced Oil Recovery (EOR) Market, Production Forecast 2020-2030 (bbl/d, AGR%, CAGR%): L-Shaped Recovery
Table 258 Malaysia Chemical Enhanced Oil Recovery (EOR) Market, Revenue Forecast 2020-2030 (US$ million, AGR%, CAGR%): L-Shaped Recovery
Table 259 Malaysia Chemical Enhanced Oil Recovery (EOR) Market, Production Forecast 2020-2030 (bbl/d, AGR%, CAGR%): W-Shaped Recovery
Table 260 Malaysia Chemical Enhanced Oil Recovery (EOR) Market, Revenue Forecast 2020-2030 (US$ million, AGR%, CAGR%): W-Shaped Recovery
Table 261 Russia Polymer CEOR Projects
Table 262 Drivers & Restraints for the Russian CEOR Market
Table 263 Russia Chemical Enhanced Oil Recovery (EOR) Market, Production Forecast 2020-2030 (bbl/d, AGR%, CAGR%)
Table 264 Russia Chemical Enhanced Oil Recovery (EOR) Market, Revenue Forecast 2020-2030 (US$ million, AGR%, CAGR%)
Table 265 Russia Chemical Enhanced Oil Recovery (EOR) Market, Production Forecast 2020-2030 (bbl/d, AGR%, CAGR%): V-Shaped Recovery
Table 266 Russia Chemical Enhanced Oil Recovery (EOR) Market, Revenue Forecast 2020-2030 (US$ million, AGR%, CAGR%): V-Shaped Recovery
Table 267 Russia Chemical Enhanced Oil Recovery (EOR) Market, Production Forecast 2020-2030 (bbl/d, AGR%, CAGR%): U-Shaped Recovery
Table 268 Russia Chemical Enhanced Oil Recovery (EOR) Market, Revenue Forecast 2020-2030 (US$ million, AGR%, CAGR%): U-Shaped Recovery
Table 269 Russia Chemical Enhanced Oil Recovery (EOR) Market, Production Forecast 2020-2030 (bbl/d, AGR%, CAGR%): L-Shaped Recovery
Table 270 Russia Chemical Enhanced Oil Recovery (EOR) Market, Revenue Forecast 2020-2030 (US$ million, AGR%, CAGR%): L-Shaped Recovery
Table 271 Russia Chemical Enhanced Oil Recovery (EOR) Market, Production Forecast 2020-2030 (bbl/d, AGR%, CAGR%): W-Shaped Recovery
Table 272 Russia Chemical Enhanced Oil Recovery (EOR) Market, Revenue Forecast 2020-2030 (US$ million, AGR%, CAGR%): W-Shaped Recovery
Table 273 Drivers & Restraints for Angola’s CEOR Market
Table 274 Angola Chemical Enhanced Oil Recovery (EOR) Market, Production Forecast 2020-2030 (bbl/d, AGR%, CAGR%)
Table 275 Angola Chemical Enhanced Oil Recovery (EOR) Market, Revenue Forecast 2020-2030 (US$ million, AGR%, CAGR%)
Table 276 Angola Chemical Enhanced Oil Recovery (EOR) Market, Production Forecast 2020-2030 (bbl/d, AGR%, CAGR%): V-Shaped Recovery
Table 277 Angola Chemical Enhanced Oil Recovery (EOR) Market, Revenue Forecast 2020-2030 (US$ million, AGR%, CAGR%): V-Shaped Recovery
Table 278 Angola Chemical Enhanced Oil Recovery (EOR) Market, Production Forecast 2020-2030 (bbl/d, AGR%, CAGR%): U-Shaped Recovery
Table 279 Angola Chemical Enhanced Oil Recovery (EOR) Market, Revenue Forecast 2020-2030 (US$ million, AGR%, CAGR%): U-Shaped Recovery
Table 280 Angola Chemical Enhanced Oil Recovery (EOR) Market, Production Forecast 2020-2030 (bbl/d, AGR%, CAGR%): L-Shaped Recovery
Table 281 Angola Chemical Enhanced Oil Recovery (EOR) Market, Revenue Forecast 2020-2030 (US$ million, AGR%, CAGR%): L-Shaped Recovery
Table 282 Angola Chemical Enhanced Oil Recovery (EOR) Market, Production Forecast 2020-2030 (bbl/d, AGR%, CAGR%): W-Shaped Recovery
Table 283 Angola Chemical Enhanced Oil Recovery (EOR) Market, Revenue Forecast 2020-2030 (US$ million, AGR%, CAGR%): W-Shaped Recovery
Table 284 Rest of the World Chemical Enhanced Oil Recovery (EOR) Market, Production Forecast 2020-2030 (bbl/d, AGR%, CAGR%)
Table 285 Rest of the World Chemical Enhanced Oil Recovery (EOR) Market, Revenue Forecast 2020-2030 (US$ million, AGR%, CAGR%)
Table 286 Rest of the World Chemical Enhanced Oil Recovery (EOR) Market, Production Forecast 2020-2030 (bbl/d, AGR%, CAGR%): V-Shaped Recovery
Table 287 Rest of the World Chemical Enhanced Oil Recovery (EOR) Market, Revenue Forecast 2020-2030 (US$ million, AGR%, CAGR%): V-Shaped Recovery
Table 288 Rest of the World Chemical Enhanced Oil Recovery (EOR) Market, Production Forecast 2020-2030 (bbl/d, AGR%, CAGR%): U-Shaped Recovery
Table 289 Rest of the World Chemical Enhanced Oil Recovery (EOR) Market, Revenue Forecast 2020-2030 (US$ million, AGR%, CAGR%): U-Shaped Recovery
Table 290 Rest of the World Chemical Enhanced Oil Recovery (EOR) Market, Production Forecast 2020-2030 (bbl/d, AGR%, CAGR%): L-Shaped Recovery
Table 291 Rest of the World Chemical Enhanced Oil Recovery (EOR) Market, Revenue Forecast 2020-2030 (US$ million, AGR%, CAGR%): L-Shaped Recovery
Table 292 Rest of the World Chemical Enhanced Oil Recovery (EOR) Market, Production Forecast 2020-2030 (bbl/d, AGR%, CAGR%): W-Shaped Recovery
Table 293 Rest of the World Chemical Enhanced Oil Recovery (EOR) Market, Revenue Forecast 2020-2030 (US$ million, AGR%, CAGR%): W-Shaped Recovery
Table 294 PetroChina Company Limited (CNPC) Profile 2020 (President, HQ, Founded, No. of Employees, Ticker, Website, Business Segment, Crude Oil Output, Revenue)
Table 295 PetroChina Company Limited (CNPC): Recent Developments
Table 296 International Petroleum Corporation (IPC) Profile 2020 (CEO, HQ, Founded, Ticker, Website, Business Segment, Crude Oil Output, Revenue)
Table 297 International Petroleum Corporation (IPC): Recent Developments
Table 298 China National Offshore Oil Corporation (CNOOC) Profile 2020 (CEO, HQ, Founded, Ticker, Website, Business Segment, Crude Oil Output, Revenue)
Table 299 China National Offshore Oil Corporation (CNOOC): Recent Developments
Table 300 Cenovus Energy Inc. Profile 2020 (CEO, HQ, Founded, Ticker, Website, Business Segment, Crude Oil Output, Revenue)
Table 301 Cenovus Energy Inc.: Recent Developments
Table 302 Murphy Oil Corporation Profile 2020 (CEO, HQ, Founded, Ticker, Website, Business Segment, Crude Oil Output, Revenue)
Table 303 Murphy Oil Corporation: Recent Developments
Table 304 Petroleum Development Oman (PDO) Profile 2020 (Chairman, HQ, Founded, Ticker, Website, Business Segment, Crude Oil Output)
Table 305 Petroleum Development Oman (PDO): Recent Developments
Table 306 Sinopec Group (China Petrochemical Corporation) Profile 2020 (Chairman, HQ, Founded, Ticker, Website, Business Segment, Crude Oil Output, Revenue)
Table 307 Canadian Natural Resources (CNRL) Profile 2020 (Chairman, HQ, Founded, Ticker, Website, Business Segment, Crude Oil Output)
Table 308 Canadian Natural Resources (CNRL)Recent Developments
Table 309 Zargon Oil & Gas Ltd. Profile 2020 (Chairman, HQ, Founded, Ticker, Website, Business Segment, Crude Oil Output)
Table 310 BP p.l.c Profile 2020 (CEO, HQ, Founded, Ticker, Website, Business Segment, Crude Oil Output, Revenue)
Table 311 ONGC Profile 2020 (Chairman, HQ, Founded, Ticker, Website, Business Segment, Crude Oil Output, Revenue)
Table 312 ONGC: EOI for Chemical EOR
Table 313 ONGC: Recent Developments
Table 314 Equinor ASA Profile 2020 (CEO, HQ, Founded, Ticker, Website, Business Segment, Crude Oil Output, Revenue)
Table 315 Equinor ASA: Recent Developments
Table 316 OMV AG Profile 2020 (CEO, HQ, Founded, Ticker, Website, Business Segment, Crude Oil Output, Revenue)
Table 317 OMV AG: Recent Developments
Table 318 Rosneft Oil Company Profile 2020 (CEO, HQ, Founded, Ticker, Website, Business Segment, Crude Oil Output, Revenue)
Table 319 Total S.A. Profile 2020 (CEO, HQ, Founded, Ticker, Website, Business Segment, Crude Oil Output, Revenue)
LIST OF FIGURES
Figure 1 Global Petroleum and Other Liquids, Production & Consumption, 2018 – 2021 (million barrels per day)
Figure 2 Oil Consumption 2017 Projected to 2040 (Billion toe)
Figure 3 Oilfield Development Stages
Figure 4 Enhanced Oil Recovery Market, By Type, 2020 (%)
Figure 5 Global Chemical Enhanced Oil Recovery (EOR) Market Segmentation
Figure 6 Global Chemical Enhanced Oil Recovery (EOR) Market, Region/Country Segmentation
Figure 7 Factors to Improve Success of Chemical EOR
Figure 8 Major Chemicals Used in Enhanced Oil Recovery
Figure 9 Major Factor Influencing the CEOR Market
Figure 10 Market Size Estimation
Figure 11 Global Chemical Enhanced Oil Recovery (EOR) Market Overview
Figure 12 US Consumption of Petroleum Products in 2019 (%)
Figure 13 Brent Crude Oil Prices 2010 to 2020
Figure 14 WTI Crude Oil Prices 2010 to 2020
Figure 15 SWOT Analysis
Figure 16 PEST Analysis
Figure 17 Crude & WTI Prices (2014 to 2020)
Figure 18 Natural Gas Prices (2014 to 2020)
Figure 19 Forecasted Average Oil Prices 2020 to 2050
Figure 20 Cost Structure per Barrel of Oil, By Country
Figure 21 Global Chemical Enhanced Oil Recovery (EOR) Market Forecast by Type, 2020-2030 (bbl/d, AGR %)
Figure 22 Global Chemical Enhanced Oil Recovery (EOR) Market Share Forecast by Type, 2020, 2025, 2030 (%)
Figure 23 Global Chemical Enhanced Oil Recovery (EOR) Market Forecast by Type, 2020-2030 (US$ million, AGR %)
Figure 24 Global Chemical Enhanced Oil Recovery (EOR) Market Share Forecast by Type, 2020, 2025, 2030 (%)
Figure 25 Global Chemical Enhanced Oil Recovery (EOR) Market for Polymer Segment: Production Forecast 2020-2030 (bbl/d, AGR%)
Figure 26 Global Chemical Enhanced Oil Recovery (EOR) Market for Polymer Segment: Revenue Forecast 2020-2030 (US$ million, AGR%)
Figure 27 “V” Shaped Recovery: Global Chemical Enhanced Oil Recovery (EOR) Market for Polymer Segment, Revenue Forecast 2020-2030 (US$ million, AGR%)
Figure 28 “U” Shaped Recovery: Global Chemical Enhanced Oil Recovery (EOR) Market for Polymer Segment, Revenue Forecast 2020-2030 (US$ million, AGR%)
Figure 29 “L” Shaped Recovery: Global Chemical Enhanced Oil Recovery (EOR) Market for Polymer Segment, Revenue Forecast 2020-2030 (US$ million, AGR%)
Figure 30 “W” Shaped Recovery: Global Chemical Enhanced Oil Recovery (EOR) Market for Polymer Segment, Revenue Forecast 2020-2030 (US$ million, AGR%)
Figure 31 Global Chemical Enhanced Oil Recovery (EOR) Market for Surfactant Polymer Segment: Production Forecast 2020-2030 (bbl/d, AGR%)
Figure 32 Global Chemical Enhanced Oil Recovery (EOR) Market for Surfactant Polymer Segment: Revenue Forecast 2020-2030 (US$ million, AGR%)
Figure 33 “V” Shaped Recovery: Global Chemical Enhanced Oil Recovery (EOR) Market for Surfactant Polymer Segment, Revenue Forecast 2020-2030 (US$ million, AGR%)
Figure 34 “U” Shaped Recovery: Global Chemical Enhanced Oil Recovery (EOR) Market for Surfactant Polymer Segment, Revenue Forecast 2020-2030 (US$ million, AGR%)
Figure 35 “L” Shaped Recovery: Global Chemical Enhanced Oil Recovery (EOR) Market for Surfactant Polymer Segment, Revenue Forecast 2020-2030 (US$ million, AGR%)
Figure 36 “W” Shaped Recovery: Global Chemical Enhanced Oil Recovery (EOR) Market for Surfactant Polymer Segment, Revenue Forecast 2020-2030 (US$ million, AGR%)
Figure 37 Global Chemical Enhanced Oil Recovery (EOR) Market for ASP Segment: Production Forecast 2020-2030 (bbl/d, AGR%)
Figure 38 Global Chemical Enhanced Oil Recovery (EOR) Market for ASP Segment: Revenue Forecast 2020-2030 (US$ million, AGR%)
Figure 39 “V” Shaped Recovery: Global Chemical Enhanced Oil Recovery (EOR) Market for ASP Segment, Revenue Forecast 2020-2030 (US$ million, AGR%)
Figure 40 “U” Shaped Recovery: Global Chemical Enhanced Oil Recovery (EOR) Market for ASP Segment, Revenue Forecast 2020-2030 (US$ million, AGR%)
Figure 41 “L” Shaped Recovery: Global Chemical Enhanced Oil Recovery (EOR) Market for ASP Segment, Revenue Forecast 2020-2030 (US$ million, AGR%)
Figure 42 “W” Shaped Recovery: Global Chemical Enhanced Oil Recovery (EOR) Market for ASP Segment, Revenue Forecast 2020-2030 (US$ million, AGR%)
Figure 43 Global Chemical Enhanced Oil Recovery (EOR) Market for Other Chemicals Segment: Production Forecast 2020-2030 (bbl/d, AGR%)
Figure 44 Global Chemical Enhanced Oil Recovery (EOR) Market for Other Chemicals Segment: Revenue Forecast 2020-2030 (US$ million, AGR%)
Figure 45 “V” Shaped Recovery: Global Chemical Enhanced Oil Recovery (EOR) Market for Other Chemicals Segment, Revenue Forecast 2020-2030 (US$ million, AGR%)
Figure 46 “U” Shaped Recovery: Global Chemical Enhanced Oil Recovery (EOR) Market for Other Chemicals Segment, Revenue Forecast 2020-2030 (US$ million, AGR%)
Figure 47 “L” Shaped Recovery: Global Chemical Enhanced Oil Recovery (EOR) Market for Other Chemicals Segment, Revenue Forecast 2020-2030 (US$ million, AGR%)
Figure 48 “W” Shaped Recovery: Global Chemical Enhanced Oil Recovery (EOR) Market for Other Chemicals Segment, Revenue Forecast 2020-2030 (US$ million, AGR%)
Figure 49 Global Chemical Enhanced Oil Recovery (EOR) Market Forecast by Application, 2020-2030 (bbl/d, AGR %)
Figure 50 Global Chemical Enhanced Oil Recovery (EOR) Market Share Forecast by Application, 2020, 2025, 2030 (%)
Figure 51 Global Chemical Enhanced Oil Recovery (EOR) Market Forecast by Application, 2020-2030 (US$ million, AGR %)
Figure 52 Global Chemical Enhanced Oil Recovery (EOR) Market Share Forecast by Application, 2020, 2025, 2030 (%)
Figure 53 Global Chemical Enhanced Oil Recovery (EOR) Market for Onshore Segment: Production Forecast 2020-2030 (bbl/d, AGR%)
Figure 54 Global Chemical Enhanced Oil Recovery (EOR) Market for Onshore Segment: Revenue Forecast 2020-2030 (US$ million, AGR%)
Figure 55 “V” Shaped Recovery: Global Chemical Enhanced Oil Recovery (EOR) Market for Onshore Segment, Revenue Forecast 2020-2030 (US$ million, AGR%)
Figure 56 “U” Shaped Recovery: Global Chemical Enhanced Oil Recovery (EOR) Market for Onshore Segment, Revenue Forecast 2020-2030 (US$ million, AGR%)
Figure 57 “L” Shaped Recovery: Global Chemical Enhanced Oil Recovery (EOR) Market for Onshore Segment, Revenue Forecast 2020-2030 (US$ million, AGR%)
Figure 58 “W” Shaped Recovery: Global Chemical Enhanced Oil Recovery (EOR) Market for Onshore Segment, Revenue Forecast 2020-2030 (US$ million, AGR%)
Figure 59 Global Chemical Enhanced Oil Recovery (EOR) Market for Offshore Segment: Production Forecast 2020-2030 (bbl/d, AGR%)
Figure 60 Global Chemical Enhanced Oil Recovery (EOR) Market for Offshore Segment: Revenue Forecast 2020-2030 (US$ million, AGR%)
Figure 61 “V” Shaped Recovery: Global Chemical Enhanced Oil Recovery (EOR) Market for Offshore Segment, Revenue Forecast 2020-2030 (US$ million, AGR%)
Figure 62 “U” Shaped Recovery: Global Chemical Enhanced Oil Recovery (EOR) Market for Offshore Segment, Revenue Forecast 2020-2030 (US$ million, AGR%)
Figure 63 “L” Shaped Recovery: Global Chemical Enhanced Oil Recovery (EOR) Market for Offshore Segment, Revenue Forecast 2020-2030 (US$ million, AGR%)
Figure 64 “W” Shaped Recovery: Global Chemical Enhanced Oil Recovery (EOR) Market for Offshore Segment, Revenue Forecast 2020-2030 (US$ million, AGR%)
Figure 65 Global Chemical Enhanced Oil Recovery (EOR) Market Forecast by Region/Country Markets, 2020-2030 (US$ million)
Figure 66 Global Chemical Enhanced Oil Recovery (EOR) Market Share Forecast by Region 2020, 2025, 2030 (%)
Figure 67 Global Chemical Enhanced Oil Recovery (EOR) Market Share Forecast by Region 2020, 2025, 2030 (%)
Figure 68 U.S. Crude Oil & Condensate Production 2010 to 2019 (000’ bbl/d)
Figure 69 U.S. Chemical Enhanced Oil Recovery (EOR) Market Forecast 2020-2030 (US$ million, AGR %)
Figure 70 “V”-Shaped Recovery: U.S. Chemical Enhanced Oil Recovery (EOR) Market, Revenue Forecast 2020-2030 (US$ million, AGR%)
Figure 71 “U”-Shaped Recovery: U.S. Chemical Enhanced Oil Recovery (EOR) Market, Revenue Forecast 2020-2030 (US$ million, AGR%)
Figure 72 “L”-Shaped Recovery: U.S. Chemical Enhanced Oil Recovery (EOR) Market, Revenue Forecast 2020-2030 (US$ million, AGR%)
Figure 73 “W”-Shaped Recovery: U.S. Chemical Enhanced Oil Recovery (EOR) Market, Revenue Forecast 2020-2030 (US$ million, AGR%)
Figure 74 Canada Crude Oil & Condensate Production 2010 to 2019 (000’ bbl/d)
Figure 75 Canada Chemical Enhanced Oil Recovery (EOR) Market Forecast 2020-2030 (US$ million, AGR %)
Figure 76 “V”-Shaped Recovery: Canada Chemical Enhanced Oil Recovery (EOR) Market, Revenue Forecast 2020-2030 (US$ million, AGR%)
Figure 77 “U”-Shaped Recovery: Canada Chemical Enhanced Oil Recovery (EOR) Market, Revenue Forecast 2020-2030 (US$ million, AGR%)
Figure 78 “L”-Shaped Recovery: Canada Chemical Enhanced Oil Recovery (EOR) Market, Revenue Forecast 2020-2030 (US$ million, AGR%)
Figure 79 “W”-Shaped Recovery: Canada Chemical Enhanced Oil Recovery (EOR) Market, Revenue Forecast 2020-2030 (US$ million, AGR%)
Figure 80 Mexico Crude Oil & Condensate Production 2010 to 2019 (000’ bbl/d)
Figure 81 Mexico Chemical Enhanced Oil Recovery (EOR) Market Forecast 2020-2030 (US$ million, AGR %)
Figure 82 “V”-Shaped Recovery: Mexico Chemical Enhanced Oil Recovery (EOR) Market, Revenue Forecast 2020-2030 (S$ million, AGR%)
Figure 83 “U”-Shaped Recovery: Mexico Chemical Enhanced Oil Recovery (EOR) Market, Revenue Forecast 2020-2030 (US$ million, AGR%)
Figure 84 “L”-Shaped Recovery: Mexico Chemical Enhanced Oil Recovery (EOR) Market, Revenue Forecast 2020-2030 (US$ million, AGR%)
Figure 85 “W”-Shaped Recovery: Mexico Chemical Enhanced Oil Recovery (EOR) Market, Revenue Forecast 2020-2030 (US$ million, AGR%)
Figure 86 Colombia Crude Oil & Condensate Production 2010 to 2019 (000’ bbl/d)
Figure 87 Colombia Chemical Enhanced Oil Recovery (EOR) Market Forecast 2020-2030 (US$ million, AGR %)
Figure 88 “V”-Shaped Recovery: Colombia Chemical Enhanced Oil Recovery (EOR) Market, Revenue Forecast 2020-2030 (US$ million, AGR%)
Figure 89 “U”-Shaped Recovery: Colombia Chemical Enhanced Oil Recovery (EOR) Market, Revenue Forecast 2020-2030 (US$ million, AGR%)
Figure 90 “L”-Shaped Recovery: Colombia Chemical Enhanced Oil Recovery (EOR) Market, Revenue Forecast 2020-2030 (US$ million, AGR%)
Figure 91 “W”-Shaped Recovery: Colombia Chemical Enhanced Oil Recovery (EOR) Market, Revenue Forecast 2020-2030 (US$ million, AGR%)
Figure 92 Venezuela Crude Oil & Condensate Production 2010 to 2019 (000’ bbl/d)
Figure 93 Venezuela Chemical Enhanced Oil Recovery (EOR) Market Forecast 2020-2030 (US$ million, AGR %)
Figure 94 “V”-Shaped Recovery: Venezuela Chemical Enhanced Oil Recovery (EOR) Market, Revenue Forecast 2020-2030 (US$ million, AGR%)
Figure 95 “U”-Shaped Recovery: Venezuela Chemical Enhanced Oil Recovery (EOR) Market, Revenue Forecast 2020-2030 (US$ million, AGR%)
Figure 96 “L”-Shaped Recovery: Venezuela Chemical Enhanced Oil Recovery (EOR) Market, Revenue Forecast 2020-2030 (US$ million, AGR%)
Figure 97 “W”-Shaped Recovery: Venezuela Chemical Enhanced Oil Recovery (EOR) Market, Revenue Forecast 2020-2030 (US$ million, AGR%)
Figure 98 Argentina Crude Oil & Condensate Production 2010 to 2019 (000’ bbl/d)
Figure 99 Argentina Chemical Enhanced Oil Recovery (EOR) Market Forecast 2020-2030 (US$ million, AGR %)
Figure 100 “V”-Shaped Recovery: Argentina Chemical Enhanced Oil Recovery (EOR) Market, Revenue Forecast 2020-2030 (US$ million, AGR%)
Figure 101 “U”-Shaped Recovery: Argentina Chemical Enhanced Oil Recovery (EOR) Market, Revenue Forecast 2020-2030 (US$ million, AGR%)
Figure 102 “L”-Shaped Recovery: Argentina Chemical Enhanced Oil Recovery (EOR) Market, Revenue Forecast 2020-2030 (US$ million, AGR%)
Figure 103 “W”-Shaped Recovery: Argentina Chemical Enhanced Oil Recovery (EOR) Market, Revenue Forecast 2020-2030 (US$ million, AGR%)
Figure 104 UAE Crude Oil & Condensate Production 2010 to 2019 (000’ bbl/d)
Figure 105 Rest of LATAM Chemical Enhanced Oil Recovery (EOR) Market Forecast 2020-2030 (US$ million, AGR %)
Figure 106 “V”-Shaped Recovery: Rest of LATAM Chemical Enhanced Oil Recovery (EOR) Market, Revenue Forecast 2020-2030 (US$ million, AGR%)
Figure 107 “U”-Shaped Recovery: Rest of LATAM Chemical Enhanced Oil Recovery (EOR) Market, Revenue Forecast 2020-2030 (US$ million, AGR%)
Figure 108 “L”-Shaped Recovery: Rest of LATAM Chemical Enhanced Oil Recovery (EOR) Market, Revenue Forecast 2020-2030 (US$ million, AGR%)
Figure 109 “W”-Shaped Recovery: Rest of LATAM Chemical Enhanced Oil Recovery (EOR) Market, Revenue Forecast 2020-2030 (US$ million, AGR%)
Figure 110 North Sea Chemical Enhanced Oil Recovery (EOR) Market Forecast 2020-2030 (US$ million, AGR %)
Figure 111 “V”-Shaped Recovery: North Sea Chemical Enhanced Oil Recovery (EOR) Market, Revenue Forecast 2020-2030 (US$ million, AGR%)
Figure 112 “U”-Shaped Recovery: North Sea Chemical Enhanced Oil Recovery (EOR) Market, Revenue Forecast 2020-2030 (US$ million, AGR%)
Figure 113 “L”-Shaped Recovery: North Sea Chemical Enhanced Oil Recovery (EOR) Market, Revenue Forecast 2020-2030 (US$ million, AGR%)
Figure 114 “W”-Shaped Recovery: North Sea Chemical Enhanced Oil Recovery (EOR) Market, Revenue Forecast 2020-2030 (US$ million, AGR%)
Figure 115 UAE Crude Oil & Condensate Production 2010 to 2019 (000’ bbl/d)
Figure 116 UAE Chemical Enhanced Oil Recovery (EOR) Market Forecast 2020-2030 (US$ million, AGR %)
Figure 117 “V”-Shaped Recovery: UAE Chemical Enhanced Oil Recovery (EOR) Market, Revenue Forecast 2020-2030 (US$ million, AGR%)
Figure 118 “U”-Shaped Recovery: UAE Chemical Enhanced Oil Recovery (EOR) Market, Revenue Forecast 2020-2030 (US$ million, AGR%)
Figure 119 “L”-Shaped Recovery: UAE Chemical Enhanced Oil Recovery (EOR) Market, Revenue Forecast 2020-2030 (US$ million, AGR%)
Figure 120 “W”-Shaped Recovery: UAE Chemical Enhanced Oil Recovery (EOR) Market, Revenue Forecast 2020-2030 (US$ million, AGR%)
Figure 121 Oman Crude Oil & Condensate Production 2010 to 2019 (000’ bbl/d)
Figure 122 Oman Chemical Enhanced Oil Recovery (EOR) Market Forecast 2020-2030 (US$ million, AGR %)
Figure 123 “V”-Shaped Recovery: Oman Chemical Enhanced Oil Recovery (EOR) Market, Revenue Forecast 2020-2030 (US$ million, AGR%)
Figure 124 “U”-Shaped Recovery: Oman Chemical Enhanced Oil Recovery (EOR) Market, Revenue Forecast 2020-2030 (US$ million, AGR%)
Figure 125 “L”-Shaped Recovery: Oman Chemical Enhanced Oil Recovery (EOR) Market, Revenue Forecast 2020-2030 (US$ million, AGR%)
Figure 126 “W”-Shaped Recovery: Oman Chemical Enhanced Oil Recovery (EOR) Market, Revenue Forecast 2020-2030 (US$ million, AGR%)
Figure 127 Rest of MEA Crude Oil & Condensate Production 2010 to 2019 (000’ bbl/d)
Figure 128 Rest of MEA Chemical Enhanced Oil Recovery (EOR) Market Forecast 2020-2030 (US$ million, AGR %)
Figure 129 “V”-Shaped Recovery: Rest of MEA Chemical Enhanced Oil Recovery (EOR) Market, Revenue Forecast 2020-2030 (US$ million, AGR%)
Figure 130 “U”-Shaped Recovery: Rest of MEA Chemical Enhanced Oil Recovery (EOR) Market, Revenue Forecast 2020-2030 (US$ million, AGR%)
Figure 131 “L”-Shaped Recovery: Rest of MEA Chemical Enhanced Oil Recovery (EOR) Market, Revenue Forecast 2020-2030 (US$ million, AGR%)
Figure 132 “W”-Shaped Recovery: Rest of MEA Chemical Enhanced Oil Recovery (EOR) Market, Revenue Forecast 2020-2030 (US$ million, AGR%)
Figure 133 China Crude Oil & Condensate Production 2010 to 2019 (000’ bbl/d)
Figure 134 China Chemical Enhanced Oil Recovery (EOR) Market Forecast 2020-2030 (US$ million, AGR %)
Figure 135 “V”-Shaped Recovery: China Chemical Enhanced Oil Recovery (EOR) Market, Revenue Forecast 2020-2030 (US$ million, AGR%)
Figure 136 “U”-Shaped Recovery: China Chemical Enhanced Oil Recovery (EOR) Market, Revenue Forecast 2020-2030 (US$ million, AGR%)
Figure 137 “L”-Shaped Recovery: China Chemical Enhanced Oil Recovery (EOR) Market, Revenue Forecast 2020-2030 (US$ million, AGR%)
Figure 138 “W”-Shaped Recovery: China Chemical Enhanced Oil Recovery (EOR) Market, Revenue Forecast 2020-2030 (US$ million, AGR%)
Figure 139 India Crude Oil & Condensate Production 2010 to 2019 (000’ bbl/d)
Figure 140 India Chemical Enhanced Oil Recovery (EOR) Market Forecast 2020-2030 (US$ million, AGR %)
Figure 141 “V”-Shaped Recovery: India Chemical Enhanced Oil Recovery (EOR) Market, Revenue Forecast 2020-2030 (US$ million, AGR%)
Figure 142 “U”-Shaped Recovery: India Chemical Enhanced Oil Recovery (EOR) Market, Revenue Forecast 2020-2030 (US$ million, AGR%)
Figure 143 “L”-Shaped Recovery: India Chemical Enhanced Oil Recovery (EOR) Market, Revenue Forecast 2020-2030 (US$ million, AGR%)
Figure 144 “W”-Shaped Recovery: India Chemical Enhanced Oil Recovery (EOR) Market, Revenue Forecast 2020-2030 (US$ million, AGR%)
Figure 145 Indonesia Crude Oil & Condensate Production 2010 to 2019 (000’ bbl/d)
Figure 146 Indonesia Chemical Enhanced Oil Recovery (EOR) Market Forecast 2020-2030 (US$ million, AGR %)
Figure 147 “V”-Shaped Recovery: Indonesia Chemical Enhanced Oil Recovery (EOR) Market, Revenue Forecast 2020-2030 (US$ million, AGR%)
Figure 148 “U”-Shaped Recovery: Indonesia Chemical Enhanced Oil Recovery (EOR) Market, Revenue Forecast 2020-2030 (US$ million, AGR%)
Figure 149 “L”-Shaped Recovery: Indonesia Chemical Enhanced Oil Recovery (EOR) Market, Revenue Forecast 2020-2030 (US$ million, AGR%)
Figure 150 “W”-Shaped Recovery: Indonesia Chemical Enhanced Oil Recovery (EOR) Market, Revenue Forecast 2020-2030 (US$ million, AGR%)
Figure 151 Thailand Crude Oil & Condensate Production 2010 to 2019 (000’ bbl/d)
Figure 152 Thailand Chemical Enhanced Oil Recovery (EOR) Market Forecast 2020-2030 (US$ million, AGR %)
Figure 153 “V”-Shaped Recovery: Thailand Chemical Enhanced Oil Recovery (EOR) Market, Revenue Forecast 2020-2030 (US$ million, AGR%)
Figure 154 “U”-Shaped Recovery: Thailand Chemical Enhanced Oil Recovery (EOR) Market, Revenue Forecast 2020-2030 (US$ million, AGR%)
Figure 155 “L”-Shaped Recovery: Thailand Chemical Enhanced Oil Recovery (EOR) Market, Revenue Forecast 2020-2030 (US$ million, AGR%)
Figure 156 “W”-Shaped Recovery: Thailand Chemical Enhanced Oil Recovery (EOR) Market, Revenue Forecast 2020-2030 (US$ million, AGR%)
Figure 157 Malaysia Crude Oil & Condensate Production 2010 to 2019 (000’ bbl/d)
Figure 158 Malaysia Chemical Enhanced Oil Recovery (EOR) Market Forecast 2020-2030 (US$ million, AGR %)
Figure 159 “V”-Shaped Recovery: Malaysia Chemical Enhanced Oil Recovery (EOR) Market, Revenue Forecast 2020-2030 (US$ million, AGR%)
Figure 160 “U”-Shaped Recovery: Malaysia Chemical Enhanced Oil Recovery (EOR) Market, Revenue Forecast 2020-2030 (US$ million, AGR%)
Figure 161 “L”-Shaped Recovery: Malaysia Chemical Enhanced Oil Recovery (EOR) Market, Revenue Forecast 2020-2030 (US$ million, AGR%)
Figure 162 “W”-Shaped Recovery: Malaysia Chemical Enhanced Oil Recovery (EOR) Market, Revenue Forecast 2020-2030 (US$ million, AGR%)
Figure 163 Russian Crude Oil & Condensate Production 2010 to 2019 (000’ bbl/d)
Figure 164 Additional oil recovery from EOR by Lukoil in Russia, 2019
Figure 165 Lukoil’s Incremental Oil Recovery, by technology 2019
Figure 166 Russia Chemical Enhanced Oil Recovery (EOR) Market Forecast 2020-2030 (US$ million, AGR %)
Figure 167 “V”-Shaped Recovery: Russia Chemical Enhanced Oil Recovery (EOR) Market, Revenue Forecast 2020-2030 (US$ million, AGR%)
Figure 168 “U”-Shaped Recovery Russia Chemical Enhanced Oil Recovery (EOR) Market, Revenue Forecast 2020-2030 (US$ million, AGR%)
Figure 169 “L”-Shaped Recovery: Russia Chemical Enhanced Oil Recovery (EOR) Market, Revenue Forecast 2020-2030 (US$ million, AGR%)
Figure 170 “W”-Shaped Recovery: Russia Chemical Enhanced Oil Recovery (EOR) Market, Revenue Forecast 2020-2030 (US$ million, AGR%)
Figure 171 Angola Crude Oil & Condensate Production 2010 to 2019 (000’ bbl/d)
Figure 172 Angola Chemical Enhanced Oil Recovery (EOR) Market Forecast 2020-2030 (US$ million, AGR %)
Figure 173 “V”-Shaped Recovery: Angola Chemical Enhanced Oil Recovery (EOR) Market, Revenue Forecast 2020-2030 (US$ million, AGR%)
Figure 174 “U”-Shaped Recovery: Angola Chemical Enhanced Oil Recovery (EOR) Market, Revenue Forecast 2020-2030 (US$ million, AGR%)
Figure 175 “L”-Shaped Recovery: Angola Chemical Enhanced Oil Recovery (EOR) Market, Revenue Forecast 2020-2030 (US$ million, AGR%)
Figure 176 “W”-Shaped Recovery: Angola Chemical Enhanced Oil Recovery (EOR) Market, Revenue Forecast 2020-2030 (US$ million, AGR%)
Figure 177 Rest of the World Chemical Enhanced Oil Recovery (EOR) Market Forecast 2020-2030 (US$ million, AGR %)
Figure 178 “V”-Shaped Recovery: Rest of the World Chemical Enhanced Oil Recovery (EOR) Market, Revenue Forecast 2020-2030 (US$ million, AGR%)
Figure 179 “U”-Shaped Recovery: Rest of the World Chemical Enhanced Oil Recovery (EOR) Market, Revenue Forecast 2020-2030 (US$ million, AGR%)
Figure 180 “L”-Shaped Recovery: Rest of the World Chemical Enhanced Oil Recovery (EOR) Market, Revenue Forecast 2020-2030 (US$ million, AGR%)
Figure 181 “W”-Shaped Recovery: Rest of the World Chemical Enhanced Oil Recovery (EOR) Market, Revenue Forecast 2020-2030 (US$ million, AGR%)
Figure 182 Chemical Enhanced Oil Recovery (EOR) Market: Company Share Analysis (%), 2019
Figure 183 Chemical Enhanced Oil Recovery (EOR) Market: Industry Chain Analysis
Figure 184 Leading Companies and Research Bodies in the Global Chemical EOR Market (Operators, Chemical Providers and Developers)
Figure 185 PetroChina Company Limited (CNPC) Financials, 2015-2019 (US$ billion, AGR %)
Figure 186 International Petroleum Corporation (IPC) Financials, 2016-2019 (US$ million, AGR %)
Figure 187 China National Offshore Oil Corporation (CNOOC) Financials, 2015-2019 (US$ billion, AGR %)
Figure 188 China National Offshore Oil Corporation (CNOOC) Crude Oil & Liquids, 2019 (mm bbls)
Figure 189 Cenovus Energy Inc. Financials, 2015-2019 (US$ billion, AGR %)
Figure 190 Cenovus Energy Inc. Segmental Revenue, 2019 (%)
Figure 191 Cenovus Energy Inc. Regional Revenue, 2019 (%)
Figure 192 Murphy Oil Corporation Financials, 2015-2019 (US$ billion, AGR %)
Figure 193 Murphy Oil Corporation Segmental Revenue, 2019 (%)
Figure 194 Petroleum Development Oman (PDO) EOR Projection, 2020 & 2025 (%)
Figure 195 Sinopec Group (China Petrochemical Corporation) Crude Oil Production, 2017 to 2019 (mmbbls)
Figure 196 Sinopec Group (China Petrochemical Corporation) Financials, 2015-2019 (US$ billion, AGR %)
Figure 197 Canadian Natural Resources (CNRL) Financials, 2015-2019 (US$ billion, AGR %)
Figure 198 Zargon Oil & Gas Ltd. Oil & Liquids Production by Core Area, 2019 (%)
Figure 199 Zargon Oil & Gas Ltd. Financials, 2015-2019 (US$ million, AGR %)
Figure 200 BP p.l.c Financials, 2015-2019 (US$ billion, AGR %)
Figure 201 ONGC Financials, 2015-2019 (US$ billion, AGR %)
Figure 202 Equinor ASA Financials, 2015-2019 (US$ billion, AGR %)
Figure 203 Equinor ASA Financials, By Business Segment 2019 (US$ billion)
Figure 204 Equinor ASA Financials, Crude Oil By Region 2019 (%)
Figure 205 OMV AG Financials, 2015-2019 (US$ billion, AGR %)
Figure 206 Rosneft Oil Company Financials, 2015-2019 (US$ billion, AGR %)
Figure 207 Total S.A. Financials, 2015-2019 (US$ billion, AGR %)
Figure 208 Leading Chemical Companies by Revenue, 2018 (USD Billion)
Figure 209 Market Share of Chemical Companies in the CEOR Market, 2019 (%)
Figure 210 Industry and Water Division Application Revenue Spilt (%)
Figure 211 Industry and Water Division Product Revenue Spilt (%)
BP p.l.c
Canadian Natural Resources (CNRL)
Cenovus Energy Inc.
China National Offshore Oil Corporation (CNOOC)
Equinor ASA
International Petroleum Corporation (IPC)
Murphy Oil Corporation
Oil & Gas Natural Gas Corporation Ltd. (ONGC)
OMV AG
PetroChina Company Limited (CNPC)
Petroleum Development Oman
Rosneft Oil Company
Sinopec Group (China Petrochemical Corporation)
Total SA
Zargon Oil & Gas Ltd.
Chemical Providers Profiled in the Report
BASF
ChemEOR
Clariant
Dow Chemicals
Kemira
Sasol
Shandong Polymer
SNF Group
Solvay
Surtek
Tiorco
List of Companies Mentioned in the Report
3F Chimica
Accelerated Oil Technologies LLC
Acceleware Ltd.
Anterra Energy Inc
Audubon Companies
Azuren BV
BASF
Beicip-Franlab
Beijing Hengju Chemical Group Corp
Belayim Petroleum Company
Berexco
BlackPearl Resources
BP
BP Migas
Cairn Energy India
Cenovus
ChemEOR
Chevron
China Petroleum & Chemical Corporation
Clariant
CNOOC
CNPC
CNRL
Connacher Oil and Gas Limited
Dow Chemicals
Ecopetrol S.A
Equinor
ExxonMobil
GlassPoint
Hart Energy
Harvest Energy
Harvest Operations
Huntsman
Husky Energy
Husky Oil Operations
Hyak Energy
Hyundai
IFP Energies Nouvelles
Kemira
KOC
Lamor Corporation
Lukoil
Medco Enerji Internasional
Murphy Oil
Nalco
Nexen Inc.
Norlense AS
NorthStar Downhole Specialist
Occidental Petroleum
Oil Chem Technologies
Oil India Ltd.
Oil Plus
OMV AG
ONGC
Pan American Energy
Partex Corporation
Pengrowth Energy Corporation
Penn West
Pertamina
Petroamazonas
Petrobras
PetroChina
Petrofac
Petróleos de Venezuela, S.A. (PDVSA)
Petróleos Mexicanos (PEMEX)
Petroleum Development Oman (PDO)
Petronas
PT Chevron Pacific Indonesia
PT Erraenersi Konstruksindo
PT Multi Structure
PwC
Repsol
Rex Energy
Rock Energy
Rosneft Oil Company
RusPAV
Sasol
Saudi Aramco
Shandong Polymer Bio-Chemicals Co. Ltd
Shell (Royal Dutch Shell)
Shell Canada
Shell Chemicals
SIBUR
Siemens Energy
Sinopec (China Petroleum and Chemical Corporation)
SNF Group
Solvay
Statoil
Stepan
Surtek
Talisman
TD Securities
Terrex Energy
Texaco
Tiorco
Titan Oil Recovery Inc.
Total
Toyo Engineering Corporation
Wintershall
World Petroleum Org
YPF
Zargon Oil and Gas
List of Organizations Mentioned in the Report
Alberta Energy Regulator
CASCO
CCC Leduc
Centre of Excellence in EOR (Malaysia)
Chemical EOR Alliance
Chinese EOR Laboratory
EOR Centre of Excellence (Oman)
EXPEC Advanced Research Center
FORCE (Forum for improved oil and gas recovery and improved exploration in Norway)
Government of Alberta
Government of Oman
Institute of Energy of South East Europe
Instituto Colombiano del Petróleo (ICP)
National Energy Technology Laboratory (NETL)
National Enhanced Oil Recovery Institute
Norwegian Government
Oil & Gas UK
OPEC
Petroleum Technology Research Centre
Research Partnership to Secure Energy for America (RPSEA)
RNZ Integrated
Saskatchewan Ministry of the Economy
Texas A&M University
U.S. Chamber of Commerce
UAE Oil Ministry
University of Kansas
University of Oklahoma
University of Wyoming
University of Wyoming Enhanced Oil Recovery Institute
US Department of Energy (DoE)
US EIA
World Bank
Download sample pages
Complete the form below to download your free sample pages for Chemical Enhanced Oil Recovery (EOR) Market Report 2020-2030Related reports
-
Thermal Enhanced Oil Recovery (EOR) Market Report 2020-2030
This market is expected to grow at a faster pace, owing to continuous work over oil fields, rapid depletion of...
Full DetailsPublished: 27 November 2019 -

Oilfield Crown Block Market Report 2020-2030
Forecasts by Type (Under 30T, 30T-100T, Above 100T), by Application (Onshore, Offshore), by Region (North America, Europe, Asia Pacific, Central...
Full DetailsPublished: 01 January 1970 -
Top 20 Enhanced Oil Recovery (EOR) Companies 2019
The leading 20 players in the EOR market comprise a broad range of companies, including the six supermajors, large state-owned,...Full DetailsPublished: 18 December 2018 -

Gas to Liquids (GTL) Market Forecast 2020-2030
Visiongain assesses that the Global Gas to Liquids (GTL) market was valued at $2,915 million in 2019, and it is...
Full DetailsPublished: 25 February 2020 -
Canadian Oil & Gas Market Report 2021-2035
Large proven oil & gas reserves of Canada coupled with growing investments in the building the country’s oil & gas...Full DetailsPublished: 25 January 2021 -

Oil & Gas Pipeline Leak Detection Market Report 2021-2031
The COVID-19 crisis has dramatically affected oil and gas production and demand, leaving no midstream markets untouched as drilling screeched...Full DetailsPublished: 28 October 2020 -

Pipeline & Process Services Market Report 2020-2030
In 2020 the global pipeline & process services market size is expected to value at USD 3,324.8 million and is...
Full DetailsPublished: 10 February 2020 -

Microbial Enhanced Oil Recovery Market Report 2020-2030
This latest report by business intelligence provider Visiongain assesses that Microbial Enhanced Oil Recovery Market spending will reach US$ 730...
Full DetailsPublished: 01 January 1970 -
Thermal Enhanced Oil Recovery (EOR) Market Report 2021-2031
In the coming decade, enhanced oil recovery strategies are set to be increasingly relevant in the international petroleum industry with...Full DetailsPublished: 26 April 2021 -
Carbon Capture, Transportation & Storage Market Report 2021-2031
Government funding initiatives are crucial to ensure that government GHG emissions reduction targets are translated into tangible CCS projects. Visiongain...Full DetailsPublished: 29 September 2020
Download sample pages
Complete the form below to download your free sample pages for Chemical Enhanced Oil Recovery (EOR) Market Report 2020-2030Do you have any custom requirements we can help you with?
Any specific country, geo region, market segment or specific company information?
Email us today, we can discuss your needs and see how we can help: jamie.roberts@visiongain.com
Would you like a free report overview of the report of your choice?
If so, please drop an email to Jamie Roberts stating your chosen report title to jamie.roberts@visiongain.com
Visiongain energy reports are compiled using a broad and rich mixture of both primary and secondary information to produce an overall industry outlook. In order to provide our clients with the best product possible product, we do not rely on any one single source of information. Visiongain analysts reach out to market-leading vendors and industry experts where possible but also review a wealth of financial data and product information from a vast range of sources. To find out more about our reports methodology, please email jamie.roberts@visiongain.com
Would you like to get the latest Visiongain energy reports catalogue?
What are the dynamic growth sectors? where are the regional business opportunities?
Which technologies will prevail and who are the leading companies succeeding in these sectors and why?
If you want definitive answers to business critical questions, discover Visiongain’s full range of business intelligence reports.
If so, please email Jamie Roberts on jamie.roberts@visiongain.com or call her today on +44 207 336 6100
“The Visiongain report was extremely insightful and helped us construct our basic go-to market strategy for our solution.”
H.
“F.B has used Visiongain to prepare two separate market studies on the ceramic proppants market over the last 12 months. These reports have been professionally researched and written and have assisted FBX greatly in developing its business strategy and investment plans.”
F.B
“We just received your very interesting report on the Energy Storage Technologies (EST) Market and this is a very impressive and useful document on that subject.”
I.E.N
“Visiongain does an outstanding job on putting the reports together and provides valuable insight at the right informative level for our needs. The EOR Visiongain report provided confirmation and market outlook data for EOR in MENA with the leading countries being Oman, Kuwait and eventually Saudi Arabia.”
E.S
“Visiongain produced a comprehensive, well-structured GTL Market report striking a good balance between scope and detail, global and local perspective, large and small industry segments. It is an informative forecast, useful for practitioners as a trusted and upto-date reference.”
Y.N Ltd
Association of Dutch Suppliers in the Oil & Gas Industry
Society of Naval Architects & Marine Engineers
Association of Diving Contractors
Association of Diving Contractors International
Associazione Imprese Subacquee Italiane
Australian Petroleum Production & Exploration Association
Brazilian Association of Offshore Support Companies
Brazilian Petroleum Institute
Canadian Energy Pipeline
Diving Medical Advisory Committee
European Diving Technology Committee
French Oil and Gas Industry Council
IMarEST – Institute of Marine Engineering, Science & Technology
International Association of Drilling Contractors
International Association of Geophysical Contractors
International Association of Oil & Gas Producers
International Chamber of Shipping
International Shipping Federation
International Marine Contractors Association
International Tanker Owners Pollution Federation
Leading Oil & Gas Industry Competitiveness
Maritime Energy Association
National Ocean Industries Association
Netherlands Oil and Gas Exploration and Production Association
NOF Energy
Norsk olje og gass Norwegian Oil and Gas Association
Offshore Contractors’ Association
Offshore Mechanical Handling Equipment Committee
Oil & Gas UK
Oil Companies International Marine Forum
Ontario Petroleum Institute
Organisation of the Petroleum Exporting Countries
Regional Association of Oil and Natural Gas Companies in Latin America and the Caribbean
Society for Underwater Technology
Society of Maritime Industries
Society of Petroleum Engineers
Society of Petroleum Enginners – Calgary
Step Change in Safety
Subsea UK
The East of England Energy Group
UK Petroleum Industry Association
All the events postponed due to COVID-19.
Latest Energy news
Visiongain Publishes Liquid Biofuels Market Report 2024-2034
The global Liquid Biofuels market was valued at US$90.7 billion in 2023 and is projected to grow at a CAGR of 6.7% during the forecast period 2024-2034.
03 April 2024
Visiongain Publishes Hydrogen Generation Market Report 2024-2034
The global Hydrogen Generation market was valued at US$162.3 billion in 2023 and is projected to grow at a CAGR of 3.7% during the forecast period 2024-2034.
28 March 2024
Visiongain Publishes Biofuel Industry Market Report 2024-2034
The global Biofuel Industry market was valued at US$123.2 billion in 2023 and is projected to grow at a CAGR of 7.6% during the forecast period 2024-2034.
27 March 2024
Visiongain Publishes Lithium-ion Battery Recycling Market Report 2024-2034
The global lithium-ion battery recycling market was valued at US$2.51 billion in 2023 and is projected to grow at a CAGR of 19.7% during the forecast period 2024-2034.
25 March 2024


