The latest report from business intelligence provider visiongain offers in Depth analysis of the global carbon dioxide (CO2) enhanced oil recovery (EOR) market. Visiongain evaluates CAPEX, including investments on anthropogenic carbon capture facilities and equipment for CO2 EOR at $3.73bn in 2017. The three biggest CO2 EOR markets in terms of CAPEX, the US, China and Canada, are set to grow at least twofold between 2017 and 2027.
How this report will benefit you
The 220-page report provides clear detailed insight into the global carbon dioxide (CO2) Enhanced Oil Recovery (EOR). In this brand new report you will find 168 in-Depth tables, charts and graphs plus an exclusive interview with CO2 SOLUTIONS – all unavailable elsewhere.
By ordering and reading our report today you will stay better informed and ready to act.
Report Deliverables
• Global market forecasts and analysis covering the period 2017 to 2027 in terms of CO2 EOR CAPEX ($m) and anthropogenic CO2 providers’ CAPEX ($m)
• Global market forecasts covering the period 2017 to 2027 in terms of CO2 EOR production (bpd) and anthropogenic CO2 supply (MMtpa)
• Submarket forecasts and analysis covering the period 2017 to 2027 in terms of total spending for the CO2 EOR cost components:
– CO2 sources,
– Pipelines
– Injection
• National market forecasts and analysis from 2017 to 2027 in terms of CO2 EOR CAPEX ($m) and anthropogenic CO2 providers’ CAPEX ($m) for the US, Canada, China, Brazil, the UAE, the UK, the rest of Europe and the rest of the world
• National market forecasts from 2017 to 2027 in terms of CO2 EOR production (bpd) and anthropogenic CO2 supply (MMtpa) for the US, China, Canada, Brazil, the UAE, the UK, the rest of Europe and the rest of the world
• US regional market forecasts and analysis from 2017 to 2027 in terms of CO2 EOR CAPEX ($m) and oil production (bpd) for the following regions –
– Gulf Coast
– Midcontinent
– Midwest
– Permian Basin
– Rockies
• Extensive details and analysis of all current and upcoming CO2 EOR projects currently taking place throughout the world detailing: name, company, gas source, start date, current oil production (bpd) and forecasted peak production between 2017 and 2027 (bpd)
• Details and analysis of all large-scale (>0.3 MMtpa of CO2) operating or planned CCS projects that have implications for CO2 EOR: location, companies, MMtpa capacity and operation date
• Extensive profiles and market share data for the top 10 major companies within the US CO2 EOR market
– Kinder Morgan
– Denbury Resources
– Hilcorp Energy Company
– Whiting Petroleum Corporation
– Occidental Petroleum Corporation
– Fleur de Lis Energy
– Linc Energy
– Hess Corporation
– Chaparral Energy Inc.
– Chevron
– PLUS profiles of major companies in the international market
• Full transcript of an exclusive visiongain interview with CO2 SOLUTIONS, a key opinion leader in the market
• PEST analysis of the major political, economic, social and technological aspects impacting the market
• Conclusions and recommendations
How will you benefit from this report?
• Enhance your strategic decision-making
• Assist with your research, presentations and business plans
• Show which emerging market opportunities to focus upon
• Increase your industry knowledge
• Keep you up to date with crucial market developments
• Allow you to develop informed growth strategies
• Build your technical insight
• Illustrate trends to exploit
• Strengthen your analysis of competitors
• Provide risk analysis helping you avoid the pitfalls other companies could make
• Ultimately, help you to maximise profitability for your company
Who should read this report?
• Oil companies and companies specialising in enhanced oil recovery (EOR)
• Anthropogenic CO2 suppliers and potential future anthropogenic CO2 suppliers such as power plants, natural gas processing units and other energy-intensive facilities
• Technology developers
• Heads of strategic development
• Marketing staff
• Market analysts
• Procurement staff & suppliers
• Investors & financial institutions
• Banks
• Governmental departments & agencies
Visiongain’s study is intended for anyone requiring commercial analysis for the carbon dioxide (CO2) Enhanced Oil Recovery (EOR) market and leading companies. You will find data, trends and predictions.
Buy our report today Carbon Dioxide (CO2) Enhanced Oil Recovery (EOR) Market 2017-2027: Production (bpd) & CAPEX ($m) Forecasts for CO2 Injection (featuring Miscible & Immiscible and Onshore & Offshore CO2 EOR Production); CAPEX ($m) Forecasts for CO2 Transmission Infrastructure (CO2 Pipeline Networks) and Naturally Occurring CO2 Sources; and Capacity (MMtpa) & CAPEX ($m) Forecasts for Anthropogenic Carbon Capture & Storage (CCS) for CO2 EOR. Avoid missing out by staying informed – get our report now.
Visiongain is a trading partner with the US Federal Government
CCR Ref number: KD4R6
1. Report Overview
1.1 Global Carbon Dioxide (CO2) Enhanced Oil Recovery (EOR) Market Overview
1.2 Market Structure Overview and Market Definition
1.3 Methodology
1.4 How This Report Delivers
1.5 Key Questions Answered by this Analytical Report Include:
1.6 Why You Should Read This Report
1.7 Frequently Asked Questions
1.8 Associated Visiongain Reports
1.9 About Visiongain
2. Introduction to the Carbon Dioxide Enhanced Oil Recovery Market
2.1 A Brief History of the CO2 EOR Industry
2.2 The Importance of Oil Prices
2.3 The Main Costs Involved in CO2 EOR Operations
2.4 Miscible and Immiscible EOR Methods
2.5 Where is CO2 Sourced From?
2.6 Advantages and Disadvantages of Using CO2 for EOR
2.7 Competition from Rival Technologies
2.8 Prospects for Offshore CO2 EOR
2.9 Environmental Issues Related to CO2 EOR Production
3. The Global Carbon Dioxide Enhanced Oil Recovery Market
3.1 The Global CO2 EOR Market Forecast 2017-2027
3.2 Drivers and Restraints in the CO2 EOR Market
3.2.1 Drivers in the CO2 EOR Market
3.2.1.1 Vast Geological Storage Potential in Oil Fields
3.2.1.2 Extensive Industry Experience with CO2 EOR
3.2.1.3 Billions of Barrels of Added Oil Yield
3.2.1.4 Many Fields Approaching Limit of Water Flood Recovery Potential
3.2.1.5 High Costs of Decommissioning Oil and Gas Infrastructure
3.2.1.6 Residual Oil Zones (ROZs)
3.2.1.7 Carbon Trading and Cost Reductions
3.2.2 Restraints in the CO2 EOR Market
3.2.2.1 Limited CO2 Availability
3.2.2.2 High Cost of Carbon Capture
3.2.2.3 Limited Financial Incentives to Invest
3.2.2.4 Tight Financing
3.2.2.5 Longer Return on Investment Period
3.2.2.6 CO2 Leakage and Environmental Issues
3.2.2.7 Limited or No Government Funding
3.2.2.8 Offshore Decommissioning and Well Abandonment
3.2.2.9 Poorly Conducted Onshore Decommissioning
3.3 Oil Prices and the CO2 EOR Market
3.3.1 Visiongain’s Description and Analysis of the Oil Price Fall
3.3.2 Supply-Side Factors
3.3.2.1 Tight Oil
3.3.2.2 OPEC
3.3.3 Demand-Side Factors
3.3.3.1 Chinese and Indian Growth
3.3.3.2 Western Stagnation
3.3.4 Other Major Variables that Impact the Oil Price
3.3.4.1 North Africa
3.3.4.2 Russia
3.3.4.3 Resilient U.S. Shale Industry
3.3.4.4 Iran
3.3.4.5 International Incidents
3.3.5 Visiongain’s Oil Price Assumptions and Forecast
3.4 CO2 EOR Breakeven Price Analysis
3.5 Barriers to Entry Analysis
4. Carbon Dioxide Enhanced Oil Recovery Submarket Forecasts 2017-2027
4.1 Read Which CO2 EOR Cost Component Will Provide the Strongest Growth
4.1.1 The CO2 Source CO2 EOR Submarket Forecast 2017-2027
4.1.1.1 CO2 Source Submarket Drivers and Restraints
4.1.1.2 Global CO2 Source Projects
4.1.2 The CO2 EOR Pipelines Submarket Forecast 2017-2027
4.1.2.1 CO2 Pipelines Submarket Drivers and Restraints
4.1.3 The CO2 EOR Injection Submarket Forecast 2017-2027
4.1.3.1 U.S. CO2 Injection Projects
4.1.3.2 Global CO2 Injection Projects
5. The Leading National CO2 EOR Market Forecasts 2017-2027
5.1 The U.S. CO2 EOR Market Forecast 2017-2027
5.1.1 History of CO2 EOR in the U.S.
5.1.2 Where are the CO2 EOR Projects in the U.S. Located?
5.1.3 Where is the CO2 Sourced From?
5.1.3.1 Anthropogenic CO2 Providers in the U.S.
5.1.3.2 Naturally Sourced CO2
5.1.4 U.S. Regional Submarkets
5.1.4.1 The Gulf Coast Regional Submarket Forecast 2017-2027
5.1.4.2 The Midcontinent Regional Submarket Forecast 2017-2027
5.1.4.3 The Midwest Regional Submarket Forecast 2017-2027
5.1.4.4 The Permian Basin Regional Submarket Forecast 2017-2027
5.1.4.5 The Rockies Regional Submarket Forecast 2017-2027
5.1.5 Drivers and Restraints in the U.S. CO2 EOR Market 2017-2027
5.1.5.1 The Importance of Government Support and Regulations
5.1.5.2 The Impact of Increasing Shale (Tight) Oil Production on the CO2 EOR Market
5.1.5.3 Offshore EOR Unlikely to come to Fruition
5.1.5.4 How is the U.S. CO2 EOR Market Likely to Develop over the Next Ten Years?
5.2 The Chinese CO2 EOR Market Forecast 2017-2027
5.2.1 A Brief History of EOR in China
5.2.2 Current Chinese CO2 EOR Projects
5.2.3 Anthropogenic CO2 Providers in China
5.2.4 Drivers and Restraints in the Chinese CO2 EOR Market 2017-2027
5.2.4.1 China’s High Emissions and the Need for More Oil
5.2.4.2 How Suitable is China’s Geology for CO2 EOR?
5.2.4.3 China’s Efforts to Form International Partnerships to Help Promote CO2 EOR
5.2.4.4 The Need for More Government Support for CO2 EOR
5.3 The Canadian CO2 EOR Market Forecast 2017-2027
5.3.1 Current and Upcoming Canadian CO2 EOR Projects
5.3.2 Anthropogenic CO2 Providers in Canada
5.3.3 Drivers and Restraints in the Canadian CO2 EOR Market 2017-2027
5.3.3.1 Construction on the Alberta Carbon Trunk Line Project is Underway
5.3.3.2 Despite the Abundance of Maturing Oil Fields, Too Many Pilot Projects Are Abandoned
5.3.3.3 High CO2 Costs Prohibiting Development
5.3.3.4 Shale Oil, Oil Sands and Competition from Other Technologies
5.4 The UAE CO2 EOR Market Forecast 2017-2027
5.4.1 Current and Upcoming UAE CO2 EOR Projects
5.4.2 Anthropogenic CO2 providers in the UAE
5.4.3 Drivers and Restraints in the UAE CO2 EOR Market 2017-2027
5.5 The Brazilian CO2 EOR Market Forecast 2017-2027
5.5.1 Current and Upcoming Brazilian CO2 EOR Projects
5.5.2 Anthropogenic CO2 Providers in Brazil
5.4.3 Drivers and Restraints in the Brazilian CO2 EOR Market 2017-2027
5.5.4 Prospects for the Lula CO2 EOR Project
5.5.5 Future Potential for Brazil’s CO2 EOR Market
5.6 The U.K. CO2 EOR Market Forecast 2017-2027
5.6.1 Drivers and Restraints in the U.K. CO2 EOR Market 2017-2027
5.6.1.1 Increasing Interest in North Sea CO2 EOR
5.6.1.2 Joint Research Ventures and Partnerships Attempting to Promote CO2 EOR in the U.K.
5.6.1.3 Lack of Financial Public Support and Damaged Investor Confidence
5.6.2 Why is CO2 EOR Developing So Slowly in the U.K.?
5.7 The Rest of Europe CO2 EOR Market Forecast 2017-2027
5.7.1 Drivers and Restraints in the Rest of Europe CO2 EOR Market
5.7.2 Why is Progress So Slow at Present?
5.7.3 CO2 EOR Prospects in the Netherlands and Denmark
5.7.4 Norway’s Long-Term CO2 EOR Potential
5.7.5 CO2 EOR Opportunities in Other European Countries
5.8 The Rest of the World CO2 EOR Market Forecast 2017-2027
5.8.1 CO2 EOR Projects and Potential in the Rest of the World
5.8.1.1 The Saudi-Arabian CO2 EOR Market
5.8.1.2 The Kuwaiti CO2 EOR Market
5.8.1.3 The Egyptian CO2 EOR Market
5.8.1.4 The Mexican CO2 EOR Market
5.8.1.5 The Trinidadian CO2 EOR Market
5.8.1.6 The Vietnamese CO2 EOR Market
5.8.1.7 The Malaysian CO2 EOR Market
6. PEST Analysis of the Carbon Dioxide Enhanced Oil Recovery Market 2017-2027
6.1 Political
6.2 Economic
6.3 Social
6.4 Technological
7. Expert Opinion
7.1 CO2 Solutions
7.1.1 CO2 Solutions’ Involvement in the CO2 EOR Market
7.1.2 Restraints on the Development of Anthropogenic CO2 Supply for EOR
7.1.3 Balance between the Use of Naturally Occurring and Anthropogenic CO2 for EOR
7.1.4 Potential for Further Cost Reductions and Technological Improvements in CCS technology
7.1.5 Key CO2 EOR Growth Markets over the Next Decade
7.1.6 The Role of Environmental Legislation in Fostering the Development of Anthropogenic CO2 Suppliers
8. The Leading Companies in the Carbon Dioxide Enhanced Oil Recovery Market
8.1 Top Ten Companies in the U.S. CO2 EOR Market
8.1.1 Kinder Morgan
8.1.2 Denbury Resources
8.1.3 Hilcorp Energy Company
8.1.4 Whiting Petroleum Corporation
8.1.5 Occidental Petroleum Corporation
8.1.6 Fleur de Lis Energy
8.1.7 Linc Energy
8.1.8 Hess Corporation
8.1.9 Chaparral Energy Inc.
8.1.10 Chevron
8.2 Major Companies in the International CO2 EOR Market
8.2.1 Apache Corporation
8.2.2 Cenovus Energy Inc.
8.2.3 China National Petroleum Corporation (CNPC)
8.2.4 Husky Energy
8.2.5 Masdar
8.2.6 Petroleo Brasileiro S.A. (Petrobras)
8.2.7 Sinopec
9. Conclusions and Recommendations
9.1 Key Findings
9.2 Recommendations
10. Glossary
List of Tables
Table 1.1 Leading National CO2 EOR Market Forecast 2017-2027 (Spending $m, AGR %)
Table 2.1 Advantages and Disadvantages of Using CO2 for EOR
Table 2.2 Shale Oil Reserves Top 10 Countries (billion bbls)
Table 3.1 Global CO2 EOR Market Forecast 2017-2027 ($m, AGR %, CAGR %, cumulative)
Table 3.2 Global CO2 EOR Oil Production & Anthropogenic CO2 Capture Capacity 2017-2027 (Mbpd, MMtpa)
Table 3.3 Drivers and Restraints in the CO2 EOR Market
Table 3.4 Visiongain’s Anticipated Brent Crude Oil Price, 2017, 2018, 2019-2021, 2022-2024, 2025-2027 ($/bbl)
Table 4.1 Global CO2 EOR Submarkets Forecast 2017-2027 ($m, AGR %, Cumulative)
Table 4.2 CO2 Source Submarket Forecast, 2017-2027 ($m, AGR %, CAGR %, Cumulative)
Table 4.3 CO2 Source Submarket Drivers and Restraints
Table 4.4 Operating & Planned Anthropogenic CO2 Provider Facilities in the U.S. (Location, Companies, MMtpa capacity, Operation Date and Clients)
Table 4.5 Operating & Planned Anthropogenic CO2 Providers Facilities Outside of the U.S. (Location, Companies, MMtpa Capacity and Operation Date)
Table 4.6 CO2 EOR Pipelines Forecast 2017-2027 ($m, AGR %, CAGR %, Cumulative)
Table 4.7 CO2 EOR Pipelines Submarket Drivers and Restraints
Table 4.8 CO2 EOR Injection Forecast 2017-2027 ($m, AGR %, CAGR %, Cumulative)
Table 4.9 Top Five U.S. CO2 EOR Projects (Company, Project, Region, Gas Source, bpd Production)
Table 4.10 Top Three Global CO2 EOR Projects (Company, Project, Country, Gas Source, bpd Production)
Table 5.1 Leading National CO2 EOR Markets Forecast 2017-2027 ($m, AGR %, Cumulative)
Table 5.2 U.S. CO2 EOR Market Forecast, Oil Producers vs. CO2 Providers 2017-2027, ($m, AGR %, CAGR%, Cumulative)
Table 5.3 U.S. CO2 EOR Oil Production & Anthropogenic CO2 Capture Capacity 2017-2027 (Mbpd, MMtpa, AGR %, Cumulative)
Table 5.4 U.S. Regional Submarkets (Name, Location, Number of CO2 EOR Projects)
Table 5.5 Operating & Planned Anthropogenic CO2 Providers Facilities in the U.S. (Location, Companies, MMtpa Capacity, Operation Date and Clients)
Table 5.6 U.S. CO2 EOR Oil Production & CAPEX 2017-2027 (Mbpd, $ million, AGR %, Cumulative)
Table 5.7 Gulf Coast CO2 EOR Forecast 2017-2027 (Mbpd, $m, AGR %, CAGR %, Cumulative)
Table 5.8 Operational & Planned Gulf Coast CO2 EOR Projects (Name, Company, Gas Source, Start Date, bpd Production 2016 and bpd Peak Production)
Table 5.9 Midcontinent CO2 EOR Forecast 2017-2027 (Mbpd, $m, AGR %, CAGR %, Cumulative)
Table 5.10 Operational & Planned Midcontinent CO2 EOR Projects (Name, Company, Gas Source, Start Date, bpd Production 2016 and bpd Peak Production)
Table 5.11 Midwest Submarket CO2 EOR Forecast 2017-2027 (Mbpd, $m, AGR %, CAGR %, Cumulative)
Table 5.12 Operational & Planned Midwest CO2 EOR Projects (Name, Company, Gas Source, Start Date, bpd Production 2016 and bpd Peak Production)
Table 5.13 Permian Basin CO2 EOR Forecast 2017-2027 (Mbpd, $m, AGR %, CAGR %, Cumulative)
Table 5.14 Operational & Planned Permian Basin CO2 EOR Projects (Name, Company, Gas Source, Start Date, bpd Production 2017 and bpd Peak Production)
Table 5.15 Rockies CO2 EOR Forecast 2017-2027 (Mbpd, $m, AGR %, CAGR %, Cumulative)
Table 5.16 Operational & Planned Rockies CO2 EOR Projects (Name, Company, Gas Source, Start Date, bpd Production 2016 and bpd Peak Production)
Table 5.17 Drivers and Restraints in the U.S. CO2 EOR Market
Table 5.18 15 Largest Companies in CO2 EOR (Production) and Shale (Tight) Oil in 2015 (CAPEX)
Table 5.19 Chinese CO2 EOR Forecast 2017-2027 ($m, AGR %, CAGR%, Cumulative)
Table 5.20 Chinese CO2 EOR Oil Production & Anthropogenic CO2 Capture Capacity 2017-2027 (Mbpd, MMtpa, Cumulative)
Table 5.21 Operating & Planned Anthropogenic CO2 Provider Facilities in China (Location, Companies, MMtpa Capacity and Operation Date)
Table 5.22 Drivers and Restraints in the Chinese CO2 EOR Market
Table 5.23 Canadian CO2 EOR Spending Forecast 2017-2027 ($m, AGR %, CAGR%, Cumulative)
Table 5.24 Canadian CO2 EOR Oil Production & Anthropogenic CO2 Capture Capacity 2017-2027 (Mbpd, MMtpa, AGR %, Cumulative)
Table 5.25 Operational & Planned Canadian CO2 EOR Projects (Name, Company, Gas Source, Start Date, bpd Production 2016 and bpd Peak Production)
Table 5.26 Operating & Planned Anthropogenic CO2 Providers Facilities in Canada (Location, Companies, MMtpa Capacity, Operation Date and Clients)
Table 5.27 Drivers and Restraints in the Canadian CO2 EOR Market
Table 5.28 Canadian CO2 EOR Pilots (Project Name, Operator, Operational Dates, bbls Total Oil Production)
Table 5.29 UAE CO2 EOR Spending Forecast 2017-2027 ($m, AGR %, CAGR%, Cumulative)
Table 5.30 UAE CO2 EOR Oil Production & Anthropogenic CO2 Capture Capacity 2017-2027 (Mbpd, MMtpa, AGR %, Cumulative)
Table 5.31 Operational & Planned UAE CO2 EOR Projects (Name, Company, Gas Source, Start Date, bpd Production 2016 and bpd Peak Production)
Table 5.32 Operating & Planned Anthropogenic CO2 Provider Facilities in the UAE (Location, Companies, Capacity (MMtpa), Operation date and Clients)
Table 5.33 Drivers and Restraints in the UAE CO2 EOR Market
Table 5.34 Brazilian CO2 EOR Spending Forecast 2017-2027 ($m, AGR %, CAGR%, Cumulative)
Table 5.35 Brazilian CO2 EOR Oil Production & Anthropogenic Carbon Capture Capacity 2017-2027 (Mbpd, MMtpa, AGR %, Cumulative)
Table 5.36 Operational & Planned Brazilian CO2 EOR Projects (Name, Company, Gas Source, Start Date, bpd Production 2016 and bpd Peak Production)
Table 5.37 Operating & Planned Anthropogenic CO2 Providers Facilities in Brazil (Location, Companies, MMtpa Capacity, Operation Date and Clients)
Table 5.38 Drivers and Restraints in the Brazilian CO2 EOR Market
Table 5.39 U.K. CO2 EOR Spending Forecast 2017-2027 ($m, AGR %, CAGR%, Cumulative)
Table 5.40 U.K. CO2 EOR Oil Production & Anthropogenic CO2 Capture Capacity 2017-2027 (Mbpd, MMtpa, AGR %, Cumulative)
Table 5.41 Drivers and Restraints in the U.K. CO2 EOR Market
Table 5.42 Rest of Europe CO2 EOR Spending Forecast 2017-2027 ($m, AGR %, CAGR%, Cumulative
Table 5.43 The Rest of Europe CO2 EOR Oil Production & Anthropogenic CO2 Capture Capacity 2017-2027 (Mbpd, MMtpa, AGR %, Cumulative)
Table 5.44 Drivers and Restraints in the Rest of Europe CO2 EOR Market
Table 5.45 Rest of the World CO2 EOR Spending Forecast 2017-2027 ($m, AGR %, CAGR%, Cumulative)
Table 5.46 The Rest of the World CO2 EOR Oil Production & Anthropogenic Carbon Capture Capacity (Mbpd, MMtpa, AGR %, Cumulative)
Table 8.1 The Ten Leading Companies in the U.S. CO2 EOR Market 2016 (Rank, Spending $m, Market Share %)
Table 8.2 The Ten Leading Companies in the U.S. CO2 EOR Market 2016 (Rank, bpd Production, Market Share %)
Table 8.3 The Seven Leading Companies in the U.S. CO2 EOR Market 2016 (Rank, Number of Active Projects)
Table 8.4 Kinder Morgan Overview: Headquarters, Employees, Stock Exchange, Number of Projects, 2015 CO2 Source Pipeline and Injection Spending ($m), Total CO2 EOR Spending ($m) and Market Share (%), Total CO2 EOR bpd Production and Market Share (%), Market Rank
Table 8.5 Denbury Resources Overview: Headquarters, Employees, Stock Exchange, Number of Projects, 2016 CO2 Source Pipeline and Injection Spending ($m), Total CO2 EOR Spending ($m) and Market Share (%), Total CO2 EOR bpd Production and Market Share (%), Market Rank
Table 8.6 Hilcorp Energy Overview: Headquarters, Employees, Stock Exchange, Number of Projects, 2016 CO2 Source Pipeline and Injection Spending ($m), Total CO2 EOR Spending ($m) and Market Share (%), Total CO2 EOR bpd Production and Market Share (%), Market Rank
Table 8.7 Whiting Petroleum Overview: Headquarters, Employees, Stock Exchange, Number of Projects, 2015 CO2 Source Pipeline and Injection Spending ($m), Total CO2 EOR Spending ($m) and Market Share (%), Total CO2 EOR bpd Production and Market Share (%), Market Rank
Table 8.8 Occidental Overview: Headquarters, Employees, Stock Exchange, Number of Projects, 2016 CO2 Source Pipeline and Injection Spending ($m), Total CO2 EOR Spending ($m) and Market Share (%), Total CO2 EOR bpd Production and Market Share (%), Market Rank
Table 8.9 Fleur de Lis Energy Overview: Headquarters, Employees, Stock Exchange, Number of Projects, 2015 CO2 Source Pipeline and Injection Spending ($m), Total CO2 EOR Spending ($m) and Market Share (%), Total CO2 EOR bpd Production and Market Share (%), Market Rank
Table 8.10 Linc Energy Overview: Headquarters, Employees, Stock Exchange, Number of Projects, 2016 CO2 Source Pipeline and Injection Spending ($m), Total CO2 EOR Spending ($m) and Market Share (%), Total CO2 EOR bpd Production and Market Share (%), Market Rank
Table 8.11 Hess Overview: Headquarters, Employees, Stock Exchange, Number of Projects, 2016 CO2 Source Pipeline and Injection Spending ($m), Total CO2 EOR Spending ($m) and Market Share (%), Total CO2 EOR bpd Production and Market Share (%), Market Rank
Table 8.12 Chaparral Energy Overview: Headquarters, Employees, Stock Exchange, Number of Projects, 2016 CO2 Source Pipeline and Injection Spending ($m), Total CO2 EOR Spending ($m) and Market Share (%), Total CO2 EOR bpd Production and Market Share (%), Market Rank
Table 8.13 Chevron Overview: Headquarters, Employees, Stock Exchange, Number of Projects, 2016 CO2 Source Pipeline and Injection Spending ($m), Total CO2 EOR Spending ($m) and Market Share (%), Total CO2 EOR bpd Production and Market Share (%), Market Rank
Table 9.1 Global CO2 EOR Market Forecast 2017-2027 ($m, AGR %, CAGR%, Cumulative)
Table 9.2 Leading National CO2 EOR Markets Forecast 2017-2027 ($m, AGR %, Cumulative)
Table 9.3 Global CO2 EOR Submarkets Forecast 2017-2027 ($m, AGR %, Cumulative)
List of Figures
Figure 1.1 Global CO2 EOR Market Structure Overview
Figure 2.1 Regional Carbon Dioxide Emissions from Energy Consumption 2003-2015 (Million Tonnes)
Figure 3.1 Global CO2 EOR Market Forecast 2017-2027 ($m, AGR %)
Figure 3.2 Global CO2 EOR Oil Production & Anthropogenic CO2 Capture Capacity 2017-2027 (Mbpd, MMtpa)
Figure 3.3 WTI and Brent Oil Prices 2004-2016 ($/bbl)
Figure 3.4 Weekly WTI and Brent Oil Prices January 2014 – Apr 2017 ($/bbl)
Figure 3.5 U.S. Crude Oil Production from Different Sources, 2002-2016 (MMbpd)
Figure 3.6 Chinese and Indian Annual GDP Growth 2006-2017 (%)
Figure 3.7 U.S. Refined Product Consumption January 2015 to July 2016 Four-Week Average (Mbpd)
Figure 3.8 Visiongain’s Anticipated Brent Crude Oil Price, 2017, 2018, 2019-2021, 2022-2024, 2025-2027 ($/bbl)
Figure 3.9 U.S. CO2 EOR production and Crude Oil Prices, 1987-2015 (bpd, 2015$/bbl)
Figure 3.10 Visiongain’s Assumed Brent Oil Price, Breakeven Ranges for Existing and New CO2 EOR Projects ($/bbl 2017, 2018, 2019-2021, 2022-2025, 2025-2027)
Figure 3.11 Barriers to Entry vs. National Market Size vs. CAGR 2017-2027 ($m, CAGR %)
Figure 4.1 CO2 EOR Submarkets Share Forecast, 2017 (%)
Figure 4.2 CO2 EOR Submarkets Share Forecast, 2022 (%)
Figure 4.3 CO2 EOR Submarkets Share Forecast, 2027 (%)
Figure 4.4 CO2 EOR Submarkets Forecast 2017-2027 (Spending $m)
Figure 4.5 CO2 EOR Submarket Cumulative Spending Share Forecast, 2017-2027 ($m)
Figure 4.6 CO2 Source Submarket Forecast, 2017-2027 ($m, AGR %)
Figure 4.7 CO2 EOR Sources Market Share Forecast 2017, 2022 and 2027 (% Share)
Figure 4.8 CO2 EOR Pipelines Forecast 2017-2027 ($m, AGR %)
Figure 4.9 CO2 EOR Pipelines Market Share Forecast 2017, 2022 and 2027 (% Share)
Figure 4.10 CO2 EOR Injection Forecast 2017-2027 ($m, AGR %)
Figure 4.11 CO2 EOR Injection Market Share Forecast 2017, 2022 and 2027 (% Share)Figure 5.1 Leading National CO2 EOR Markets Forecast 2017-2027 ($m)
Figure 5.1 Leading National CO2 EOR Markets Forecast 2017-2027 ($m)
Figure 5.2 Leading National CO2 EOR Markets Share Forecast, 2017 (%)
Figure 5.3 Leading National CO2 EOR Markets Share Forecast, 2022 (%)
Figure 5.4 Leading National CO2 EOR Markets Share Forecast, 2027 (%)
Figure 5.5 National CO2 EOR Spending Forecast 2017-2027 ($m)
Figure 5.6 Leading National CO2 EOR Markets Cumulative Total Spending 2017-2027 ($m)
Figure 5.7 Leading National CO2 EOR Markets Share Change 2017-2027 (%)
Figure 5.8 U.S. CO2 EOR Market Forecast 2017-2027, Oil Producers vs. CO2 Providers ($m, AGR %)
Figure 5.9 U.S. CO2 EOR Market Share Forecast 2017, 2022 and 2027 (%)
Figure 5.10 U.S. CO2 EOR Oil Production & Anthropogenic CO2 Capture Capacity 2017-2027 (Mbpd, MMtpa)
Figure 5.11 Historical U.S. CO2 EOR Production, 1986-2016 (bpd)
Figure 5.12 Location of U.S. Carbon Dioxide Enhanced Oil Recovery Projects, Carbon Dioxide Sources and Carbon Dioxide Pipelines
Figure 5.13 Naturally Occurring CO2 Production in the U.S. (MMscfd)
Figure 5.14 Naturally Occurring CO2 Proven Reserves in the U.S. (Bscf)
Figure 5.15 U.S. Regional Submarket Forecasts, CO2 EOR Spending, 2017-2027 ($m)
Figure 5.16 U.S. Regional Submarket- CO2 EOR Spending Share Forecast 2017-2027 ($m)
Figure 5.17 U.S. Regional Submarket CO2 EOR Spending Share, 2017 (%)
Figure 5.18 U.S. Regional Submarket CO2 EOR Spending Share, 2022 (%)
Figure 5.19 U.S. Regional Submarket CO2 EOR Spending Share, 2027 (%)
Figure 5.20 U.S. Regional Submarket CO2 EOR Spending Forecast 2017-2027 ($m)
Figure 5.21 Gulf Coast CO2 EOR Spending Forecast 2017-2027 ($m, AGR %)
Figure 5.22 Gulf Coast CO2 EOR Spending Market Share Forecast 2017, 2022 and 2027 (% Share)
Figure 5.23 Gulf Coast CO2 EOR Production Forecast 2017-2027 (Mbpd, AGR %)
Figure 5.24 Midcontinent CO2 EOR Spending Forecast 2017-2027 ($m, AGR %)
Figure 5.25 Midcontinent CO2 EOR Spending Share Forecast 2017, 2022 and 2027 (% Share)
Figure 5.26 Midcontinent CO2 EOR Production Forecast 2017-2027 (Mbpd, AGR %)
Figure 5.27 Midwest CO2 EOR Spending Forecast 2017-2027 ($m, AGR %)
Figure 5.28 Midwest CO2 EOR Spending Share Forecast 2017, 2022 and 2027 (% Share)
Figure 5.29 Midwest CO2 EOR Production Forecast 2017-2027 (Mbpd, AGR %)
Figure 5.30 Permian Basin CO2 EOR Spending Forecast 2017-2027 ($m, AGR %)
Figure 5.31 Permian Basin CO2 EOR Spending Share Forecast 2017, 2022 and 2027 (% Share)
Figure 5.32 Permian Basin CO2 EOR Production Forecast 2017-2027 (Mbpd, AGR %)
Figure 5.32 Midwest Production Forecast 2017-2027 (Mbpd, AGR %)
Figure 5.33 Rockies CO2 EOR Spending Forecast 2017-2027 ($m, AGR %)
Figure 5.34 Rockies CO2 EOR Spending Share Forecast 2017, 2022 and 2027 (% Share)
Figure 5.35 Rockies CO2 EOR Production Forecast 2017-2027 (Mbpd, AGR %)
Figure 5.36 Historical U.S. Crude Oil Production, CO2 EOR Production, and CO2 EOR Production as a Percentage of Crude Oil Production, 1986-2015 (bpd, %)
Figure 5.37 U.S. CO2 EOR Production Forecast 2017-2027
Figure 5.38 Chinese CO2 EOR Spending Forecast 2017-2027 ($m, AGR%)
Figure 5.39 Chinese CO2 EOR Spending Share Forecast 2017, 2022 and 2027 ($m, AGR %)
Figure 5.40 Chinese CO2 EOR Oil Production & Anthropogenic CO2 Capture Capacity 2017-2027 (Mbpd, MMtpa)
Figure 5.41 Canadian CO2 EOR Spending Forecast 2017-2027 ($m, AGR %)
Figure 5.42 Canadian CO2 EOR Spending Share Forecast 2017, 2022 and 2027 ($m, AGR %)
Figure 5.43 Canadian CO2 EOR Oil Production & Anthropogenic CO2 Capture Capacity 2017-2027 (Mbpd, MMtpa)
Figure 5.44 Illustration of the ACTL Project
Figure 5.45 UAE CO2 EOR Spending Share Forecast 2017- 2027 ($m, AGR %)
Figure 5.46 UAE CO2 EOR Spending Share Forecast 2017, 2022 and 2027 ($m, AGR %)
Figure 5.47 UAE CO2 EOR Oil Production & Anthropogenic CO2 Capture Capacity 2017-2027 (Mbpd, MMtpa)
Figure 5.48 Brazilian CO2 EOR Spending Forecast 2017-2027 ($m, AGR%)
Figure 5.49 Brazilian CO2 EOR Spending Share Forecast 2017, 2022 and 2027 (%)
Figure 5.50 Brazilian CO2 EOR Oil Production & Anthropogenic CO2 Capture Capacity 2017-2027 (Mbpd, MMtpa)
Figure 5.51 U.K. CO2 EOR Spending Forecast 2017-2027 ($m, AGR %)
Figure 5.52 U.K. CO2 EOR Spending Share Forecast 2017, 2022 and 2027 (%)
Figure 5.53 U.K. CO2 EOR Oil Production & Anthropogenic CO2 Capture Capacity 2017-2027 (Mbpd, MMtpa)
Figure 5.54 Rest of Europe CO2 EOR Spending Forecast 2017-2027 ($m, AGR %)
Figure 5.55 Rest of Europe CO2 EOR Spending Share Forecast 2017, 2022 and 2027 ($m, AGR %)
Figure 5.56 The Rest of Europe CO2 EOR Oil Production & Anthropogenic CO2 Capture Capacity 2017-2027 (Mbpd, MMtpa)
Figure 5.57 Oil Production in the Leading Five European Countries 2003-2015 (Mbpd)
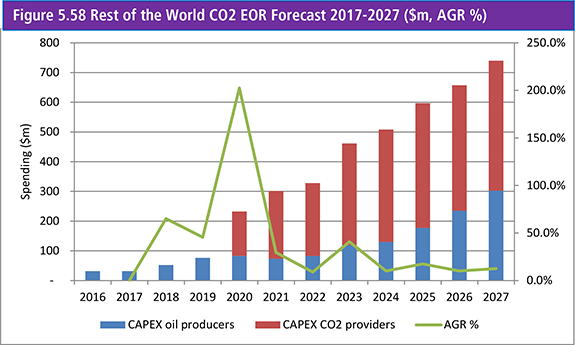
Figure 5.58 Rest of the World CO2 EOR Spending Forecast 2017-2027 ($m, AGR %)
Figure 5.59 Rest of the World CO2 EOR Spending Share Forecast 2017, 2022 and 2027 ($m, AGR %)
Figure 5.60 The Rest of the World CO2 EOR Oil Production & Anthropogenic Carbon Capture Capacity (Mbpd, MMtpa)
Figure 8.1 The Ten Leading Companies in the U.S. CO2 EOR Market 2016 (Spending $m)
Figure 8.2 The Ten Leading Companies in the U.S. CO2 EOR Market 2016 (Market Share %)
Figure 8.3 The Ten Leading Companies in the U.S. CO2 EOR Market 2016 (bpd Production)
Figure 8.4 The Seven Leading Companies in the U.S. CO2 EOR Market 2016 (Number of Active Projects)

