Industries > Energy > Oil & Gas Automation & Control (A&C) Systems: World Market 2019-2029
Oil & Gas Automation & Control (A&C) Systems: World Market 2019-2029
Revenue Forecasts ($bn) by Technology (Distributed Control System (DCS); Programmable Logic Controller (PLC); Safety Instrumented Systems (SIS); Supervisory Control and Data Acquisition (SCADA); Manufacturing Executing System (MES)) & by Sector (Offshore, Onshore) and (Upstream; Midstream; Downstream); Providing Analysis Across Leading Regional Markets (North America, Europe, Asia-Pacific, Latin America, Middle East & Africa
The latest report from business intelligence provider visiongain offers in depth analysis of the oil & gas automation & control (A&C) systems market. Visiongain assesses that the oil & gas automation & control (A&C) market will generate revenues of $25.31 bn in 2019.
How this report will benefit you
Read on to discover how you can exploit the future business opportunities emerging in this sector. Visiongain’s new study tells you and tells you now.
The 234-page report provides clear detailed insight into the global oil & gas automation & control (A&C) systems market. Discover the key drivers and challenges affecting the market. In this brand new report, you find 239 in-depth tables, charts and graphs – all unavailable elsewhere.
By ordering and reading our brand new report today you stay better informed and ready to act.
Report Scope
• Global oil & gas automation & control systems market forecasts from 2019-2029
• 239 tables, charts, and graphs examining the oil & gas automation & control systems market
• Forecasts for 6 oil & gas automation & control systems by technology –
– Distributed Control System (DCS)
– Programmable Logic Controller (PLC)
– Safety Instrumented System (SIS)
– Supervisory Control and Data Acquisition (SCADA)
– Manufacturing Execution System (MES)
– Other systems.
• Forecasts for oil & gas automation & control systems sectors –
– Upstream,
– Midstream
– Downstream
– Onshore
– Offshore
• Forecasts for 5 regional and 14 national oil & gas automation & control systems markets from 2019-2029 including
North America
– US
– Canada
– Rest of North America
Europe
– UK
– Spain
– Italy
– Germany
– Others
Asia-Pacific
– China
– India
– Japan
– Australasia
– Rest of Asia Pacific
South America
– Brazil
– Argentina
– Rest of South America
Middle East & Africa
– GCC Countries
– South Africa
– Rest of Middle East and Africa
• Profiles of the leading 12 companies within the oil & gas automation & control systems industry
– ABB Ltd.
– Honeywell International
– Siemens AG.
– Schneider Electric
– Mitsubishi Electric Corporation
– Rockwell Automation
– Emerson Electric Company
– Danaher Corporation
– Cameron International Corporation
– Texas Instruments
– Yokogawa Electric Corp.
– General Electric
• A PEST analysis of the political, economic, social and technological factors affecting the market.
The report delivers considerable added value by answering the following questions
• How is the automation and control systems market within the oil and gas industry evolving?
• What is driving and restraining the automation and control systems market within the oil and gas industry? What are the market dynamics?
• What are the market shares of each automation and control technology in 2019, 2024 and 2029?
• Which individual technologies will prevail and how will these shifts be responded to?
• What is the market share of sales for each region for automation and control systems in the oil and gas industry and how will it evolve between 2019 and 2029?
• What will the sales by sector (up, mid or downstream) of automation and control systems in the oil and gas industry between 2019 and 2029?
• Who are the leading companies in this market?
• What restraints to the growth of automation and control systems sales are there in the oil and gas industry?
• What drivers of growth of automation and control systems sales are there in the oil and gas industry?
• Conclusions and recommendations which will aid decision-making
Who should read this report?
• Anyone within the oil & gas automation & control systems market value chain.
• Oil & gas supermajors
• Engineering companies
• Oilfield service providers
• Manufacturers of DCS, PLC, SIS, SCADA or MES systems
• Operators of offshore and onshore oil & gas fields;
• Companies specialising in enhanced oil recovery (EOR)
• Oil & gas analysts
• Business development managers
• Marketing managers
• Technologists
• Suppliers
• Investors
• Banks
• Government agencies
• Contractors
Visiongain’s study is intended for anyone requiring commercial analyses for the oil & gas A&C systems market and leading companies. You find data, trends and predictions.
Buy our report today Oil & Gas Automation & Control (A&C) Systems: World Market 2019-2029. Avoid missing out by staying informed – get our report now.
Visiongain is a trading partner with the US Federal Government
CCR Ref number: KD4R6
Do you have any custom requirements we can help you with? Any need for specific country, geo region, market segment or specific company information? Contact us today, we can discuss your needs and see how we can help: sara.peerun@visiongain.com
1.1 Global Oil & Gas Automation & Control (A&C) Systems Market Overview
1.2 Why You Should Read This Report
1.3 How This Report Delivers
1.4 Key Questions Answered by This Analytical Report
1.5 Who is this Report for?
1.6 Methodology
1.6.1 Primary Research
1.6.2 Secondary Research
1.6.3 Market Evaluation & Forecasting Methodology
1.7 Frequently Asked Questions (FAQ)
1.8 Associated Visiongain Reports
1.9 About Visiongain
2. Introduction to the Oil & Gas Automation & Control Systems Market
2.1 The Oil & Gas Automation & Control Systems Market Structure Overview
2.2 An Introduction to the Key Oil & Gas Automation & Control Technologies
2.2.1 Overview of a Typical System
2.2.2 Distributed Control System (DCS)
2.2.3 Supervisory Control and Data Acquisition (SCADA) System
2.2.4 SCADA vs DCS: A Comparison
2.2.5 Programmable Logic Controller (PLC)
2.2.6 Manufacturing Execution System (MES)
2.2.7 Safety Instrumented System (SIS)
2.2.8 Other Oil & Gas Automation & Control Technologies
2.2.8.1 Programmable Automation Controller (PAC)
2.2.8.2 Remote Terminal Unit (RTU)
2.2.8.3 Human Machine Interface (HMI)
2.2.8.4 Real-Time Optimisation & Simulation (RTOS)
2.2.8.5 Wireless Transmitters
3. The Global Oil & Gas Automation & Control Systems Market 2019-2029
3.1 Global Oil & Gas Automation & Control Systems Market Forecast 2019-2029
3.2 Global Oil & Gas Automation & Control Systems Market Drivers
3.2.1 Need to Reduce Production Costs due to Lower Oil Prices
3.2.2 Rising Demand for Oil & Gas Globally
3.2.3 Increasing Emphasis on Safety & Security in Oil & Gas Market
3.3 Global Oil & Gas Automation & Control Systems Market Restraints
3.3.1 Sluggish Growth in Developed Markets: A Cause of Unrest Among the Western Suppliers
3.3.2 Dearth in Talent: The Most Neglected Market Impediment for Oil & Gas Automation
3.3.3 Reliability Issues with Cloud Computing Escalating the Scepticism Levels
3.3.4 Saturated CAPEX in North America and Europe Set to Disturb the Pecking Order of the Automation Geographic Penetration
4. PEST Analysis of the Oil & Gas Automation & Control Systems Market 2019-2029
4.1 Political, Economic, Social and Technological Analysis of the Oil & Gas Automation & Control Systems Market
5. Global Oil & Gas Automation & Control (A&C) Systems Submarket Forecasts 2019-2029
5.1 Global Oil & Gas Automation & Control (A&C) Systems Market Forecast by Technology 2019-2029
5.2 Global Oil & Gas Automation & Control (A&C) Systems Market Forecast by Application 2019-2029
5.3 Global Oil & Gas Automation & Control (A&C) Systems Market Forecast by Upstream Application 2019-2029
5.4 Global Oil & Gas Automation & Control (A&C) Systems Market Forecast by Geography 2019-2029
6. North America Oil & Gas Automation & Control (A&C) Systems Market Analysis and Forecast 2019-2029
6.1 North America Oil & Gas Automation & Control (A&C) Systems Market Forecast by Technology 2019-2029
6.2 North America Oil & Gas Automation & Control (A&C) Systems Market Forecast by Application 2019 – 2029
6.3 North America Oil & Gas Automation & Control (A&C) Systems Market Analysis by Upstream Application 2019-2029
6.4 North America Oil & Gas Automation & Control (A&C) Systems Market Forecast by Country 2019-2029
6.4.1 U.S. Oil & Gas Automation & Control (A&C) Systems Market Forecast 2019-2029
6.4.2 Canada Oil & Gas Automation & Control (A&C) Systems Market Forecast 2019-2029
6.4.3 Rest of North America Oil & Gas Automation & Control (A&C) Systems Market Forecast 2019-2029
7. Europe Oil & Gas Automation & Control (A&C) Systems Market Analysis and Forecast 2019- 2029
7.1 Europe Oil & Gas Automation & Control (A&C) Systems Market Forecast by Technology 2019-2029
7.2 Europe Oil & Gas Automation & Control (A&C) Systems Market Forecast by Application 2019 – 2029
7.3 Europe Oil & Gas Automation & Control (A&C) Systems Market Analysis by Upstream Application 2019-2029
7.4 Europe Oil & Gas Automation & Control (A&C) Systems Market Forecast by Country 2019-2029
7.4.1 U.K. Oil & Gas Automation & Control (A&C) Systems Market Forecast 2019-2029
7.4.2 Spain Oil & Gas Automation & Control (A&C) Systems Market Forecast 2019-2029
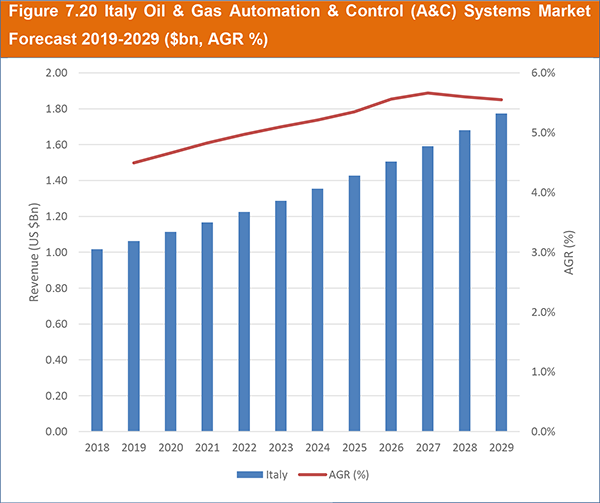
7.4.3 Italy Oil & Gas Automation & Control (A&C) Systems Market Forecast 2019-2029
7.4.4 Germany Oil & Gas Automation & Control (A&C) Systems Market Forecast 2019-2029
7.4.5 Rest of Europe Oil & Gas Automation & Control (A&C) Systems Market Forecast 2019-2029
8. Asia Pacific Oil & Gas Automation & Control (A&C) Systems Market Analysis and Forecast 2019-2029
8.1 Asia Pacific Oil & Gas Automation & Control (A&C) Systems Market Forecast by Technology 2019-2029
8.2 Asia Pacific Oil & Gas Automation & Control (A&C) Systems Market Forecast by Application 2019 – 2029
8.3 Asia Pacific Oil & Gas Automation & Control (A&C) Systems Market Analysis by Upstream Application 2019-2029
8.4 Asia Pacific Oil & Gas Automation & Control (A&C) Systems Market Forecast by Country 2019-2029
8.4.1 China Oil & Gas Automation & Control (A&C) Systems Market Forecast 2019-2029
8.4.2 Japan Oil & Gas Automation & Control (A&C) Systems Market Forecast 2019-2029
8.4.3 India Oil & Gas Automation & Control (A&C) Systems Market Forecast 2019-2029
8.4.4 Australasia Oil & Gas Automation & Control (A&C) Systems Market Forecast 2019-2029
8.4.5 Rest of Asia Pacific Oil & Gas Automation & Control (A&C) Systems Market Forecast 2019-2029
9. Middle East and Africa Oil & Gas Automation & Control (A&C) Systems Market Analysis and Forecast 2019 - 2029
9.1 Middle East and Africa Oil & Gas Automation & Control (A&C) Systems Market Forecast by Technology 2019-2029
9.2 Middle East and Africa Oil & Gas Automation & Control (A&C) Systems Market Forecast by Application 2019 – 2029
9.3 Middle East and Africa Oil & Gas Automation & Control (A&C) Systems Market Analysis by Upstream Application 2019-2029
9.4 Middle East and Africa Oil & Gas Automation & Control (A&C) Systems Market Forecast by Country 2019-2029
9.4.1 GCC Countries Oil & Gas Automation & Control (A&C) Systems Market Forecast 2019-2029
9.4.2 South Africa Oil & Gas Automation & Control (A&C) Systems Market Forecast 2019-2029
9.4.3 Rest of MEA Oil & Gas Automation & Control (A&C) Systems Market Forecast 2019-2029
10. South America Oil & Gas Automation & Control (A&C) Systems Market Analysis and Forecast 2019-2029
10.1 South America Oil & Gas Automation & Control (A&C) Systems Market Forecast by Technology 2019-2029
10.2 South America Oil & Gas Automation & Control (A&C) Systems Market Forecast by Application 2019 – 2029
10.3 South America Oil & Gas Automation & Control (A&C) Systems Market Analysis by Upstream Application 2019-2029
10.4 South America Oil & Gas Automation & Control (A&C) Systems Market Forecast by Country 2019-2029
10.4.1 Brazil Oil & Gas Automation & Control (A&C) Systems Market Forecast 2019-2029
10.4.2 Argentina Oil & Gas Automation & Control (A&C) Systems Market Forecast 2019-2029
10.4.3 Rest of South America Oil & Gas Automation & Control (A&C) Systems Market Forecast 2019-2029
11. Leading Companies in the Oil & Gas Automation & Control Systems Market
11.1 ABB Ltd.
11.1.1 ABB Ltd. Business Overview
11.1.2 ABB Ltd. Financial
11.1.2.1 ABB Ltd. Segment Overview
11.1.3 ABB Ltd. Products and Services
11.1.4 ABB Ltd. Recent Developments, Contracts and Agreements
11.1.5 ABB Ltd. SWOT Analysis
11.2 Danaher Corporation
11.2.1 Danaher Corporation Company Overview
11.2.2 Danaher Corporation Financial
11.2.2.1 Danaher Corporation Segment Overview
11.2.3 Danaher Corporation Products and Services
11.2.4 Danaher Corporation Recent Developments, Contracts and Agreements
11.2.5 Danaher Corporation SWOT Analysis
11.3 Rockwell Automation
11.3.1 Rockwell Automation Company Overview
11.3.2 Rockwell Automation Financial
11.3.2.1 Rockwell Automation Business Segment Overview
11.3.3 Rockwell Automation Products and Services
11.3.4 Rockwell Automation Recent Developments, Contracts and Agreements
11.3.5 Rockwell Automation SWOT Analysis
11.4 Siemens AG
11.4.1 Siemens AG Company Overview
11.4.2 Siemens AG Financial
11.4.2.1 Siemens AG Segment Overview
11.4.3 Siemens AG Products and Services
11.4.4 Siemens AG Recent Developments, Contracts and Agreements
11.4.5 Siemens AG SWOT Analysis
11.5 General Electric
11.5.1 General Electric Company Overview
11.5.2 General Electric Financial
11.5.2.1 General Electric Business Segment Overview
11.5.3 General Electric Products and Services
11.5.4 General Electric Recent Developments, Contracts and Agreements
11.5.5 General Electric SWOT Analysis
11.6 Honeywell International Inc.
11.6.1 Honeywell International Inc. Company Overview
11.6.2 Honeywell International Inc. Financial
11.6.2.1 Honeywell International Inc. Business Segment Overview
11.6.3 Honeywell International Inc. Products and Services
11.6.4 Honeywell International Inc. Recent Developments, Contracts and Agreements
11.6.5 Honeywell International Inc. SWOT Analysis
11.7 Schneider Electric
11.7.1 Schneider Electric Company Overview
11.7.2 Schneider Electric Financial
11.7.2.1 Schneider Electric Business Segment Overview
11.7.3 Schneider Electric Products and Services
11.7.4 Schneider Electric Recent Developments, Contracts and Agreements
11.7.5 Schneider Electric SWOT Analysis
11.8 Emerson Electric Co.
11.8.1 Emerson Electric Co. Company Overview
11.8.2 Emerson Electric Co. Financial
11.8.2.1 Emerson Electric Co. Business Segment Overview
11.8.3 Emerson Electric Co. Products and Services
11.8.4 Emerson Electric Co. Recent Developments, Contracts and Agreements
11.8.5 Emerson Electric Co. SWOT Analysis
11.9 Yokogawa Electric Corp.
11.9.1 Yokogawa Electric Corp. Company Overview
11.9.2 Yokogawa Electric Corp. Financial
11.9.2.1 Yokogawa Electric Corp. Business Segment Overview
11.9.3 Yokogawa Electric Corp. Products and Services
11.9.4 Yokogawa Electric Corp. Recent Developments, Contracts and Agreements
11.9.5 Yokogawa Electric Corp. SWOT Analysis
11.10 Mitsubishi Electric Corp.
11.10.1 Mitsubishi Electric Corp. Company Overview
11.10.2 Mitsubishi Electric Corp. Financial
11.10.2.1 Mitsubishi Electric Corp. Business Segment Overview
11.10.3 Mitsubishi Electric Corp. Products and Services
11.10.4 Mitsubishi Electric Corp. Recent Developments, Contracts and Agreements
11.10.5 Mitsubishi Electric Corp. SWOT Analysis
11.11 Cameron International Corporation
11.11.1 Cameron International Corporation Company Overview
11.11.2 Cameron International Corporation Products and Services
11.11.3 Cameron International Corporation Recent Developments, Contracts and Agreements
11.12 Texas Instruments
11.12.1 Texas Instruments Company Overview
11.12.2 Texas Instruments Financial
11.12.2.1 Texas Instruments Business Segment Overview
11.12.3 Texas Instruments Products and Services
11.12.4 Texas Instruments Recent Developments, Contracts and Agreements
11.12.5 Texas Instruments SWOT Analysis
12. Conclusion
12.1 Key Findings in the Oil & Gas Automation & Control Systems Market
13. Glossary
Associated Visiongain Reports
Visiongain Report Sales Order Form
Appendix A
About Visiongain
Appendix B
List of Tables
Table 3.1 Global Oil & Gas Automation & Control (A&C) Systems Market Forecast 2019-2029 ($bn, AGR %, CAGR %, Cumulative)
Table 4.1 PEST Analysis of the Oil & Gas Automation & Control Market 2019-2029
Table 5.1 Global Oil & Gas Automation & Control (A&C) Systems Market Forecast by Technology 2019- 2029 (US$ Bn, AGR%, Cumulative)
Table 5.2 Global Oil & Gas Automation & Control (A&C) Systems Market Forecast by Application 2019- 2029 (US$ Bn, AGR%, Cumulative)
Table 5.3 Global Oil & Gas Automation & Control (A&C) Systems Market Forecast by Upstream Application 2019- 2029 (US$ Bn, AGR%, Cumulative)
Table 5.4 Global Oil & Gas Automation & Control (A&C) Systems Market Forecast by Technology 2019- 2029 (US$ Bn, AGR%, Cumulative)
Table 6.1 North America Oil & Gas Automation & Control (A&C) Systems Market Forecast 2019-2029 ($bn, AGR %, CAGR %, Cumulative)
Table 6.2 North America Oil & Gas Automation & Control (A&C) Systems Market Forecast by Technology 2019- 2029 (US$ Bn, AGR%, Cumulative)
Table 6.3 North America Oil & Gas Automation & Control (A&C) Systems Market Forecast by Application 2019- 2029 (US$ Bn, AGR%, Cumulative)
Table 6.4 Global Oil & Gas Automation & Control (A&C) Systems Market Forecast by Upstream Application 2019- 2029 (US$ Bn, AGR%, Cumulative)
Table 6.5 North America Oil & Gas Automation & Control (A&C) Systems Market Forecast by Country 2019- 2029 (US$ Bn, AGR%, Cumulative)
able 6.6 U.S. Oil & Gas Automation & Control (A&C) Systems Market Forecast 2019-2029 ($bn, AGR %, CAGR %, Cumulative)
Table 6.7 Canada Oil & Gas Automation & Control (A&C) Systems Market Forecast 2019-2029 ($bn, AGR %, CAGR %, Cumulative)
Table 6.8 Rest of North America Oil & Gas Automation & Control (A&C) Systems Market Forecast 2019-2029 ($bn, AGR %, CAGR %, Cumulative
Table 7.1 Europe Oil & Gas Automation & Control (A&C) Systems Market Forecast 2019-2029 ($bn, AGR %, CAGR %, Cumulative)
Table 7.2 Europe Oil & Gas Automation & Control (A&C) Systems Market Forecast by Technology 2019- 2029 (US$ Bn, AGR%, Cumulative)
Table 7.3 Europe Oil & Gas Automation & Control (A&C) Systems Market Forecast by Application 2019- 2029 (US$ Bn, AGR%, Cumulative)
Table 7.4 Global Oil & Gas Automation & Control (A&C) Systems Market Forecast by Upstream Application 2019- 2029 (US$ Bn, AGR%, Cumulative)
Table 7.5 Europe Oil & Gas Automation & Control (A&C) Systems Market Forecast by Country 2019- 2029 (US$ Bn, AGR%, Cumulative)
Table 7.6 U.K. Oil & Gas Automation & Control (A&C) Systems Market Forecast 2019-2029 ($bn, AGR %, CAGR %, Cumulative)
Table 7.7 Spain Oil & Gas Automation & Control (A&C) Systems Market Forecast 2019-2029 ($bn, AGR %, CAGR %, Cumulative)
Table 7.8 Italy Oil & Gas Automation & Control (A&C) Systems Market Forecast 2019-2029 ($bn, AGR %, CAGR %, Cumulative)
Table 7.9 Germany Oil & Gas Automation & Control (A&C) Systems Market Forecast 2019-2029 ($bn, AGR %, CAGR %, Cumulative)
Table 7.10 Rest of Europe Oil & Gas Automation & Control (A&C) Systems Market Forecast 2019-2029 ($bn, AGR %, CAGR %, Cumulative)
Table 8.1 Asia Pacific Oil & Gas Automation & Control (A&C) Systems Market Forecast 2019-2029 ($bn, AGR %, CAGR %, Cumulative)
Table 8.2 Asia Pacific Oil & Gas Automation & Control (A&C) Systems Market Forecast by Technology 2019- 2029 (US$ Bn, AGR%, Cumulative)
Table 8.3 Asia Pacific Oil & Gas Automation & Control (A&C) Systems Market Forecast by Application 2019- 2029 (US$ Bn, AGR%, Cumulative)
Table 8.4 Global Oil & Gas Automation & Control (A&C) Systems Market Forecast by Upstream Application 2019- 2029 (US$ Bn, AGR%, Cumulative)
Table 8.5 Asia Pacific Oil & Gas Automation & Control (A&C) Systems Market Forecast by Country 2019- 2029 (US$ Bn, AGR%, Cumulative)
Table 8.6 China Oil & Gas Automation & Control (A&C) Systems Market Forecast 2019-2029 ($bn, AGR %, CAGR %, Cumulative)
Table 8.7 Japan Oil & Gas Automation & Control (A&C) Systems Market Forecast 2019-2029 ($bn, AGR %, CAGR %, Cumulative)
Table 8.8 India Oil & Gas Automation & Control (A&C) Systems Market Forecast 2019-2029 ($bn, AGR %, CAGR %, Cumulative)
Table 8.9 Australasia Oil & Gas Automation & Control (A&C) Systems Market Forecast 2019-2029 ($bn, AGR %, CAGR %, Cumulative)
Table 8.10 Rest of Asia Pacific Oil & Gas Automation & Control (A&C) Systems Market Forecast 2019-2029 ($bn, AGR %, CAGR %, Cumulative)
Table 9.1 Middle East and Africa Oil & Gas Automation & Control (A&C) Systems Market Forecast 2019-2029 ($bn, AGR %, CAGR %, Cumulative)
Table 9.2 Middle East and Africa Oil & Gas Automation & Control (A&C) Systems Market Forecast by Technology 2019- 2029 (US$ Bn, AGR%, Cumulative)
Table 9.3 Middle East and Africa Oil & Gas Automation & Control (A&C) Systems Market Forecast by Application 2019- 2029 (US$ Bn, AGR%, Cumulative)
Table 9.4 Global Oil & Gas Automation & Control (A&C) Systems Market Forecast by Upstream Application 2019- 2029 (US$ Bn, AGR%, Cumulative)
Table 9.5 Middle East and Africa Oil & Gas Automation & Control (A&C) Systems Market Forecast by Country 2019- 2029 (US$ Bn, AGR%, Cumulative)
Table 9.6 GCC Countries Oil & Gas Automation & Control (A&C) Systems Market Forecast 2019-2029 ($bn, AGR %, CAGR %, Cumulative)
Table 9.7 South Africa Oil & Gas Automation & Control (A&C) Systems Market Forecast 2019-2029 ($bn, AGR %, CAGR %, Cumulative)
Table 9.8 Rest of MEA Oil & Gas Automation & Control (A&C) Systems Market Forecast 2019-2029 ($bn, AGR %, CAGR %, Cumulative)
Table 10.1 South America Oil & Gas Automation & Control (A&C) Systems Market Forecast 2019-2029 ($bn, AGR %, CAGR %, Cumulative)
Table 10.2 South America Oil & Gas Automation & Control (A&C) Systems Market Forecast by Technology 2019- 2029 (US$ Bn, AGR%, Cumulative)
Table 10.3 South America Oil & Gas Automation & Control (A&C) Systems Market Forecast by Application 2019- 2029 (US$ Bn, AGR%, Cumulative)
Table 10.4 Global Oil & Gas Automation & Control (A&C) Systems Market Forecast by Upstream Application 2019- 2029 (US$ Bn, AGR%, Cumulative)
Table 10.5 South America Oil & Gas Automation & Control (A&C) Systems Market Forecast by Country 2019- 2029 (US$ Bn, AGR%, Cumulative)
Table 10.6 Brazil Oil & Gas Automation & Control (A&C) Systems Market Forecast 2019-2029 ($bn, AGR %, CAGR %, Cumulative)
Table 10.7 Argentina Oil & Gas Automation & Control (A&C) Systems Market Forecast 2019-2029 ($bn, AGR %, CAGR %, Cumulative)
Table 10.8 Rest of South America Oil & Gas Automation & Control (A&C) Systems Market Forecast 2019-2029 ($bn, AGR %, CAGR %, Cumulative)
Table 11.1 ABB Ltd. Key Financials (Revenue, Employees, Market Cap, Net Income, Net Profit Margin, Earnings per Share)
Table 11.2 ABB Ltd. Product and Services Overview
Table 11.3 ABB Ltd. Recent Developments, Contracts and Agreements 2017-2019
Table 11.4 ABB Ltd. SWOT Analysis
Table 11.5 Danaher Corporation Key Financials (US$) (Revenue, Employees, Market Cap, Net Income, Net Profit Margin, Earnings per Share)
Table 11.6 Danaher Corporation Product and Services Overview
Table 11.7 Danaher Corporation Recent Developments, Contracts and Agreements 2015-2019
Table 11.8 Danaher Corporation SWOT Analysis
Table 11.9 Rockwell Automation Key Financials (US$) (Revenue, Employees, Market Cap, Net Income, Net Profit Margin, Earnings per Share)
Table 11.10 Rockwell Automation Product and Services Overview
Table 11.11 Rockwell Automation Recent Developments, Contracts and Agreements 2017-2019
Table 11.12 Rockwell Automation SWOT Analysis
Table 11.13 Siemens AG Key Financials (US$) (Revenue, Employees, Market Cap, Net Income, Net Profit Margin, Earnings per Share)
Table 11.14 Siemens AG Product and Services Overview
Table 11.15 Siemens AG Recent Developments, Contracts and Agreements 2017-2018
Table 11.16 Siemens AG SWOT Analysis
Table 11.17 General Electric Key Financials (US$) (Revenue, Employees, Market Cap, Net Income, Net Profit Margin, Earnings per Share)
Table 11.18 General Electric Product and Services Overview
Table 11.19 General Electric Recent Developments, Contracts and Agreements 2015-2018
Table 11.20 General Electric SWOT Analysis
Table 11.21 Honeywell International Inc. Key Financials (US$) (Revenue, Employees, Market Cap, Net Income, Net Profit Margin, Earnings per Share)
Table 11.22 Honeywell International Inc. Product and Services Overview
Table 11.23 Honeywell International Inc. Recent Developments, Contracts and Agreements 2010-2017
Table 11.24 Honeywell International Inc. SWOT Analysis
Table 11.25 Schneider Electric Key Financials (US$) (Revenue, Employees, Market Cap, Net Income, Net Profit Margin, Earnings per Share)
Table 11.26 Schneider Electric Product and Services Overview
Table 11.27 Schneider Electric Recent Developments, Contracts and Agreements 2012-2017
Table 11.28 Schneider Electric SWOT Analysis
Table 11.29 Emerson Electric Co. Key Financials (US$) (Revenue, Employees, Market Cap, Net Income, Net Profit Margin, Earnings per Share)
Table 11.30 Emerson Electric Co. Product and Services Overview
Table 11.31 Emerson Electric Co. Recent Developments, Contracts and Agreements 2011-2017
Table 11.32 Emerson Electric Co. SWOT Analysis
Table 11.33 Yokogawa Electric Corp. Key Financials (US$) (Revenue, Employees, Market Cap, Net Income, Net Profit Margin, Earnings per Share)
Table 11.34 Yokogawa Electric Corp. Product and Services Overview
Table 11.35 Yokogawa Electric Corp. Recent Developments, Contracts and Agreements 2013-2016
Table 11.36 Yokogawa Electric Corp. SWOT Analysis
Table 11.37 Mitsubishi Electric Corp. Key Financials (US$) (Revenue, Employees, Market Cap, Net Income, Net Profit Margin, Earnings per Share)
Table 11.38 Mitsubishi Electric Corp. Product and Services Overview
Table 11.39 Mitsubishi Electric Corp. Recent Developments, Contracts and Agreements 2017-2019
Table 11.40 Mitsubishi Electric Corp. SWOT Analysis
Table 11.41 Cameron International Corporation Product and Services Overview
Table 11.42 Cameron International Corporation Recent Developments, Contracts and Agreements 2016
Table 11.43 Texas Instruments Key Financials (US$) (Revenue, Employees, Market Cap, Net Income, Net Profit Margin, Earnings per Share)
Table 11.44 Texas Instruments Product and Services Overview
Table 11.45 Texas Instruments Recent Developments, Contracts and Agreements 2017-2018
Table 11.46 Texas Instruments SWOT Analysis
List of Figures
Figure 2.1 Stages of Oil & Gas Automation & Control Systems Project
Figure 2.2 Simplified Example Automation & Control System Architecture
Figure 2.3 Concept Topography of a Distributed Control System (DCS)
Figure 3.1 Global Oil & Gas Automation & Control (A&C) Systems Market Forecast 2019-2029 ($bn, AGR %)
Figure 3.2 Automation Benefits in Oil & Gas Automation and Control Systems Market
Figure 3.3 Global Oil Demand by Regions (bpd)
Figure 3.4 Applications of Oil & Gas Automation and Control Systems
Figure 5.1 Global Oil & Gas Automation & Control (A&C) Systems Market Share Forecast by Technology 2019, 2024, 2029 (% Share)
Figure 5.2 Global Oil & Gas Automation & Control (A&C) Systems Market Forecast by Technology 2019-2029 (US$ Bn)
Figure 5.3 Global Oil & Gas Automation & Control (A&C) Systems Market AGR Forecast by Technology 2019-2029 (AGR%)
Figure 5.4 Global Oil & Gas Automation & Control (A&C) Systems Market Attractiveness Analysis by Technology 2019-2029
Figure 5.5 Global Oil & Gas Automation & Control (A&C) Systems Market Share Forecast by Application 2019, 2024, 2029 (% Share)
Figure 5.6 Global Oil & Gas Automation & Control (A&C) Systems Market Forecast by Application 2019-2029 (US$ Bn)
Figure 5.7 Global Oil & Gas Automation & Control (A&C) Systems Market AGR Forecast by Application 2019-2029 (AGR%)
Figure 5.8 Global Oil & Gas Automation & Control (A&C) Systems Market Attractiveness Analysis by Application 2019-2029
Figure 5.9 Global Oil & Gas Automation & Control (A&C) Systems Market Share Forecast by Upstream Application 2019, 2024, 2029 (% Share)
Figure 5.10 Global Oil & Gas Automation & Control (A&C) Systems Market Forecast by Upstream Application 2019-2029 (US$ Bn)
Figure 5.11 Global Oil & Gas Automation & Control (A&C) Systems Market AGR Forecast by Upstream Application 2019-2029 (AGR%)
Figure 5.12 Global Oil & Gas Automation & Control (A&C) Systems Market Attractiveness Analysis by Upstream Application 2019-2029
Figure 5.13 Global Oil & Gas Automation & Control (A&C) Systems Market Share Forecast by Geography 2019, 2024, 2029 (% Share)
Figure 5.14 Global Oil & Gas Automation & Control (A&C) Systems Market Forecast by Geography 2019-2029 (US$ Bn)
Figure 5.15 Global Oil & Gas Automation & Control (A&C) Systems Market AGR Forecast by Geography 2019-2029 (AGR%)
Figure 5.16 Global Oil & Gas Automation & Control (A&C) Systems Market Attractiveness Analysis by Geography 2019-2029
Figure 6.1 North America Oil & Gas Automation & Control (A&C) Systems Market Forecast 2019-2029 ($bn, AGR %)
Figure 6.2 North America Oil & Gas Automation & Control (A&C) Systems Market Share Forecast by Technology 2019, 2024, 2029 (% Share)
Figure 6.3 North America Oil & Gas Automation & Control (A&C) Systems Market Forecast by Technology 2019-2029 (US$ Bn)
Figure 6.4 North America Oil & Gas Automation & Control (A&C) Systems Market AGR Forecast by Technology 2019-2029 (AGR%)
Figure 6.5 North America Oil & Gas Automation & Control (A&C) Systems Market Attractiveness Analysis by Technology 2019-2029
Figure 6.6 North America Oil & Gas Automation & Control (A&C) Systems Market Share Forecast by Application 2019, 2024, 2029 (% Share)
Figure 6.7 North America Oil & Gas Automation & Control (A&C) Systems Market Forecast by Application 2019-2029 (US$ Bn)
Figure 6.8 North America Oil & Gas Automation & Control (A&C) Systems Market AGR Forecast by Application 2019-2029 (AGR%)
Figure 6.9 North America Oil & Gas Automation & Control (A&C) Systems Market Attractiveness Analysis by Application 2019-2029
Figure 6.10 North America Oil & Gas Automation & Control (A&C) Systems Market Share Forecast by Upstream Application 2019, 2024, 2029 (% Share)
Figure 6.11 North America Oil & Gas Automation & Control (A&C) Systems Market Forecast by Upstream Application 2019-2029 (US$ Bn)
Figure 6.12 North America Oil & Gas Automation & Control (A&C) Systems Market AGR Forecast by Upstream Application 2019-2029 (AGR%)
Figure 6.13 North America Oil & Gas Automation & Control (A&C) Systems Market Attractiveness Analysis by Upstream Application 2019-2029
Figure 6.14 North America Oil & Gas Automation & Control (A&C) Systems Market Share Forecast by Country 2019, 2024, 2029 (% Share)
Figure 6.15 North America Oil & Gas Automation & Control (A&C) Systems Market Forecast by Country 2019-2029 (US$ Bn)
Figure 6.16 North America Oil & Gas Automation & Control (A&C) Systems Market AGR Forecast by Country 2019-2029 (AGR%)
Figure 6.17 North America Oil & Gas Automation & Control (A&C) Systems Market Attractiveness Analysis by Country 2019-2029
Figure 6.18 U.S. Oil & Gas Automation & Control (A&C) Systems Market Forecast 2019-2029 ($bn, AGR %)
Figure 6.19 Canada Oil & Gas Automation & Control (A&C) Systems Market Forecast 2019-2029 ($bn, AGR %)
Figure 6.20 Rest of North America Oil & Gas Automation & Control (A&C) Systems Market Forecast 2019-2029 ($bn, AGR %)
Figure 7.1 Europe Oil & Gas Automation & Control (A&C) Systems Market Forecast 2019-2029 ($bn, AGR %)
Figure 7.2 Europe Oil & Gas Automation & Control (A&C) Systems Market Share Forecast by Technology 2019, 2024, 2029 (% Share)
Figure 7.3 Europe Oil & Gas Automation & Control (A&C) Systems Market Forecast by Technology 2019-2029 (US$ Bn)
Figure 7.4 Europe Oil & Gas Automation & Control (A&C) Systems Market AGR Forecast by Technology 2019-2029 (AGR%)
Figure 7.5 Europe Oil & Gas Automation & Control (A&C) Systems Market Attractiveness Analysis by Technology 2019-2029
Figure 7.6 Europe Oil & Gas Automation & Control (A&C) Systems Market Share Forecast by Application 2019, 2024, 2029 (% Share)
Figure 7.7 Europe Oil & Gas Automation & Control (A&C) Systems Market Forecast by Application 2019-2029 (US$ Bn)
Figure 7.8 Europe Oil & Gas Automation & Control (A&C) Systems Market AGR Forecast by Application 2019-2029 (AGR%)
Figure 7.9 Europe Oil & Gas Automation & Control (A&C) Systems Market Attractiveness Analysis by Application 2019-2029
Figure 7.10 Europe Oil & Gas Automation & Control (A&C) Systems Market Share Forecast by Upstream Application 2019, 2024, 2029 (% Share)
Figure 7.11 Europe Oil & Gas Automation & Control (A&C) Systems Market Forecast by Upstream Application 2019-2029 (US$ Bn)
Figure 7.12 Europe Oil & Gas Automation & Control (A&C) Systems Market AGR Forecast by Upstream Application 2019-2029 (AGR%)
Figure 7.13 Europe Oil & Gas Automation & Control (A&C) Systems Market Attractiveness Analysis by Upstream Application 2019-2029
Figure 7.14 Europe Oil & Gas Automation & Control (A&C) Systems Market Share Forecast by Country 2019, 2024, 2029 (% Share)
Figure 7.15 Europe Oil & Gas Automation & Control (A&C) Systems Market Forecast by Country 2019-2029 (US$ Bn)
Figure 7.16 Europe Oil & Gas Automation & Control (A&C) Systems Market AGR Forecast by Country 2019-2029 (AGR%)
Figure 7.17 Europe Oil & Gas Automation & Control (A&C) Systems Market Attractiveness Analysis by Country 2019-2029
Figure 7.18 U.K. Oil & Gas Automation & Control (A&C) Systems Market Forecast 2019-2029 ($bn, AGR %)
Figure 7.19 Spain Oil & Gas Automation & Control (A&C) Systems Market Forecast 2019-2029 ($bn, AGR %)
Figure 7.20 Italy Oil & Gas Automation & Control (A&C) Systems Market Forecast 2019-2029 ($bn, AGR %)
Figure 7.21 Germany Oil & Gas Automation & Control (A&C) Systems Market Forecast 2019-2029 ($bn, AGR %)
Figure 7.22 Rest of Europe Oil & Gas Automation & Control (A&C) Systems Market Forecast 2019-2029 ($bn, AGR %)
Figure 8.1 Asia Pacific Oil & Gas Automation & Control (A&C) Systems Market Forecast 2019-2029 ($bn, AGR %)
Figure 8.2 Asia Pacific Oil & Gas Automation & Control (A&C) Systems Market Share Forecast by Technology 2019, 2024, 2029 (% Share)
Figure 8.3 Asia Pacific Oil & Gas Automation & Control (A&C) Systems Market Forecast by Technology 2019-2029 (US$ Bn)
Figure 8.4 Asia Pacific Oil & Gas Automation & Control (A&C) Systems Market AGR Forecast by Technology 2019-2029 (AGR%)
Figure 8.5 Asia Pacific Oil & Gas Automation & Control (A&C) Systems Market Attractiveness Analysis by Technology 2019-2029
Figure 8.6 Asia Pacific Oil & Gas Automation & Control (A&C) Systems Market Share Forecast by Application 2019, 2024, 2029 (% Share)
Figure 8.7 Asia Pacific Oil & Gas Automation & Control (A&C) Systems Market Forecast by Application 2019-2029 (US$ Bn)
Figure 8.8 Asia Pacific Oil & Gas Automation & Control (A&C) Systems Market AGR Forecast by Application 2019-2029 (AGR%)
Figure 8.9 Asia Pacific Oil & Gas Automation & Control (A&C) Systems Market Attractiveness Analysis by Application 2019-2029
Figure 8.10 Asia Pacific Oil & Gas Automation & Control (A&C) Systems Market Share Forecast by Upstream Application 2019, 2024, 2029 (% Share)
Figure 8.11 Asia Pacific Oil & Gas Automation & Control (A&C) Systems Market Forecast by Upstream Application 2019-2029 (US$ Bn)
Figure 8.12 Asia Pacific Oil & Gas Automation & Control (A&C) Systems Market AGR Forecast by Upstream Application 2019-2029 (AGR%)
Figure 8.13 Asia Pacific Oil & Gas Automation & Control (A&C) Systems Market Attractiveness Analysis by Upstream Application 2019-2029
Figure 8.14 Asia Pacific Oil & Gas Automation & Control (A&C) Systems Market Share Forecast by Country 2019, 2024, 2029 (% Share)
Figure 8.15 Asia Pacific Oil & Gas Automation & Control (A&C) Systems Market Forecast by Country 2019-2029 (US$ Bn)
Figure 8.16 Asia Pacific Oil & Gas Automation & Control (A&C) Systems Market AGR Forecast by Country 2019-2029 (AGR%)
Figure 8.17 Asia Pacific Oil & Gas Automation & Control (A&C) Systems Market Attractiveness Analysis by Country 2019-2029
Figure 8.18 China Oil & Gas Automation & Control (A&C) Systems Market Forecast 2019-2029 ($bn, AGR %)
Figure 8.19 Japan Oil & Gas Automation & Control (A&C) Systems Market Forecast 2019-2029 ($bn, AGR %)
Figure 8.20 India Oil & Gas Automation & Control (A&C) Systems Market Forecast 2019-2029 ($bn, AGR %)
Figure 8.21 Australasia Oil & Gas Automation & Control (A&C) Systems Market Forecast 2019-2029 ($bn, AGR %)
Figure 8.22 Rest of Asia Pacific Oil & Gas Automation & Control (A&C) Systems Market Forecast 2019-2029 ($bn, AGR %)
Figure 9.1 Middle East and Africa Oil & Gas Automation & Control (A&C) Systems Market Forecast 2019-2029 ($bn, AGR %)
Figure 9.2 Middle East and Africa Oil & Gas Automation & Control (A&C) Systems Market Share Forecast by Technology 2019, 2024, 2029 (% Share)
Figure 9.3 Middle East and Africa Oil & Gas Automation & Control (A&C) Systems Market Forecast by Technology 2019-2029 (US$ Bn)
Figure 9.4 Middle East and Africa Oil & Gas Automation & Control (A&C) Systems Market AGR Forecast by Technology 2019-2029 (AGR%)
Figure 9.5 Middle East and Africa Oil & Gas Automation & Control (A&C) Systems Market Attractiveness Analysis by Technology 2019-2029
Figure 9.6 Middle East and Africa Oil & Gas Automation & Control (A&C) Systems Market Share Forecast by Application 2019, 2024, 2029 (% Share)
Figure 9.7 Middle East and Africa Oil & Gas Automation & Control (A&C) Systems Market Forecast by Application 2019-2029 (US$ Bn)
Figure 9.8 Middle East and Africa Oil & Gas Automation & Control (A&C) Systems Market AGR Forecast by Application 2019-2029 (AGR%)
Figure 9.9 Middle East and Africa Oil & Gas Automation & Control (A&C) Systems Market Attractiveness Analysis by Application 2019-2029
Figure 9.10 Middle East and Africa Oil & Gas Automation & Control (A&C) Systems Market Share Forecast by Upstream Application 2019, 2024, 2029 (% Share)
Figure 9.11 Middle East and Africa Oil & Gas Automation & Control (A&C) Systems Market Forecast by Upstream Application 2019-2029 (US$ Bn)
Figure 9.12 Middle East and Africa Oil & Gas Automation & Control (A&C) Systems Market AGR Forecast by Upstream Application 2019-2029 (AGR%)
Figure 9.13 Middle East and Africa Oil & Gas Automation & Control (A&C) Systems Market Attractiveness Analysis by Upstream Application 2019-2029
Figure 9.14 Middle East and Africa Oil & Gas Automation & Control (A&C) Systems Market Share Forecast by Country 2019, 2024, 2029 (% Share)
Figure 9.15 Middle East and Africa Oil & Gas Automation & Control (A&C) Systems Market Forecast by Country 2019-2029 (US$ Bn)
Figure 9.16 Middle East and Africa Oil & Gas Automation & Control (A&C) Systems Market AGR Forecast by Country 2019-2029 (AGR%)
Figure 9.17 Middle East and Africa Oil & Gas Automation & Control (A&C) Systems Market Attractiveness Analysis by Country 2019-2029
Figure 9.18 GCC Countries Oil & Gas Automation & Control (A&C) Systems Market Forecast 2019-2029 ($bn, AGR %)
Figure 9.19 South Africa Oil & Gas Automation & Control (A&C) Systems Market Forecast 2019-2029 ($bn, AGR %)
Figure 9.20 Rest of MEA Oil & Gas Automation & Control (A&C) Systems Market Forecast 2019-2029 ($bn, AGR %)
Figure 10.1 South America Oil & Gas Automation & Control (A&C) Systems Market Forecast 2019-2029 ($bn, AGR %)
Figure 10.2 South America Oil & Gas Automation & Control (A&C) Systems Market Share Forecast by Technology 2019, 2024, 2029 (% Share)
Figure 10.3 South America Oil & Gas Automation & Control (A&C) Systems Market Forecast by Technology 2019-2029 (US$ Bn)
Figure 10.4 South America Oil & Gas Automation & Control (A&C) Systems Market AGR Forecast by Technology 2019-2029 (AGR%)
Figure 10.5 South America Oil & Gas Automation & Control (A&C) Systems Market Attractiveness Analysis by Technology 2019-2029
Figure 10.6 South America Oil & Gas Automation & Control (A&C) Systems Market Share Forecast by Application 2019, 2024, 2029 (% Share)
Figure 10.7 South America Oil & Gas Automation & Control (A&C) Systems Market Forecast by Application 2019-2029 (US$ Bn)
Figure 10.8 South America Oil & Gas Automation & Control (A&C) Systems Market AGR Forecast by Application 2019-2029 (AGR%)
Figure 10.9 South America Oil & Gas Automation & Control (A&C) Systems Market Attractiveness Analysis by Application 2019-2029
Figure 10.10 South America Oil & Gas Automation & Control (A&C) Systems Market Share Forecast by Upstream Application 2019, 2024, 2029 (% Share)
Figure 10.11 South America Oil & Gas Automation & Control (A&C) Systems Market Forecast by Upstream Application 2019-2029 (US$ Bn)
Figure 10.12 South America Oil & Gas Automation & Control (A&C) Systems Market AGR Forecast by Upstream Application 2019-2029 (AGR%)
Figure 10.13 South America Oil & Gas Automation & Control (A&C) Systems Market Attractiveness Analysis by Upstream Application 2019-2029
Figure 10.14 South America Oil & Gas Automation & Control (A&C) Systems Market Share Forecast by Country 2019, 2024, 2029 (% Share)
Figure 10.15 South America Oil & Gas Automation & Control (A&C) Systems Market Forecast by Country 2019-2029 (US$ Bn)
Figure 10.16 South America Oil & Gas Automation & Control (A&C) Systems Market AGR Forecast by Country 2019-2029 (AGR%)
Figure 10.17 South America Oil & Gas Automation & Control (A&C) Systems Market Attractiveness Analysis by Country 2019-2029
Figure 10.18 Brazil Oil & Gas Automation & Control (A&C) Systems Market Forecast 2019-2029 ($bn, AGR %)
Figure 10.19 Argentina Oil & Gas Automation & Control (A&C) Systems Market Forecast 2019-2029 ($bn, AGR %)
Figure 10.20 Rest of South America Oil & Gas Automation & Control (A&C) Systems Market Forecast 2019-2029 ($bn, AGR %)
Figure 11.1 ABB Ltd. Business Segment Overview (2018)
Figure 11.2 ABB Ltd. Geographic Segment Overview (2018)
Figure 11.3 Danaher Corporation Business Segment Overview (2018)
Figure 11.4 Danaher Corporation Geographic Segment Overview (2018)
Figure 11.5 Rockwell Automation Business Segment Overview (2018)
Figure 11.6 Rockwell Automation Geographic Segment Overview (2018)
Figure 11.7 Siemens AG Business Segment Overview (2018)
Figure 11.8 Siemens AG Geographic Segment Overview (2018)
Figure 11.9 General Electric Business Segment Overview (2018)
Figure 11.10 General Electric Geographic Segment Overview (2018)
Figure 11.11 Honeywell International Inc. Business Segment Overview (2018)
Figure 11.12 Honeywell International Inc. Geographic Segment Overview (2018)
Figure 11.13 Schneider Electric Business Segment Overview (2018)
Figure 11.14 Schneider Electric Geographic Segment Overview (2018)
Figure 11.15 Emerson Electric Co. Business Segment Overview (2018)
Figure 11.16 Emerson Electric Co. Geographic Segment Overview (2018)
Figure 11.17 Yokogawa Electric Corp. Business Segment Overview (2018)
Figure 11.18 Yokogawa Electric Corp. Geographic Segment Overview (2018)
Figure 11.19 Mitsubishi Electric Corp. Business Segment Overview (2018)
Figure 11.20 Mitsubishi Electric Corp. Geographic Segment Overview (2018)
Figure 11.21 Texas Instruments Business Segment Overview (2018)
Figure 11.22 Texas Instruments Geographic Segment Overview (2018)
Abu Dhabi National Oil Company
ADCO
Al Naboodah Construction
Ashgabat
B&R
Bharat Petroleum Corporation
BHGE
BP
Cairn India.
Cameron International Corporation
Chennai Petroleum Corporation (CPCL)
Cowex
CPECC
Danaher Corporation
Elsewedy Electric
Emerson Electric Co.
Enardo
Essar Oil Ltd. (EOL)
General Electric
Hindustan Petroleum Corporation
Honeywell International Inc.
HPS
Indian Oil Corporation Limited (IOCL)
Intrion
JX Nippon Oil & Energy
Mangalore Refinery and Petrochemicals Ltd (MRPL)
Maricann Group
MHPS
Mitsubishi Electric Corp.
MJK automation
Nakosoko IGCC Power
NextDecade
Oil and Natural Gas Corporation (ONGC)
Omron industrial automation
OneSubsea
Orascom Construction
Premier Farnell
Reliance Industries (RIL) etc.
Reliance Industries (RIL), Oil India (OIL)
Rockwell Automation
Saudi Aramco
Schlumberger
Schneider Electric
Sensia
Siemens AG
TATNEFT
Texas Instruments
Woodside
Yokogawa Electric Corp.
Organisations Mentioned in This Report
Canadian Association of Petroleum Produces
EIA - Energy Information Administration
GCC - Gulf Cooperation Council
IEA - International Energy Agency
JNOC - Japan National Oil Corporation
Korea Ministry of Employment and Labour
OECD – Organisation for Economic Co-operation and Development
OPEC – Organisation of the Petroleum Exporting Countries
PPAC - Petroleum Planning and Analysis Cell
Download sample pages
Complete the form below to download your free sample pages for Oil & Gas Automation & Control (A&C) Systems: World Market 2019-2029
Related reports
-

Liquefied Natural Gas (LNG) Bunkering Market 2019-2029
Visiongain has calculated that the LNG Bunkering market will see a capital expenditure (CAPEX) of $843mn in 2019. Read on...
Full DetailsPublished: 30 April 2019 -

Oil Sands Market Report 2019-2029
The latest report from business intelligence provider Visiongain offers a comprehensive analysis of the global oil sands market. Visiongain calculates...Full DetailsPublished: 11 July 2019 -

Thermal Enhanced Oil Recovery (EOR) Market Report 2018-2028
In this updated report, you find 130+ in-depth tables, charts and graphs all unavailable elsewhere. ...Full DetailsPublished: 12 October 2018 -

Carbon Dioxide (CO2) Enhanced Oil Recovery (EOR) Market 2019-2029
The latest report from business intelligence provider visiongain offers in depth analysis of the global carbon dioxide (CO2) enhanced oil...Full DetailsPublished: 13 December 2018 -

LPG Vaporizer Market Report 2019-2029
Visiongain has calculated that the LPG Vaporizing market will see a capital expenditure (CAPEX) of $1.9 bn in 2019. Read...
Full DetailsPublished: 09 May 2019 -

The Microgrid Market Forecast 2019-2029
Visiongain has calculated that the Microgrid Market will see a capital expenditure (CAPEX) of $12.6bn in 2019. Read on to...Full DetailsPublished: 25 February 2019 -
Oil Refineries Market Report 2018-2028
With the recent upswing in oil prices these margins are again rising and Visiongain expects the value of the refinery...Full DetailsPublished: 24 July 2018 -

The Airborne Geophysical Services Market Forecast 2019-2029
The airborne geophysical services market entails high capital investments along with high risk. The risk involved is comparatively high owing...Full DetailsPublished: 19 March 2019 -
Natural Gas Hydraulic Fracturing (Fracking) Market Report 2019-2029
Natural Gas Hydraulic Fracturing market worth $27.9 billion in 2019....Full DetailsPublished: 25 September 2019 -

Oil Country Tubular Goods (OCTG) Market Forecast 2019-2029
Oil Country Tubular Goods market to generate $5.9 billion in 2019....Full DetailsPublished: 05 February 2019
Download sample pages
Complete the form below to download your free sample pages for Oil & Gas Automation & Control (A&C) Systems: World Market 2019-2029
Do you have any custom requirements we can help you with?
Any specific country, geo region, market segment or specific company information?
Email us today, we can discuss your needs and see how we can help: jamie.roberts@visiongain.com
Would you like a free report overview of the report of your choice?
If so, please drop an email to Jamie Roberts stating your chosen report title to jamie.roberts@visiongain.com
Visiongain energy reports are compiled using a broad and rich mixture of both primary and secondary information to produce an overall industry outlook. In order to provide our clients with the best product possible product, we do not rely on any one single source of information. Visiongain analysts reach out to market-leading vendors and industry experts where possible but also review a wealth of financial data and product information from a vast range of sources. To find out more about our reports methodology, please email jamie.roberts@visiongain.com
Would you like to get the latest Visiongain energy reports catalogue?
What are the dynamic growth sectors? where are the regional business opportunities?
Which technologies will prevail and who are the leading companies succeeding in these sectors and why?
If you want definitive answers to business critical questions, discover Visiongain’s full range of business intelligence reports.
If so, please email Jamie Roberts on jamie.roberts@visiongain.com or call her today on +44 207 336 6100
“The Visiongain report was extremely insightful and helped us construct our basic go-to market strategy for our solution.”
H.
“F.B has used Visiongain to prepare two separate market studies on the ceramic proppants market over the last 12 months. These reports have been professionally researched and written and have assisted FBX greatly in developing its business strategy and investment plans.”
F.B
“We just received your very interesting report on the Energy Storage Technologies (EST) Market and this is a very impressive and useful document on that subject.”
I.E.N
“Visiongain does an outstanding job on putting the reports together and provides valuable insight at the right informative level for our needs. The EOR Visiongain report provided confirmation and market outlook data for EOR in MENA with the leading countries being Oman, Kuwait and eventually Saudi Arabia.”
E.S
“Visiongain produced a comprehensive, well-structured GTL Market report striking a good balance between scope and detail, global and local perspective, large and small industry segments. It is an informative forecast, useful for practitioners as a trusted and upto-date reference.”
Y.N Ltd
Association of Dutch Suppliers in the Oil & Gas Industry
Society of Naval Architects & Marine Engineers
Association of Diving Contractors
Association of Diving Contractors International
Associazione Imprese Subacquee Italiane
Australian Petroleum Production & Exploration Association
Brazilian Association of Offshore Support Companies
Brazilian Petroleum Institute
Canadian Energy Pipeline
Diving Medical Advisory Committee
European Diving Technology Committee
French Oil and Gas Industry Council
IMarEST – Institute of Marine Engineering, Science & Technology
International Association of Drilling Contractors
International Association of Geophysical Contractors
International Association of Oil & Gas Producers
International Chamber of Shipping
International Shipping Federation
International Marine Contractors Association
International Tanker Owners Pollution Federation
Leading Oil & Gas Industry Competitiveness
Maritime Energy Association
National Ocean Industries Association
Netherlands Oil and Gas Exploration and Production Association
NOF Energy
Norsk olje og gass Norwegian Oil and Gas Association
Offshore Contractors’ Association
Offshore Mechanical Handling Equipment Committee
Oil & Gas UK
Oil Companies International Marine Forum
Ontario Petroleum Institute
Organisation of the Petroleum Exporting Countries
Regional Association of Oil and Natural Gas Companies in Latin America and the Caribbean
Society for Underwater Technology
Society of Maritime Industries
Society of Petroleum Engineers
Society of Petroleum Enginners – Calgary
Step Change in Safety
Subsea UK
The East of England Energy Group
UK Petroleum Industry Association
All the events postponed due to COVID-19.
Latest Energy news
Visiongain Publishes Carbon Capture Utilisation and Storage (CCUS) Market Report 2024-2034
The global carbon capture utilisation and storage (CCUS) market was valued at US$3.75 billion in 2023 and is projected to grow at a CAGR of 20.6% during the forecast period 2024-2034.
19 April 2024
Visiongain Publishes Liquid Biofuels Market Report 2024-2034
The global Liquid Biofuels market was valued at US$90.7 billion in 2023 and is projected to grow at a CAGR of 6.7% during the forecast period 2024-2034.
03 April 2024
Visiongain Publishes Hydrogen Generation Market Report 2024-2034
The global Hydrogen Generation market was valued at US$162.3 billion in 2023 and is projected to grow at a CAGR of 3.7% during the forecast period 2024-2034.
28 March 2024
Visiongain Publishes Biofuel Industry Market Report 2024-2034
The global Biofuel Industry market was valued at US$123.2 billion in 2023 and is projected to grow at a CAGR of 7.6% during the forecast period 2024-2034.
27 March 2024
