Industries > Energy > Oil Country Tubular Goods (OCTG) Market Forecast 2019-2029
Oil Country Tubular Goods (OCTG) Market Forecast 2019-2029
Forecasts by Submarket, Grade (API, Premium), Application (Onshore, Offshore) and Type (Seamless, Welded). As well as by Leading Countries with Analysis of the Leading Companies in the Industry
• Do you need definitive OCTG market data?
• Succinct OCTG market analysis?
• Technological insight?
• Clear competitor analysis?
• Actionable business recommendations?
Report highlights
• 203 quantitative tables, charts, and graphs
• Analysis of key players in SME technologies
• ArcelorMittal
• Continental Alloys & Services
• Iljin Steel Co. Ltd
• National Oilwell Varco
• Nippon Steel & Sumitomo Metal Corporation
• Tenaris SA
• Tianjin Pipe Corporation
• TMK
• United States Steel
• Vallourec
• Global Oil Country Tubular Goods Revenue and Volume Outlook and Analysis From 2019-2029
• One Expert Interview with Key Industry Experts
• Sales Manager – Tenaris
• Oil Country Tubular Goods Revenue and Volume Forecasts and Analysis by Grade 2019-2029
• API
• Premium
• Leading National Tubular Goods Revenue and Volume Forecasts from 2019-2029
• US Tubular Goods Forecast 2019-2029
• China Tubular Goods Forecast 2019-2029
• Russia Tubular Goods Forecast 2019-2029
• Canada Tubular Goods Forecast 2019-2029
• GCC Tubular Goods Forecast 2019-2029
• Rest of the World Tubular Goods Forecast Reactor Forecast 2019-2029
• Key questions answered
• What does the future hold for the Oil Country Tubular Goods industry?
• Where should you target your business strategy?
• Which applications should you focus upon?
• Which companies should you form strategic alliances with?
• Which company is likely to succeed and why?
• What business models should you adopt?
• What industry trends should you be aware of?
• Target Audience
• Leading tubular goods companies
• Suppliers
• Contractors
• Technologists
• R&D staff
• Consultants
• Analysts
• CEO’s
• CIO’s
• COO’s
• Business development managers
• Investors
• Governments
• Agencies
• Industry Organisations
• Banks
Visiongain is a trading partner with the US Federal Government
CCR Ref number: KD4R6
1.1 Oil Country Tubular Goods (OCTG) Market Overview
1.2 Market Structure Overview and Market Definition
1.3 How This Report Delivers
1.4 Key Questions Answered by This Analytical Report Include:
1.5 Who is This Report For?
1.6 Methodology
1.6.1 Primary Research
1.6.2 Secondary Research
1.6.3 Market Evaluation & Forecasting Methodology
1.7 Frequently Asked Questions (FAQ)
1.8 Associated Visiongain Reports
1.9 About Visiongain
2. Introduction to the Oil Country Tubular Goods (OCTG)Market
2.1 Global Oil Country Tubular Goods (OCTG) Market Structure
2.2 Market Definition
2.3 Oil Country Tubular Goods (OCTG)-Regulatory Scenario
2.4 Oil Country Tubular Goods (OCTG)- Specification and Capability (Tubing & Casing)
2.5 Global Carbon-Steel Industry Analysis
3. Global Overview of Oil Country Tubular Goods (OCTG) Market
3.1 Regional Overview of Oil Country Tubular Goods (OCTG) Market 21028-2028
3.2 Global Oil Country Tubular Goods (OCTG) Market Drivers and Restraints
4. Global Oil Country Tubular Goods (OCTG) Submarkets Forecast 2019-2029
4.1 Global Oil Country Tubular Goods (OCTG) Submarkets Forecast, by Grade 2019-2029
4.1.1 Global Oil Country Tubular Goods (OCTG) Market, by API Forecasts 2019-2029
4.1.1.1 Global Oil Country Tubular Goods (OCTG) Market, by API Drivers & Restraints
4.1.2 Global Oil Country Tubular Goods (OCTG) Market, by Premium Forecasts 2019-2029
4.1.2.1 Global Oil Country Tubular Goods (OCTG) Market, by Premium Driver & Restraints
4.1.3 Global Oil Country Tubular Goods (OCTG) Market- Comparison Matrix (Solution Type VS Region)
4.2 Global Oil Country Tubular Goods (OCTG) Submarkets Forecast, by Application 2019-2029
4.2.1 Global Oil Country Tubular Goods (OCTG) Market, by Onshore Forecasts 2019-2029
4.2.1.1 Global Oil Country Tubular Goods (OCTG) Market, by Onshore Drivers & Restraints
4.2.2 Global Oil Country Tubular Goods (OCTG) Market, by Offshore Forecasts 2019-2029
4.2.2.1 Global Oil Country Tubular Goods (OCTG) Market, by Offshore Drivers & Restraints
4.2.3 Global Oil Country Tubular Goods (OCTG) Market- Comparison Matrix (Application VS Region)
4.3 Global Oil Country Tubular Goods (OCTG) Submarkets Forecast, by Type 2019-2029
4.3.1 Global Oil Country Tubular Goods (OCTG) Market, by Seamless Forecasts 2019-2029
4.3.1.1 Global Oil Country Tubular Goods (OCTG) Market, by Seamless Drivers & Restraints
4.3.2 Global Oil Country Tubular Goods (OCTG) Market, by Welded Forecasts 2019-2029
4.3.2.1 Global Oil Country Tubular Goods (OCTG) Market, by Welded Drivers & Restraints
4.3.3 Global Oil Country Tubular Goods (OCTG) Market- Comparison Matrix (Type VS Region)
5. Leading Nations in Oil Country Tubular Goods (OCTG) Market 2019-2029
5.1 U.S. Oil Country Tubular Goods (OCTG) Market Forecast 2019-2029
5.1.1 U.S. Oil Country Tubular Goods (OCTG) Submarket Forecast 2019-2029
5.1.1.1 U.S. Oil Country Tubular Goods (OCTG) Market Forecast by Grade 2019-2029
5.1.1.2 U.S. Oil Country Tubular Goods (OCTG) Market Forecast by Application 2019-2029
5.1.1.3 U.S. Oil Country Tubular Goods (OCTG) Market Forecast by Type 2019-2029
5.2 Canada Oil Country Tubular Goods(OCTG) Market Forecast 2019-2029
5.2.1 Canada Oil Country Tubular Goods (OCTG) Submarket Forecast 2019-2029
5.2.1.1 Canada Oil Country Tubular Goods (OCTG) Market Forecast by Grade 2019-2029
5.2.1.2 Canada Oil Country Tubular Goods (OCTG) Market Forecast by Application 2019-2029
5.2.1.3 Canada Oil Country Tubular Goods (OCTG) Market Forecast by Type 2019-2029
5.3 Russia Oil Country Tubular Goods(OCTG) Market Forecast 2019-2029
5.3.1 Russia Oil Country Tubular Goods (OCTG) Submarket Forecast 2019-2029
5.3.1.1 Russia Oil Country Tubular Goods (OCTG) Market Forecast by Grade 2019-2029
5.3.1.2 Russia Oil Country Tubular Goods (OCTG) Market Forecast by Application 2019-2029
5.3.1.3 Russia Oil Country Tubular Goods (OCTG) Market Forecast by Type 2019-2029
5.4 China Oil Country Tubular Goods(OCTG) Market Forecast 2019-2029
5.4.1 China Oil Country Tubular Goods (OCTG) Submarket Forecast 2019-2029
5.4.1.1 China Oil Country Tubular Goods (OCTG) Market Forecast by Grade 2019-2029
5.4.1.2 China Oil Country Tubular Goods (OCTG) Market Forecast by Application 2019-2029
5.4.1.3 China Oil Country Tubular Goods (OCTG) Market Forecast by Type 2019-2029
5.5 GCC Oil Country Tubular Goods(OCTG) Market Forecast 2019-2029
5.5.1 GCC Oil Country Tubular Goods (OCTG) Submarket Forecast 2019-2029
5.5.1.1 GCC Oil Country Tubular Goods (OCTG) Market Forecast by Grade 2019-2029
5.5.1.2 GCC Oil Country Tubular Goods (OCTG) Market Forecast by Application 2019-2029
5.5.1.3 GCC Oil Country Tubular Goods (OCTG) Market Forecast by Type 2019-2029
5.6 Rest of the World Oil Country Tubular Goods(OCTG) Market Forecast 2019-2029
5.6.1 Rest of the World Oil Country Tubular Goods (OCTG) Submarket Forecast 2019-2029
5.6.1.1 Rest of the World Oil Country Tubular Goods (OCTG) Market Forecast by Grade 2019-2029
5.6.1.2 Rest of the World Oil Country Tubular Goods (OCTG) Market Forecast by Application 2019-2029
5.6.1.3 Rest of the World Oil Country Tubular Goods (OCTG) Market Forecast by Type 2019-2029
6. PESTEL Analysis of the Oil Country Tubular Goods (OCTG) Market
6.1 Political Impact of OCTG Market
6.2 Economic Impact of OCTG Market
6.3 Social Impact of OCTG Market
6.4 Technological Impact of OCTG Market
6.5 Environmental Impact of OCTG Market
6.6 Legal Impact of OCTG Market
7. Expert Opinion
7.1 Primary Correspondents
7.2 Global OCTG Market Outlook
7.3 Drivers & Restraints
7.4 Dominant Region/Country in the OCTG Market
7.5 Dominant OCTG Type and Grade
7.6 Overall Growth Rate, Globally
8. Leading Companies in Oil Country Tubular Goods Market
8.1 ArcelorMittal
8.1.1 ArcelorMittal Business Overview
8.1.2 ArcelorMittal Recent Developments
8.1.3 ArcelorMittal Business Strategy
8.2 Continental Alloys & Services
8.2.1 Continental Alloys & Services Business Overview
8.2.2 Continental Alloys & Services Business Strategy
8.3 Iljin Steel Co., Ltd.
8.3.1 Iljin Steel Co., Ltd. Business Overview
8.3.2 Iljin Steel Co., Ltd. Business Strategy
8.4 National Oilwell Varco
8.4.1 National Oilwell Varco Business Overview
8.4.2 National Oilwell Varco Recent Developments
8.4.3 National Oilwell Varco Business Strategy
8.5 Nippon Steel & Sumitomo Metal Corporation
8.5.1 Nippon Steel & Sumitomo Metal Corporation Business Overview
8.5.2 Nippon Steel & Sumitomo Metal Corporation Recent Developments
8.5.3 Nippon Steel & Sumitomo Metal Corporation Business Strategy
8.6 Tenaris S.A
8.6.1 Tenaris S.A Business Overview
8.6.2 Tenaris S.A Recent Developments
8.6.3 Tenaris S.A Business Strategy
8.7 Tianjin Pipe Corporation
8.7.1 Tianjin Pipe Corporation Business Overview
8.7.2 Tianjin Pipe Corporation Recent Developments
8.7.3 Tianjin Pipe Corporation Business Strategy
8.8 TMK
8.8.1 TMK Business Overview
8.8.2 TMK Business Strategy
8.9 United States Steel
8.9.1 United States Steel Business Overview
8.9.2 United States Steel Recent Developments
8.9.3 United States Steel Business Strategy
8.10 Vallourec
8.10.1 Vallourec Business Overview
8.10.2 Vallourec Recent Developments
8.10.3 Vallourec Business Strategy
9. Conclusion & Recommendations
9.1 Recommendations
10. Glossary
Associated Visiongain Reports
Visiongain Report Sales Order Form
Appendix A
About Visiongain
Appendix B
Visiongain report evaluation form
List of Tables
Table 2.1 OCTG Seamless Casing Size Capability
Table 2.2 OCTG Seamless Tubing Size Capability
Table 2.3 World-wide Drill Rigs Count, 2018
Table 3.1 Global Oil Country Tubular Goods (OCTG) Market Forecast 2019-2029 (MT, $ bn, AGR %, CAGR %, Cumulative)
Table 3.2 Global Oil Country Tubular Goods (OCTG) Market by Regional Forecast 2019-2029 (MT, AGR %, CAGR %, Cumulative)
Table 3.3 Global Oil Country Tubular Goods (OCTG) Market by Regional Forecast 2019-2029 ($mn, AGR %, CAGR %, Cumulative)
Table 3.4 Global Oil Country Tubular Goods (OCTG) Market Drivers and Restraints
Table 4.1 Global Oil Country Tubular Goods (OCTG) Market, by Grade Type Forecast 2019-2029 ($bn, AGR %, Cumulative)
Table 4.2 Global Oil Country Tubular Goods (OCTG) Market, by API Forecast 2019-2029 (MT, $ bn, AGR %, CAGR %, Cumulative)
Table 4.3 Global Oil Country Tubular Goods (OCTG) Market, by API Drivers & Restraints
Table 4.4 Global Oil Country Tubular Goods (OCTG) Market, by Premium Forecast 2019-2029 (MT, $ bn, AGR %, CAGR %, Cumulative)
Table 4.5 Global Oil Country Tubular Goods (OCTG) Market, by Premium Drivers and Restraints
Table 4.6 Global Oil Country Tubular Goods (OCTG) Market, by Application Forecast 2019-2029 ($bn, AGR %, Cumulative)
Table 4.7 Global Oil Country Tubular Goods (OCTG) Market, by Onshore Forecast 2018-2029 (MT, $ bn, AGR %, CAGR %, Cumulative)
Table 4.8 Global Oil Country Tubular Goods (OCTG) Market, by Onshore Drivers & Restraints
Table 4.9 Global Oil Country Tubular Goods (OCTG) Market, by Offshore Forecast 2018-2029 (MT, $ bn, AGR %, CAGR %, Cumulative)
Table 4.10 Global Oil Country Tubular Goods (OCTG) Market, by Offshore Drivers and Restraints
Table 4.11 Global Oil Country Tubular Goods (OCTG) Market, by Type Forecast 2019-2029 ($bn, AGR %, Cumulative)
Table 4.12 Global Oil Country Tubular Goods (OCTG) Market, by Seamless Forecast 2019-2029 (MT, $ bn, AGR %, CAGR %, Cumulative)
Table 4.13 Global Oil Country Tubular Goods (OCTG) Market, by Seamless Drivers & Restraints
Table 4.14 Global Oil Country Tubular Goods (OCTG) Market, by Welded Forecast 2018-2029 (MT, $ bn, AGR %, CAGR %, Cumulative)
Table 4.15 Global Oil Country Tubular Goods (OCTG) Market, by Welded Drivers and Restraints
Table 5.1 Global Oil Country Tubular Goods (OCTG) Market by Country Forecast 2019-2029 Volume (MT), AGR %, Cumulative)
Table 5.2 Global Oil Country Tubular Goods (OCTG) Market by Country Forecast 2019-2029 (Revenue($bn), AGR %, Cumulative)
Table 5.3 U.S. Oil Country Tubular Goods (OCTG) Market, by Seamless Forecast 2019-2029 (MT, $ bn, AGR %, CAGR %, Cumulative)
Table 5.4 U.S. Oil Country Tubular Goods (OCTG) Market, by Grade Forecast 2019-2029 ($bn, AGR %, Cumulative)
Table 5.5 U.S. Oil Country Tubular Goods (OCTG) Market, by Application Forecast 2019-2029 ($bn, AGR %, Cumulative)
Table 5.6 U.S. Oil Country Tubular Goods (OCTG) Market, by Type Forecast 2019-2029 ($bn, AGR %, Cumulative)
Table 5.7 Canada Oil Country Tubular Goods (OCTG) Market, Forecast 2019-2029 (MT, $ bn, AGR %, CAGR %, Cumulative)
Table 5.8 Canada Oil Country Tubular Goods (OCTG) Market, by Grade Forecast 2019-2029 ($bn, AGR %, Cumulative)
Table 5.9 Canada Oil Country Tubular Goods (OCTG) Market, by Application Forecast 2019-2029 ($bn, AGR %, Cumulative)
Table 5.10 Canada Oil Country Tubular Goods (OCTG) Market, by Type Forecast 2019-2029 ($bn, AGR %, Cumulative)
Table 5.11 Russia Oil Country Tubular Goods (OCTG) Market, Forecast 2019-2029 (MT, $ bn, AGR %, CAGR %, Cumulative)
Table 5.12 Russia Oil Country Tubular Goods (OCTG) Market, by Grade Forecast 2019-2029 ($bn, AGR %, Cumulative)
Table 5.13 Russia Oil Country Tubular Goods (OCTG) Market, by Application Forecast 2019-2029 ($bn, AGR %, Cumulative)
Table 5.14 Russia Oil Country Tubular Goods (OCTG) Market, by Type Forecast 2019-2029 ($bn, AGR %, Cumulative)
Table 5.15 China Oil Country Tubular Goods (OCTG) Market, Forecast 2019-2029 (MT, $ bn, AGR %, CAGR %, Cumulative)
Table 5.16 China Oil Country Tubular Goods (OCTG) Market, by Grade Forecast 2019-2029 ($bn, AGR %, Cumulative)
Table 5.17 China Oil Country Tubular Goods (OCTG) Market, by Application Forecast 2019-2029 ($bn, AGR %, Cumulative)
Table 5.18 China Oil Country Tubular Goods (OCTG) Market, by Type Forecast 2019-2029 ($bn, AGR %, Cumulative)
Table 5.19 GCC Oil Country Tubular Goods (OCTG) Market, Forecast 2019-2029 (MT, $ bn, AGR %, CAGR %, Cumulative)
Table 5.20 GCC Oil Country Tubular Goods (OCTG) Market, by Grade Forecast 2019-2029 ($bn, AGR %, Cumulative)
Table 5.21 GCC Oil Country Tubular Goods (OCTG) Market, by Application Forecast 2019-2029 ($bn, AGR %, Cumulative)
Table 5.22 GCC Oil Country Tubular Goods (OCTG) Market, by Type Forecast 2019-2029 ($bn, AGR %, Cumulative)
Table 5.23 Rest of the World Oil Country Tubular Goods (OCTG) Market, Forecast 2019-2029 (MT, $ bn, AGR %, CAGR %, Cumulative)
Table 5.24 Rest of the World Oil Country Tubular Goods (OCTG) Market, by Grade Forecast 2019-2029 ($bn, AGR %, Cumulative)
Table 5.25 Rest of the World Oil Country Tubular Goods (OCTG) Market, by Application Forecast 2019-2029 ($bn, AGR %, Cumulative)
Table 5.26 Rest of the World Oil Country Tubular Goods (OCTG) Market, by Type Forecast 2019-2029 ($bn, AGR %, Cumulative)
Table 6.1 PESTEL Analysis, OCTG Market
Table 8.1 ArcelorMittal Profile 2017(Market Entry, Public/Private, Headquarters, No. of Employees, Total Company Revenue US$bn, Change in Revenue, Geography, Key Markets, Listed on, Products/Services)
Table 8.2 ArcelorMittal Total Company Sales 2013-2017 ($ bn, AGR %)
Table 8.3 Continental Alloys & Services Profile 2017 (Market Entry, Public/Private, Headquarters, Revenue ($m) 2017, Geography, Key Market, Listed on, Products/Services)
Table 8.4 Iljin Steel Co., Ltd. Profile 2017 (Market Entry, Public/Private, Headquarters, Geography, Key Market, Products/Services)
Table 8.5 National Oilwell Varco Profile 2017 (Market Entry, Public/Private, Headquarters, No. of Employees, Total Company Revenue US$bn, Change in Revenue, Geography, Key Markets, Listed on, Products/Services)
Table 8.6 National Oilwell Varco Total Company Sales 2013-2017 ($ bn, AGR %)
Table 8.7 Nippon Steel & Sumitomo Metal Corporation Profile 2017 (Market Entry, Public/Private, Headquarters, No. of Employees, Total Company Revenue US$bn, Change in Revenue, Geography, Key Markets, Listed on, Products/Services)
Table 8.8 Nippon Steel & Sumitomo Metal Corporation Total Company Sales 2013-2017 ($ bn, AGR %)
Table 8.9 Tenaris S.A Profile 2017 (Market Entry, Public/Private, Headquarters, No. of Employees, Total Company Revenue US$bn, Change in Revenue, Geography, Key Markets, Listed on, Products/Services)
Table 8.10 Tenaris S.A Total Company Sales 2013-2017 ($ bn, AGR %)
Table 8.11 Tianjin Pipe Corporation Profile 2017 (Market Entry, Public/Private, Headquarters, Geography, Key Markets, Listed on, Products/)
Table 8.12 TMK Profile 2017 (Market Entry, Public/Private, Headquarters, No. of Employees, Total Company Revenue $bn, Change in Revenue, Geography, Key Markets, Listed on, Products/Services)
Table 8.13 TMK’s Premium Projects, contract term and products supplied in Oil Country Tubular Goods Market
Table 8.14 TMK, Total Company Sales 2013-2017 ($bn, AGR %)
Table 8.15 United States Steel Profile 2017 (Market Entry, Public/Private, Headquarters, No. of Employees, Total Company Revenue US$bn, Change in Revenue, Geography, Key Markets, Listed on, Products/Services)
Table 8.16 United States Steel Total Company Sales 2013-2017 ($ bn, AGR %)
Table 8.17 Vallourec Profile 2017 (Market Entry, Public/Private, Headquarters, No. of Employees, Total Company Revenue US$bn, Change in Revenue, Geography, Key Markets, Listed on, Products/Services)
Table 8.18 Vallourec Total Company Sales 2013-2017 ($ bn, AGR %)
Table 8.19 Other Companies Involved in Tubular Goods
List of Figures
Figure 2.1 Global Oil Country Tubular Goods (OCTG)Market Segmentation Overview
Figure 2.2 World-wide Steel Production Statistics (Million Tons), 2008-2017
Figure 2.3 Crude Steel Production Statistics, by Top 25 Companies (Million Tons), 2017
Figure 3.1 Global Oil Country Tubular Goods (OCTG) Market Forecast 2019-2029 (MT, AGR%)
Figure 3.2 Global Oil Country Tubular Goods (OCTG) Market Forecast 2019-2029 ($ bn, AGR %)
Figure 3.3 Global Oil Country Tubular Goods (OCTG), by Application Submarket Forecast 2019-2029 (MT)
Figure 3.4 Regional Oil Country Tubular Goods (OCTG) Market Forecast 2019-2029 ($mn)
Figure 3.5 Global Oil Country Tubular Goods (OCTG) Market by Regional % Share Forecast 2019, 2024, 2029 (Revenue)
Figure 3.6 Global Oil Country Tubular Goods (OCTG) Forecast 2019-2029, by Region (AGR %)
Figure 4.1 Global Oil Country Tubular Goods (OCTG), by Grade Submarket Forecast 2019-2029 (MT)
Figure 4.2 Global Oil Country Tubular Goods (OCTG), by Grade Submarket Forecast 2019-2029 ($bn)
Figure 4.3 Global Oil Country Tubular Goods (OCTG) Market by Grade (Revenue) Share Forecast 2019, 2024, 2029 (% Share)
Figure 4.4 Global Oil Country Tubular Goods (OCTG) Market, By API Forecast 2019-2029 (MT, AGR%)
Figure 4.5 Global Oil Country Tubular Goods (OCTG) Market, by API Forecast 2019-2029 ($ bn, AGR %)
Figure 4.6 Oil Country Tubular Goods (OCTG) Market, By Premium Forecast 2019-2029 (MT, AGR%)
Figure 4.7 Oil Country Tubular Goods (OCTG) Market, By Premium Forecast 2019-2029 ($ bn, AGR%)
Figure 4.8 Global Oil Country Tubular Goods (OCTG) Market, Comparison Matrix, by Solution Type VS Region (Comparison Matric)
Figure 4.9 Global Oil Country Tubular Goods (OCTG), by Application Submarket Forecast 2019-2029 (MT)
Figure 4.10 Global Oil Country Tubular Goods (OCTG), by Application Submarket Forecast 2019-2029 ($bn)
Figure 4.11 Global Oil Country Tubular Goods (OCTG) Market by Application (Revenue) Share Forecast 2019, 2024, 2029 (% Share)
Figure 4.12 Global Oil Country Tubular Goods (OCTG) Market, By Onshore Forecast 2019-2029 (MT, AGR%)
Figure 4.13 Global Oil Country Tubular Goods (OCTG) Market, by Onshore Forecast 2019-2029 ($ bn, AGR %)
Figure 4.14 Oil Country Tubular Goods (OCTG) Market, By Offshore Forecast 2019-2029 (MT, AGR%)
Figure 4.15 Oil Country Tubular Goods (OCTG) Market, By Offshore Forecast 2019-2029 ($ bn, AGR%)
Figure 4.16 Global Oil Country Tubular Goods (OCTG) Market, Comparison Matrix, by Application VS Region (Comparison Matric)
Figure 4.17 Global Oil Country Tubular Goods (OCTG), by Type Submarket Forecast 2019-2029 (MT)
Figure 4.18 Global Oil Country Tubular Goods (OCTG), by Type Submarket Forecast 2019-2029 ($bn)
Figure 4.19 Global Oil Country Tubular Goods (OCTG) Market by Type (Revenue) Share Forecast 2019, 2024, 2029 (% Share)
Figure 4.20 Global Oil Country Tubular Goods (OCTG) Market, By Seamless Forecast 2019-2029 (MT, AGR%)
Figure 4.21 Global Oil Country Tubular Goods (OCTG) Market, by Seamless Forecast 2019-2029 ($ bn, AGR %)
Figure 4.22 Oil Country Tubular Goods (OCTG) Market, By Welded Forecast 2019-2029 (MT, AGR%)
Figure 4.23 Oil Country Tubular Goods (OCTG) Market, By Welded Forecast 2019-2029 ($ bn, AGR%)
Figure 4.24 Global Oil Country Tubular Goods (OCTG) Market, Comparison Matrix, by Type VS Region (Comparison Matric)
Figure 5.1 Global Oil Country Tubular Goods (OCTG) Market Forecast by Leading Nations, Volume (MT)
Figure 5.2 Global Oil Country Tubular Goods (OCTG) Market Forecast by Leading Nations (AGR), by Revenue ($ bn)
Figure 5.3 Global Oil Country Tubular Goods (OCTG) Market Forecast by Leading Nations ($ bn)
Figure 5.4 Leading Country/Regional Oil Country Tubular Goods (OCTG) Market Share Forecast 2019 (% Share)
Figure 5.5 Leading Country/Regional Oil Country Tubular Goods (OCTG) Market Share Forecast 2024 (% Share)
Figure 5.6 Leading Country/Regional Oil Country Tubular Goods (OCTG) Market Share Forecast 2029 (% Share)
Figure 5.7 U.S. Oil Country Tubular Goods (OCTG) Market, By Seamless Forecast 2019-2029 (MT, AGR%)
Figure 5.8 U.S. Oil Country Tubular Goods (OCTG) Market Forecast 2019-2029 ($bn, AGR%)
Figure 5.9 U.S. Oil Country Tubular Goods (OCTG) Market Share Forecast 2019, 2024, 2029 (% Share)
Figure 5.10 U.S. Oil Country Tubular Goods (OCTG), by Grade Submarket Forecast 2019-2029 (MT)
Figure 5.11 U.S. Oil Country Tubular Goods (OCTG) Market Forecast 2019-2029, by Grade ($bn, AGR%)
Figure 5.12 U.S. Oil Country Tubular Goods (OCTG) Market Share Forecast 2019, 2024, 2029 (% Share), by Grade, Revenue ($ bn)
Figure 5.13 U.S. Oil Country Tubular Goods (OCTG), by Application Submarket Forecast 2019-2029 (MT)
Figure 5.14 U.S. Oil Country Tubular Goods (OCTG) Market Forecast 2019-2029, by Application ($bn, AGR%)
Figure 5.15 U.S. Oil Country Tubular Goods (OCTG) Market Share Forecast 2019, 2024, 2029 (% Share), by Application
Figure 5.16 U.S. Oil Country Tubular Goods (OCTG), by Grade Submarket Forecast 2019-2029 (MT)
Figure 5.17 U.S. Oil Country Tubular Goods (OCTG) Market Forecast 2019-2029, by Type ($bn, AGR%)
Figure 5.18 U.S. Oil Country Tubular Goods (OCTG) Market Share Forecast 2019, 2024, 2029 (% Share), by Type
Figure 5.19 Canada Oil Country Tubular Goods (OCTG) Market, By Seamless Forecast 2019-2029 (MT, AGR%)
Figure 5.21 Canada Oil Country Tubular Goods (OCTG) Market Share Forecast 2019, 2024, 2029 (% Share, by Revenue ($ bn)
Figure 5.22 Canada Oil Country Tubular Goods (OCTG), by Grade Submarket Forecast 2019-2029 (MT)
Figure 5.23 Canada Oil Country Tubular Goods (OCTG) Market Forecast 2019-2029, by Grade ($bn, AGR%)
Figure 5.24 Canada Oil Country Tubular Goods (OCTG) Market Share Forecast 2019, 2024, 2029 (% Share), by Grade, Revenue ($ bn)
Figure 5.25 Canada Oil Country Tubular Goods (OCTG), by Application Submarket Forecast 2019-2029 (MT)
Figure 5.26 Canada Oil Country Tubular Goods (OCTG) Market Forecast 2019-2029, by Application ($bn, AGR%)
Figure 5.27 Canada Oil Country Tubular Goods (OCTG) Market Share Forecast 2019, 2024, 2029 (% Share), by Application
Figure 5.28 Canada Oil Country Tubular Goods (OCTG), by Grade Submarket Forecast 2019-2029 (MT)
Figure 5.29 Canada Oil Country Tubular Goods (OCTG) Market Forecast 2019-2029, by Type ($bn, AGR%)
Figure 5.30 Canada Oil Country Tubular Goods (OCTG) Market Share Forecast 2019, 2024, 2029 (% Share), by Type
Figure 5.31 Russia Oil Country Tubular Goods (OCTG) Market, By Seamless Forecast 2019-2029 (MT, AGR%)
Figure 5.32 Russia Oil Country Tubular Goods (OCTG) Market Forecast 2019-2029 ($bn, AGR%)
Figure 5.33 Russia Oil Country Tubular Goods (OCTG) Market Share Forecast 2019, 2024, 2029 (% Share, by Revenue ($ bn)
Figure 5.34 Russia Oil Country Tubular Goods (OCTG), by Grade Submarket Forecast 2019-2029 (MT)
Figure 5.35 Russia Oil Country Tubular Goods (OCTG) Market Forecast 2019-2029, by Grade ($bn, AGR%)
Figure 5.36 Russia Oil Country Tubular Goods (OCTG) Market Share Forecast 2019, 2024, 2029 (% Share), by Grade, Revenue ($ bn)
Figure 5.37 Russia Oil Country Tubular Goods (OCTG), by Application Submarket Forecast 2019-2029 (MT)
Figure 5.38 Russia Oil Country Tubular Goods (OCTG) Market Forecast 2019-2029, by Application ($bn, AGR%)
Figure 5.39 Russia Oil Country Tubular Goods (OCTG) Market Share Forecast 2019, 2024, 2029 (% Share), by Application
Figure 5.40 Russia Oil Country Tubular Goods (OCTG), by Grade Submarket Forecast 2019-2029 (MT)
Figure 5.41 Russia Oil Country Tubular Goods (OCTG) Market Forecast 2019-2029, by Type ($bn, AGR%)
Figure 5.42 Russia Oil Country Tubular Goods (OCTG) Market Share Forecast 2019, 2024, 2029 (% Share), by Type
Figure 5.43 China Oil Country Tubular Goods (OCTG) Market, By Seamless Forecast 2019-2029 (MT, AGR%)
Figure 5.44 China Oil Country Tubular Goods (OCTG) Market Forecast 2019-2029 ($bn, AGR%)
Figure 5.45 China Oil Country Tubular Goods (OCTG) Market Share Forecast 2019, 2024, 2029 (% Share, by Revenue ($ bn)
Figure 5.46 China Oil Country Tubular Goods (OCTG), by Grade Submarket Forecast 2019-2029 (MT)
Figure 5.47 China Oil Country Tubular Goods (OCTG) Market Forecast 2019-2029, by Grade ($bn, AGR%)
Figure 5.48 China Oil Country Tubular Goods (OCTG) Market Share Forecast 2019, 2024, 2029 (% Share), by Grade, Revenue ($ bn)
Figure 5.49 China Oil Country Tubular Goods (OCTG), by Application Submarket Forecast 2019-2029 (MT)
Figure 5.50 China Oil Country Tubular Goods (OCTG) Market Forecast 2019-2029, by Application ($bn, AGR%)
Figure 5.51 China Oil Country Tubular Goods (OCTG) Market Share Forecast 2019, 2024, 2029 (% Share), by Application
Figure 5.52 China Oil Country Tubular Goods (OCTG), by Grade Submarket Forecast 2019-2029 (MT)
Figure 5.53 China Oil Country Tubular Goods (OCTG) Market Forecast 2019-2029, by Type ($bn, AGR%)
Figure 5.54 China Oil Country Tubular Goods (OCTG) Market Share Forecast 2019, 2024, 2029 (% Share), by Type
Figure 5.55 GCC Oil Country Tubular Goods (OCTG) Market, By Seamless Forecast 2019-2029 (MT, AGR%)
Figure 5.56 GCC Oil Country Tubular Goods (OCTG) Market Forecast 2019-2029 ($bn, AGR%)
Figure 5.57 GCC Oil Country Tubular Goods (OCTG) Market Share Forecast 2019, 2024, 2029 (% Share, by Revenue ($ bn)
Figure 5.58 GCC Oil Country Tubular Goods (OCTG), by Grade Submarket Forecast 2019-2029 (MT)
Figure 5.59 GCC Oil Country Tubular Goods (OCTG) Market Forecast 2019-2029, by Grade ($bn, AGR%)
Figure 5.60 GCC Oil Country Tubular Goods (OCTG) Market Share Forecast 2019, 2024, 2029 (% Share), by Grade, Revenue ($ bn)
Figure 5.61 GCC Oil Country Tubular Goods (OCTG), by Application Submarket Forecast 2019-2029 (MT)
Figure 5.62 GCC Oil Country Tubular Goods (OCTG) Market Forecast 2019-2029, by Application ($bn, AGR%)
Figure 5.63 GCC Oil Country Tubular Goods (OCTG) Market Share Forecast 2019, 2024, 2029 (% Share), by Application
Figure 5.64 GCC Oil Country Tubular Goods (OCTG), by Grade Submarket Forecast 2019-2029 (MT)
Figure 5.65 GCC Oil Country Tubular Goods (OCTG) Market Forecast 2019-2029, by Type ($bn, AGR%)
Figure 5.66 GCC Oil Country Tubular Goods (OCTG) Market Share Forecast 2019, 2024, 2029 (% Share), by Type
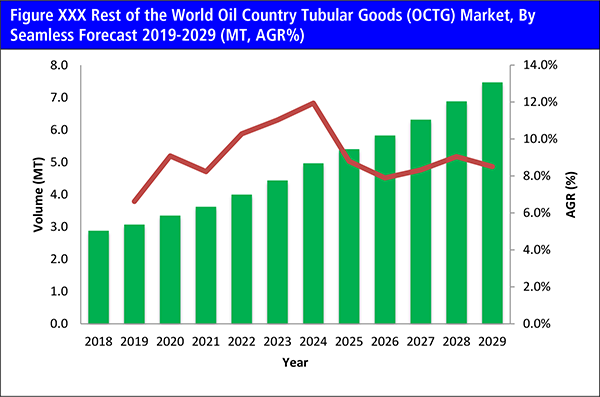
Figure 5.67 Rest of the World Oil Country Tubular Goods (OCTG) Market, By Seamless Forecast 2019-2029 (MT, AGR%)
Figure 5.68 Rest of the World Oil Country Tubular Goods (OCTG) Market Forecast 2019-2029 ($bn, AGR%)
Figure 5.69 Rest of the World Oil Country Tubular Goods (OCTG) Market Share Forecast 2019, 2024, 2029 (% Share, by Revenue ($ bn)
Figure 5.70 Rest of the World Oil Country Tubular Goods (OCTG), by Grade Submarket Forecast 2019-2029 (MT)
Figure 5.71 Rest of the World Oil Country Tubular Goods (OCTG) Market Forecast 2019-2029, by Grade ($bn, AGR%)
Figure 5.72 Rest of the World Oil Country Tubular Goods (OCTG) Market Share Forecast 2019, 2024, 2029 (% Share), by Grade, Revenue ($ bn)
Figure 5.73 Rest of the World Oil Country Tubular Goods (OCTG), by Application Submarket Forecast 2019-2029 (MT)
Figure 5.74 Rest of the World Oil Country Tubular Goods (OCTG) Market Forecast 2019-2029, by Application ($bn, AGR%)
Figure 5.75 Rest of the World Oil Country Tubular Goods (OCTG) Market Share Forecast 2019, 2024, 2029 (% Share), by Application
Figure 5.76 Rest of the World Oil Country Tubular Goods (OCTG), by Grade Submarket Forecast 2019-2029 (MT)
Figure 5.77 Rest of the World Oil Country Tubular Goods (OCTG) Market Forecast 2019-2029, by Type ($bn, AGR%)
Figure 5.78 Rest of the World Oil Country Tubular Goods (OCTG) Market Share Forecast 2019, 2024, 2029 (% Share), by Type
Figure 8.1 ArcelorMittal Revenue, ($bn & AGR %), Y-o-Y Revenue Growth, 2013-2017
Figure 8.2 ArcelorMittal % Revenue Share, by Products, 2017
Figure 8.3 ArcelorMittal % Revenue Share, by Regional Segment, 2017
Figure 8.4 National Oilwell Varco Revenue, ($bn& AGR %), Y-o-Y Revenue Growth, 2013-2017
Figure 8.5 National Oilwell Varco % Revenue Share, by Business Segment, 2017
Figure 8.6 National Oilwell Varco % Revenue Share, by Regional Segment, 2017
Figure 8.7 Nippon Steel & Sumitomo Metal Corporation Revenue, ($bn& AGR %), Y-o-Y Revenue Growth, 2013-2017
Figure 8.8 Nippon Steel & Sumitomo Metal Corporation % Revenue Share, by Business Segment, 2017
Figure 8.9 Nippon Steel & Sumitomo Metal Corporation % Revenue Share, by Regional Segment, 2017
Figure 8.10 Tenaris S.A Revenue, ($bn& AGR %), Y-o-Y Revenue Growth, 2013-2017
Figure 8.11 Tenaris S.A % Revenue Share, by Business Segment, 2017
Figure 8.12 Tenaris S.A % Revenue Share, by Regional Segment, 2017
Figure 8.13 TMK OCTG Consumption (million tonnes) in Russia and the United States
Figure 8.14 TMK, Company Revenue, ($bn& AGR %), 2013-2017
Figure 8.15 TMK, % Revenue Share, by Regional Segment, 2017
Figure 8.16 TMK, % Revenue Share, by Product, 2017
Figure 8.17 United States Steel Revenue, ($bn & AGR %), Y-o-Y Revenue Growth, 2013-2017
Figure 8.18 United States Steel % Revenue Share, by Business Segment, 2017
Figure 8.19 United States Steel % Revenue Share, by Regional Segment, 2017
Figure 8.20 United States Steel % Revenue Share, by Product, 2017
Figure 8.21 Vallourec Revenue, ($bn& AGR %), Y-o-Y Revenue Growth, 2013-2017
Figure 8.22 Vallourec % Revenue Share, by Business Segment, 2017
Figure 8.23 Vallourec % Revenue Share, by Regional Segment, 2017
Figure 9.1 Global Oil Country Tubular Goods (OCTG) Market Forecast 2019-2029 ($ mn, MT, AGR %)
Ansteel Group
ArcelorMittal
Benxi Steel
Bison Stainless Tube
China Baowu Group
China Steel Corporation
Continental Alloys & Services
DYC
Exel
ExxonMobil
Fangda Steel
Furukawa Electric
Gerdau
GlobalMask
Globe Mechanical
HBIS Group
Hibernia Management and Development Company Limited
Husky Energy
Hyundai Steel
Iljin Steel Co.
IMIDRO
Insul-Pipe Systems
Interpipe
JFE Steel
Jianlong Group
JSW Steel
Maanshan Steel
Metal Works Corp
National Oilwell Varco
Naylor Pipe Co.
Nippon Steel & Sumutomo Metal Corporation
NLMK
NS SMC
NSSMC Group
Nucor Corporation
Parker Llegris
Perma-Pipe
POSCO
Rexroth (Bosch Group)
Rizhao Steel
Royal Dutch Shell
SAIL
Saudi Aramco
Schaeffler
Shagang Group
Shandong Steel Group
Shengli Oil & Gas Pipe Holdings Limited
Shougang Group
Soconord Corp.
Sound Seal
Steel Tubes India
Suncor Energy
SuperiorTube Company Inc.
Tata Steel Group
Tenaris
Tianjin Pipe Corporation
TMK
Trelleborg
Trico
Tube Methods Inc
United States Steel
Valin Group
Vallourec
Van Leeuwn
Victrex USA Inc
Organisations Mentioned
Australian Government
Canada’s Oil Sands Innovation Alliance (COSIA)
China National Offshore Oil Company (CNOOC)
Government of Newfoundland and Labrador
International Energy Agency (IEA)
World Wide Fund for Nature (WWF)
Download sample pages
Complete the form below to download your free sample pages for Oil Country Tubular Goods (OCTG) Market Forecast 2019-2029
Related reports
-

Deepwater Drilling Market Report 2018-2028
The global deepwater drilling market is calculated to see spending of $30.30 bn in 2018. Excessive supply of oil worldwide...
Full DetailsPublished: 26 March 2018 -

Natural Gas Hydraulic Fracturing (Fracking) Market Report 2019-2029
Natural Gas Hydraulic Fracturing market worth $27.9 billion in 2019....Full DetailsPublished: 25 September 2019 -

Combined Heat & Power (CHP) Installation Market Forecast 2019-2029
The $800 million combined heat and power installation sector is expected to flourish in the next few years because of...Full DetailsPublished: 10 January 2019 -

Molten Salt Reactors Market Report 2021-2031
The aim of this report is to provide detailed market, technology and industry analyses to help readers quantify and qualify...Full DetailsPublished: 12 February 2021 -

Thermochromic Pigment Market Report 2020-2030
Thermochromic materials are extensively being used in several industrial domains to regulate heat reactions and temperature variation that measures distribution...
Full DetailsPublished: 01 January 1970 -

Thermal Enhanced Oil Recovery (EOR) Market Report 2018-2028
In this updated report, you find 130+ in-depth tables, charts and graphs all unavailable elsewhere. ...Full DetailsPublished: 12 October 2018 -

Offshore Wind Power Market Report 2018-2028
Visiongain has calculated that the global offshore wind market will see capital expenditure (CAPEX) of $24,448m in 2018, including spending...Full DetailsPublished: 14 September 2018 -

Oil Refineries Market Report 2018-2028
With the recent upswing in oil prices these margins are again rising and Visiongain expects the value of the refinery...Full DetailsPublished: 24 July 2018 -

The Airborne Geophysical Services Market Forecast 2019-2029
The airborne geophysical services market entails high capital investments along with high risk. The risk involved is comparatively high owing...Full DetailsPublished: 19 March 2019 -

Pipeline Leak Detection Market of the Oil and Gas Industry 2018-2028
The growing environmental concerns has led Visiongain to publish this timely report. The pipeline leak detection market is expected to...
Full DetailsPublished: 01 May 2018
Download sample pages
Complete the form below to download your free sample pages for Oil Country Tubular Goods (OCTG) Market Forecast 2019-2029
Do you have any custom requirements we can help you with?
Any specific country, geo region, market segment or specific company information?
Email us today, we can discuss your needs and see how we can help: jamie.roberts@visiongain.com
Would you like a free report overview of the report of your choice?
If so, please drop an email to Jamie Roberts stating your chosen report title to jamie.roberts@visiongain.com
Visiongain energy reports are compiled using a broad and rich mixture of both primary and secondary information to produce an overall industry outlook. In order to provide our clients with the best product possible product, we do not rely on any one single source of information. Visiongain analysts reach out to market-leading vendors and industry experts where possible but also review a wealth of financial data and product information from a vast range of sources. To find out more about our reports methodology, please email jamie.roberts@visiongain.com
Would you like to get the latest Visiongain energy reports catalogue?
What are the dynamic growth sectors? where are the regional business opportunities?
Which technologies will prevail and who are the leading companies succeeding in these sectors and why?
If you want definitive answers to business critical questions, discover Visiongain’s full range of business intelligence reports.
If so, please email Jamie Roberts on jamie.roberts@visiongain.com or call her today on +44 207 336 6100
“The Visiongain report was extremely insightful and helped us construct our basic go-to market strategy for our solution.”
H.
“F.B has used Visiongain to prepare two separate market studies on the ceramic proppants market over the last 12 months. These reports have been professionally researched and written and have assisted FBX greatly in developing its business strategy and investment plans.”
F.B
“We just received your very interesting report on the Energy Storage Technologies (EST) Market and this is a very impressive and useful document on that subject.”
I.E.N
“Visiongain does an outstanding job on putting the reports together and provides valuable insight at the right informative level for our needs. The EOR Visiongain report provided confirmation and market outlook data for EOR in MENA with the leading countries being Oman, Kuwait and eventually Saudi Arabia.”
E.S
“Visiongain produced a comprehensive, well-structured GTL Market report striking a good balance between scope and detail, global and local perspective, large and small industry segments. It is an informative forecast, useful for practitioners as a trusted and upto-date reference.”
Y.N Ltd
Association of Dutch Suppliers in the Oil & Gas Industry
Society of Naval Architects & Marine Engineers
Association of Diving Contractors
Association of Diving Contractors International
Associazione Imprese Subacquee Italiane
Australian Petroleum Production & Exploration Association
Brazilian Association of Offshore Support Companies
Brazilian Petroleum Institute
Canadian Energy Pipeline
Diving Medical Advisory Committee
European Diving Technology Committee
French Oil and Gas Industry Council
IMarEST – Institute of Marine Engineering, Science & Technology
International Association of Drilling Contractors
International Association of Geophysical Contractors
International Association of Oil & Gas Producers
International Chamber of Shipping
International Shipping Federation
International Marine Contractors Association
International Tanker Owners Pollution Federation
Leading Oil & Gas Industry Competitiveness
Maritime Energy Association
National Ocean Industries Association
Netherlands Oil and Gas Exploration and Production Association
NOF Energy
Norsk olje og gass Norwegian Oil and Gas Association
Offshore Contractors’ Association
Offshore Mechanical Handling Equipment Committee
Oil & Gas UK
Oil Companies International Marine Forum
Ontario Petroleum Institute
Organisation of the Petroleum Exporting Countries
Regional Association of Oil and Natural Gas Companies in Latin America and the Caribbean
Society for Underwater Technology
Society of Maritime Industries
Society of Petroleum Engineers
Society of Petroleum Enginners – Calgary
Step Change in Safety
Subsea UK
The East of England Energy Group
UK Petroleum Industry Association
All the events postponed due to COVID-19.
Latest Energy news
Visiongain Publishes Liquid Biofuels Market Report 2024-2034
The global Liquid Biofuels market was valued at US$90.7 billion in 2023 and is projected to grow at a CAGR of 6.7% during the forecast period 2024-2034.
03 April 2024
Visiongain Publishes Hydrogen Generation Market Report 2024-2034
The global Hydrogen Generation market was valued at US$162.3 billion in 2023 and is projected to grow at a CAGR of 3.7% during the forecast period 2024-2034.
28 March 2024
Visiongain Publishes Biofuel Industry Market Report 2024-2034
The global Biofuel Industry market was valued at US$123.2 billion in 2023 and is projected to grow at a CAGR of 7.6% during the forecast period 2024-2034.
27 March 2024
Visiongain Publishes Lithium-ion Battery Recycling Market Report 2024-2034
The global lithium-ion battery recycling market was valued at US$2.51 billion in 2023 and is projected to grow at a CAGR of 19.7% during the forecast period 2024-2034.
25 March 2024
