Oil refining is typically the sector of the oil industry with the slimmest profit margins due to the expense of the refining process. Refining margins – the value of the refined products a refinery is able to produce minus the price the refiner pays for the crude oil and other fixed and variable costs – were very strong throughout most of the 1990s and for a period in the middle of the last decade, which helped to encourage investment in the industry. However, margins fell substantially during the recent economic recession and the current high price of crude oil is ensuring that margins remain low in many parts of the world. However, with the recent upswing in oil prices these margins are again rising and Visiongain expects the value of the refinery market to be $31 billion in 2018.
In this report, the market is subdivided based on region and the largest countries based on investment into oil refineries in the region. Expenditure in the oil refinery market will be primarily driven by oil prices as when they price is low as it has been for the past few years, refinery margins will be too low, especially for those equipped to deal with heavy oil and so many will scale back production. However, now that oil prices have recovered somewhat to their long-run average, we expect to see a reasonable amount of investment back into this industry.
This new report from visiongain is a fresh market assessment of the oil refinery sector based upon the latest information. This brand-new report contains completely new analysis based on company expenditure (USD$).
Why you should buy the Oil Refineries Market Report 2018-2028: Capex Forecasts For New Build Plants & Upgraded Refinery Infrastructure, Contract / Project Tables Including Regional, Country Outlook & Analysis of Downstream Market Dynamics Plus Profiles Of Leading Companies report:
What is the future for the oil refineries market? Which regions and countries will prosper over the next ten years? Visiongain’s comprehensive analysis contains highly quantitative content delivering solid conclusions benefiting your analysis and illustrates new opportunities and potential revenue streams helping you to remain competitive. This definitive report will benefit your decision making and help to direct your future business strategy.
How this 160-page report delivers:
• View global, regional and national oil refineries market forecasts and analysis from 2018-2028 to keep your knowledge ahead of your competition and ensure you exploit key business opportunities
– Global oil refineries market forecast and analysis 2018-2028 for expenditure (USD$)
– The market projections and analysis of the commercial drivers and restraints will allow you to more effectively compete in the market. In addition to market forecasts from 2018-2028, our new study shows current market data, original critical analysis, and revealing insight into commercial developments
• Our report provides 180+ tables, charts, and graphs
– Let our analysts present you with a thorough assessment of the current and future oil refinery market prospects. This analysis will achieve quicker, easier understanding. You will gain from our analyst’s industry expertise allowing you to demonstrate your authority on the oil refinery sector.
• Understand the prospects for the 19 leading national oil Refineries markets – where will the highest levels of expenditure and opportunities occur?
– Learn about the market potential for oil refining companies in the developed and developing countries, from 2018 onwards. You will see where, and how opportunities exist with revealing individual regional and country forecasts and analysis from 2018-2028 for 19 leading national markets.
– Mexican forecast 2018-2028
– Canadian 2018-2028
– United States’ forecast 2018-2028
– German forecast 2018-2028
– United Kingdom forecast 2018-2028
– French forecast 2018-2028
– Russian forecast 2018-2028
– Chinese forecast 2018-2028
– Japanese forecast 2018-2028
– Indian forecast 2018-2028
– South Korean forecast 2018-2028
– Iranian forecast 2018-2028
– Saudi Arabian forecast 2018-2028
– Emirati forecast 2018-2028
– Kuwaiti forecast 2018-2028
– South African forecast 218-2028
– Algerian forecast 2018-2028
– Brazilian forecast 2018-2028
– Argentine forecast 2018-2028
As well as 6 regions:
– North America
– Europe
– Asia-Pacific
– Middle East
– Africa
– Latin America
• Find out about the market dynamics & opportunities in 19 leading countries
– Understand industry activity with data revealing where companies are investing in projects
• Explore the factors affecting oil refinery expenditure and production. Learn about the forces influencing market dynamics.
– Explore the Strengths, weaknesses, opportunities, and threats (SWOT) issues facing oil refinery projects. Discover what the present and future outlook for business will be. Learn about the following business critical issues –
– Economic issues and constraints
– Changes to international economic dynamics
– Changes to domestic and regional energy policy that may drive or restrain investment into refinery projects
• We reveal the share of company revenue from refineries data for the leading 15 refinery companies
– Our report analyses the companies which hold the greatest potential. Prospects for growth in oil refineries expenditure are strong, with some companies particularly well placed to excel in the forecast period. View Visiongain’s assessment of the prospects for established competitors and rising companies alike. Our work explains that potential, helping you stay ahead. Gain a thorough understanding of the competitive landscape with profiles of 15 leading oil refinery companies examining their total company revenue, ticker, IR contact, Downstream revenue, strongest business region
– Chevron
– ExxonMobil
– Royal Dutch Shell
– Total S.A.
– Bharat petroleum
– Petrobras
– Lukoil
– Rosneft
– Philips 66
– Reliance Industries
– JGC Corporation
– PKN Orlen
– Gazprom
– Valero Energy Corporation
– ENI
Discover Information found nowhere else in this independent assessment of the oil refinery market
The Global Oil Refinery Market 2018-2028: Expenditure & Production Forecasts and Prospects for Leading Companies report provides impartial oil refinery sector analysis. With the independent business intelligence found only in our work, you will discover where the prospects are for profit. In particular, our new research provides you with key strategic advantages: Our informed forecasts, independent and objective analysis, exclusive interviews and revealing company profiles will provide you with that necessary edge, allowing you to gain ground over your competitors.
With this report you are less likely to fall behind in knowledge or miss crucial business opportunities. You will save time and receive recognition for your market insight. See how this report could benefit and enhance your research, analysis, company presentations and ultimately your individual business decisions and your company’s prospects.
What makes this report unique?
Visiongain’s research methodology involves an exclusive blend of primary and secondary sources providing informed analysis. This methodology allows insight into the key drivers and restraints behind market dynamics and competitive developments. The report therefore presents an ideal balance of qualitative analysis combined with extensive quantitative data including global, regional and national markets forecasts from 2018-2028.
Why choose visiongain business intelligence?
Visiongain’s increasingly diverse sector coverage strengthens our research portfolio. As such, Visiongain’s team of London based in-house analysts offer a wealth of knowledge and experience to inform your strategic business decisions. Let visiongain guide you.
How the Global Oil Refinery Market 2018-2028: Including Regional and Leading Company Analysis report can benefit you:
Visiongain’s report is for anyone requiring analysis of the oil refinery market. You will discover market forecasts, technological trends, predictions and expert opinion, providing you with independent analysis derived from our extensive primary and secondary research. Only by purchasing this report will you receive this critical business intelligence revealing where expenditure and production growth are likely and where the lucrative potential market prospects are. Don’t miss this key opportunity to gain a competitive advantage.
If you buy our report today your knowledge will stay one step ahead of your competitors. Discover how our report could benefit your research, analyses and strategic decisions, saving you time. To gain an understanding of how to tap into the potential of this market and stay one step ahead of the competition you should order our report, the Global Oil Refinery Market 2018-2028: Capex Forecasts for New Build Plants & Upgraded Refinery Infrastructure, Contract / Project Tables Including Regional, Country Outlook & Analysis of Downstream Market Dynamics Plus Profiles of Leading Companies. Avoid missing out –order our report now.
Visiongain is a trading partner with the US Federal Government
CCR Ref number: KD4R6
1. Report Overview
1.1 Global Oil Refineries Market Overview
1.2 Why you Should Read This Report
1.3 How This Report Delivers
1.4 Key Questions Answered by This Report
1.5 Who is This Report For?
1.6 Methodology
1.6.1 Primary Research
1.6.2 Secondary Research
1.6.3 Market Evaluation & Forecasting Methodology
1.7 Frequently Asked Questions (FAQs)
1.8 Associated Visiongain Reports
1.9 About Visiongain
2. Introduction to the Oil Refineries Market
2.1 Oil Refineries Market Definition
2.1.1 The Oil Refining Process
2.1.2 Oil Refining End Products
2.1.3 The Oil Refining Industry
2.1.4 Oil Price Expectations
2.1.4.1 Visiongain’s Oil Price Assumptions
2.1.5 Refining Margins
2.2 Oil Refineries Market Structure
2.3 Brief History of Oil Refineries
3. Global Oil Refineries Market 2018-2028
3.1 Global Oil Refineries Market Forecast 2018-2028
3.2 Oil Refineries Market Drivers & restraints
3.2.1 Drivers in the Oil Refineries Market
3.2.1.1 Increasing Demand for Petroleum Products
3.2.1.2 High Demand in Emerging Economies
3.2.1.3 Energy Security
3.2.1.4 Technical Innovation
3.2.2 restraints in the Oil Refineries Market
3.2.2.1 Volatile Crude Prices
3.2.2.2 Economic Slowdown
4. Leading Regional and National Oil Refineries Market Forecast 2018-2028
4.1 North American Oil Refineries Market Forecast
4.1.1 The US Oil Refineries Market Forecast 2018-2028
4.1.2 Canada Oil Refineries Market Forecast 2018-2028
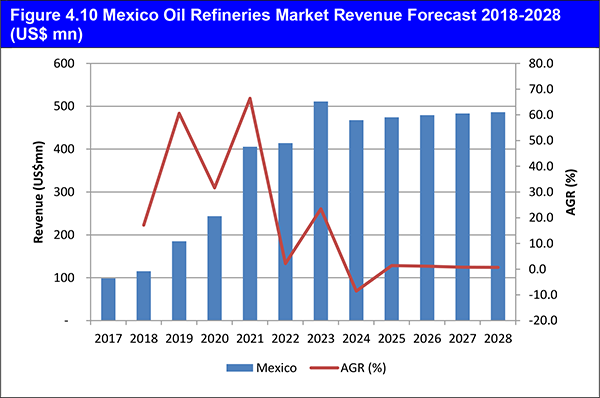
4.1.3 Mexico Oil Refineries Market Forecast 2018-2028
4.2 European Oil Refineries Market Forecast 2018-2028
4.2.1 Germany Oil Refineries Market Forecast 2018-2028
4.2.2 The UK Oil Refineries Market Forecast 2018-2028
4.2.3 France Oil Refineries Market Forecast 2018-2028
4.2.4 Russia Oil Refineries Market Forecast 2018-2028
4.2.5 Rest of Europe Oil Refineries Market Forecast 2018-2028
4.3 Asia Pacific Oil Refineries Market Forecast 2018-2028
4.3.1 China Oil Refineries Market Forecast 2018-2028
4.3.2 Japan Oil Refineries Market Forecast 2018-2028
4.3.3 India Oil Refineries Market Forecast 2018-2028
4.3.4 South Korea Oil Refineries Market Forecast 2018-2028
4.3.5 Rest of Asia Pacific Oil Refineries Market Forecast 2018-2028
4.4 Middle East Oil Refineries Market Forecast 2018-2028
4.4.1 Iran Oil Refineries Market Forecast 2018-2028
4.4.2 Saudi Arabia Oil Refineries Market Forecast 2018-2028
4.4.3 UAE Oil Refineries Market Forecast 2018-2028
4.4.4 Kuwait Oil Refineries Market Forecast 2018-2028
4.4.5 Rest of Middle East Oil Refineries Market Forecast 2018-2028
4.5 Africa Oil Refineries Market Forecast 2018-2028
4.5.1 South Africa Oil Refineries Market Forecast 2018-2028
4.5.2 Algeria Oil Refineries Market Forecast 2018-2028
4.5.3 Rest of Africa Oil Refineries Market Forecast 2018-2028
4.6 Latin America Oil Refineries Market Forecast 2018-2028
4.6.1 Brazil Oil Refineries Market Forecast 2018-2028
4.6.2 Argentina Oil Refineries Market Forecast 2018-2028
4.6.3 Rest of Latin America Oil Refineries Market Forecast 2018-2028
5. SWOT Analysis of the Oil Refineries Market 2018-2028
6. The Leading Companies in Oil Refineries
6.1 Chevron Corporation
6.1.1 Chevron Corporation Total Company Regional Revenue 2017
6.1.2 Chevron Corporation Total Company Revenue 2012-2017
6.1.3 Chevron Corporation Revenue in the Business Segment that includes Oil Refineries Market 2012-2017
6.2 Bharat Petroleum
6.2.1 Bharat Petroleum Total Company Revenue 2012-2017
6.2.2 Bharat Petroleum Revenue in the Business Segment that includes Oil Refineries Market 2012-2017
6.3 ENI
6.3.1 ENI Total Company Revenue 2012-2017
6.4 ExxonMobil
6.4.1 ExxonMobil Total Company Regional Revenue 2017
6.4.2 ExxonMobil Total Company Revenue 2012-2017
6.4.3 ExxonMobil Revenue in the Business Segment that includes Oil Refineries Market 2012-2017
6.5 Total S.A.
6.5.1 Total S.A. Total Company Regional Revenue 2017
6.5.2 Total S.A. Total Company Revenue 2012-2017
6.5.3 Total S.A. Revenue in the Business Segment that includes Oil Refineries Market 2012-2017
6.6 Royal Dutch Shell
6.6.1 Royal Dutch Shell Total Company Regional Revenue 2017
6.6.2 Royal Dutch Shell Total Company Revenue 2012-2017
6.6.3 Royal Dutch Shell Revenue in the Business Segment that includes Oil Refineries Market 2012-2017
6.7 Petrobras
6.7.1 Petrobras Total Company Revenue 2012-2017
6.7.2 Petrobras Revenue in the Business Segment that includes Oil Refineries Market 2012-2017
6.8 Lukoil
6.8.1 Lukoil Total Company Regional Revenue 2017
6.8.2 Lukoil Total Company Revenue 2012-2017
6.8.3 Lukoil Revenue in the Business Segment that includes Oil Refineries Market 2012-2017
6.9 Valero Energy Corporation
6.9.1 Valero Energy Corporation Total Company Regional Revenue 2017
6.9.2 Valero Energy Corporation Total Company Revenue 2012-2017
6.9.3 Valero Energy Corporation Revenue in the Business Segment that includes Oil Refineries Market 2012-2017
6.10 Rosneft
6.10.1 Rosneft Total Company Revenue 2012-2017
6.10.2 Rosneft Revenue in the Business Segment that includes Oil Refineries Market 2012-2017
6.11 JGC Corporation
6.11.1 JGC Corporation Total Company Regional Revenue 2017
6.11.2 JGC Corporation Total Company Revenue 2012-2017
6.11.3 JGC Corporation Revenue in the Business Segment that includes Oil Refineries Market 2012-2017
6.12 Phillips 66
6.12.1 Phillips 66 Total Company Regional Revenue 2017
6.12.2 Phillips 66 Total Company Revenue 2012-2017
6.12.3 Phillips 66 Revenue in the Business Segment that includes Oil Refineries Market 2012-2017
6.13 Reliance Industries
6.13.1 Reliance Industries Total Company Regional Revenue 2017
6.13.2 Reliance Industries Total Company Revenue 2012-2017
6.13.3 Reliance Industries Revenue in the Business Segment that includes Oil Refineries Market 2012-2017
6.14 PKN Orlen
6.14.1 PKN Orlen Total Company Regional Revenue 2017
6.14.2 PKN Orlen Total Company Revenue 2012-2017
6.14.3 PKN Orlen Revenue in the Business Segment that includes Oil Refineries Market 2012-2017
6.15 Gazprom
6.15.1 Gazprom Total Company Revenue 2012-2017
6.16 Other Companies Involved in the Oil Refineries Market 2017
7. Conclusions and Recommendations
7.1 Key Findings
7.2 Recommendations
8. Glossary
List of Tables
Table 2.1 API Gravity of Crude Oil Classifications
Table 2.2 Visiongain’s Anticipated Average Brent Crude Oil Price, 2018, 2019-2021, 2022-2024, 2025-2028 ($/bbl)
Table 3.1 Global Oil Refineries Market Expenditure Forecast 2018-2028 (US$ mn, AGR %, CAGR %, Cumulative)
Table 4.1 Leading Regional Oil Refineries Market Forecast by Revenue 2018-2028 (US$ mn, Global AGR %, Cumulative)
Table 4.2 Regional Refineries Market Percentage Change in Market Share 2018-2023, 2023-2028, 2018-2028 (% Change)
Table 4.3 North America Oil Refineries Market Revenue by Country Forecast 2018-2028 (US$ mn, AGR %, CAGR %, Cumulative)
Table 4.4 The U.S. Oil Refineries Revenue Market Forecast 2018-2028 (US$ mn, AGR %, CAGR %, Cumulative)
Table 4.5 U.S. Expansionary Refineries by Location, Refinery Name, BPD, Expected Completion Date and Investment ($mn)
Table 4.6 Canada Oil Refineries Market Revenue Forecast 2018-2028 (US$ mn, AGR %, CAGR %, Cumulative)
Table 4.7 Canadian Expansionary Refineries by Location, Refinery Name, BPD, Expected Completion Date and Investment ($mn)
Table 4.8 Mexico Oil Refineries Market Revenue Forecast 2018-2028 (US$ mn, AGR %, CAGR %, Cumulative)
Table 4.9 Mexican Expansionary Refineries by Location, Refinery Name, BPD, Expected Completion Date and Investment ($mn)
Table 4.10 Europe Oil Refineries Market Revenue by Country Forecast 2018-2028 (US$ mn, AGR %, CAGR %, Cumulative)
Table 4.11 Germany Oil Refineries Market Revenue Forecast 2018-2028 (US$ mn, AGR %, CAGR %, Cumulative)
Table 4.12 The UK Oil Refineries Market Revenue Forecast 2018-2028 (US$ mn, AGR %, CAGR %, Cumulative)
Table 4.13 U.K. Expansionary Refineries by Location, Refinery Name, BPD, Expected Completion Date and Investment ($mn)
Table 4.14 France Oil Refineries Market Revenue Forecast 2018-2028 (US$ mn, AGR %, CAGR %, Cumulative)
Table 4.15 Russia Oil Refineries Market Revenue Forecast 2018-2028 (US$ mn, AGR %, CAGR %, Cumulative)
Table 4.16 Russian Expansionary/ Upgrade Refineries by Location, refinery Name, BPD, Expected Completion Date and Investment ($mn)
Table 4.17 Rest of Europe Oil Refineries Market Revenue Forecast 2018-2028 (US$ mn, AGR %, CAGR %, Cumulative)
Table 4.18 Rest of Europe Expansionary Refineries by Location, refinery Name, BPD, Expected Completion Date and Investment ($mn)
Table 4.19 Asia Pacific Oil Refineries Market Revenue by Country Forecast 2018-2028 (US$ mn, AGR %, CAGR %, Cumulative)
Table 4.20 China Oil Refineries Market Revenue Forecast 2018-2028 (US$ mn, AGR %, CAGR %, Cumulative)
Table 4.21 Chinese Expansionary Refineries by Location, Refinery Name, BPD, Expected Completion Date, Investment ($mn)
Table 4.22 Japan Oil Refineries Market Revenue Forecast 2018-2028 (US$ mn, AGR %, CAGR %, Cumulative)
Table 4.23 India Oil Refineries Market Revenue Forecast 2018-2028 (US$ mn, AGR %, CAGR %, Cumulative)
Table 4.24 Indian Expansionary Refineries by Location, Refinery Name, BPD, Expected Completion Date, Investment ($mn)
Table 4.25 South Korea Oil Refineries Market Revenue Forecast 2018-2028 (US$ mn, AGR %, CAGR %, Cumulative)
Table 4.26 South Korean Expansionary Refineries by Location, Refinery Name, BPD, Expected Completion Date and Investment ($mn)
Table 4.27 Rest of Asia Pacific Oil Refineries Market Revenue Forecast 2018-2028 (US$ mn, AGR %, CAGR %, Cumulative)
Table 4.28 Rest of Asia-Pacific Expansionary Refineries by Location, Refinery Name, BPD, Expected Completion Date, Investment ($mn)
Table 4.29 Middle East Oil Refineries Market Revenue by Country Forecast 2018-2028 (US$ mn, AGR %, CAGR %, Cumulative)
Table 4.30 Iran Oil Refineries Market Revenue Forecast 2018-2028 (US$ mn, AGR %, CAGR %, Cumulative)
Table 4.31 Iranian Expansionary Refineries by Location, Refinery Name, BPD, Expected Completion Date, Investment ($mn)
Table 4.32 Saudi Arabia Oil Refineries Market Revenue Forecast 2018-2028 (US$ mn, AGR %, CAGR %, Cumulative)
Table 4.33 Saudi Arabian Expansionary Refineries by Location, Refinery Name, BPD, Expected Completion Date, Investment ($mn)
Table 4.34 UAE Oil Refineries Market Revenue Forecast 2018-2028 (US$ mn, AGR %, CAGR %, Cumulative)
Table 4.35 UAE Expansionary Refineries by Location, Refinery Name, BPD, Expected Completion Date, Investment ($mn)
Table 4.36 Kuwait Oil Refineries Market Revenue Forecast 2018-2028 (US$ mn, AGR %, CAGR %, Cumulative)
Table 4.37 Kuwaiti Expansionary Refineries by Location, Refinery Name, BPD, Expected Completion Date, Investment ($mn)
Table 4.38 Rest of Middle East Oil Refineries Market Revenue Forecast 2018-2028 (US$ mn, AGR %, CAGR %, Cumulative)
Table 4.39 Rest of Middle East Expansionary Refineries by Location, Refinery Name, BPD, Expected Completion Date, Investment ($mn)
Table 4.40 Africa Oil Refineries Market Revenue by Country Forecast 2018-2028 (US$ mn, AGR %, CAGR %, Cumulative)
Table 4.41 South Africa Oil Refineries Market Revenue Forecast 2018-2028 (US$ mn, AGR %, CAGR %, Cumulative)
Table 4.42 Algeria Oil Refineries Market Revenue Forecast 2018-2028 (US$ mn, AGR %, CAGR %, Cumulative)
Table 4.43 Algerian Expansionary Refineries by Location, Refinery Name, BPD, Expected Completion Date, Investment ($mn)
Table 4.44 Rest of Africa Oil Refineries Market Revenue Forecast 2018-2028 (US$ mn, AGR %, CAGR %, Cumulative)
Table 4.45 Rest of Africa Expansionary Refineries by Location, Refinery Name, BPD, Expected Completion Date, Investment ($mn)
Table 4.46 Latin America Oil Refineries Market Revenue by Country Forecast 2018-2028 (US$ mn, AGR %, CAGR %, Cumulative)
Table 4.47 Brazil Oil Refineries Market Revenue Forecast 2018-2028 (US$ mn, AGR %, CAGR %, Cumulative)
Table 4.48 Brazilian Expansionary Refineries by Location, Refinery Name, BPD, Expected Completion Date, Investment ($mn)
Table 4.49 Argentina Oil Refineries Market Revenue Forecast 2018-2028 (US$ mn, AGR %, CAGR %, Cumulative)
Table 4.50 Argentine Expansionary Refineries by Location, Refinery Name, BPD, Expected Completion Date, Investment ($mn)
Table 4.51 Rest of Latin America Oil Refineries Market Revenue Forecast 2018-2028 (US$ mn, AGR %, CAGR %, Cumulative)
Table 5.1 Global Oil Refineries Market SWOT Analysis 2018-2028
Table 6.1 Chevron Corporation 2017 (CEO, Total Company Revenue US$m, Revenue in the Market US$m, Share of Company Sales from Oil Refineries Market %, Net Income / Loss US$m, Net Capital Expenditure US$m, Strongest Business Region, Business Segment in the Market, HQ, Founded, No. of Employees, IR Contact, Ticker, Website)
Table 6.2 Chevron Corporation Total Company Revenue 2012-2017 (US$ m, AGR %)
Table 6.3 Chevron Corporation Revenue in the Business Segment that includes Oil Refineries Market 2012-2017 (US$ m, AGR %)
Table 6.4 Bharat Petroleum 2017 (CEO, Total Company Revenue US$m, Revenue in the Market US$m, Share of Company Revenue from Oil Refineries Market %, Net Income / Loss US$m, Net Capital Expenditure US$m, Strongest Business Region, Business Segment in the Market, HQ, Founded, No. of Employees, IR Contact, Ticker, Website)
Table 6.5 Bharat Petroleum Total Company Revenue 2013-2017 (US$ m, AGR %)
Table 6.6 Bharat Petroleum Revenue in the Business Segment that includes Oil Refineries Market 2013-2017 (US$m, AGR %)
Table 6.7 ENI 2017 (CEO, Total Company Revenue US$m, Revenue in the Market US$m, Share of Company Revenue from Oil Refineries Market %, Net Income / Loss US$m, Net Capital Expenditure US$m, Strongest Business Region, Business Segment in the Market, HQ, Founded, No. of Employees, IR Contact, Ticker, Website)
Table 6.8 ENI Total Company Revenue 2012-2017 (US$m, AGR %)
Table 6.9 ExxonMobil 2017 (CEO, Total Company Revenue US$m, Revenue in the Market US$m, Share of Company Revenue from Oil Refineries Market %, Net Income / Loss US$m, Net Capital Expenditure US$m, Strongest Business Region, Business Segment in the Market, HQ, Founded, No. of Employees, IR Contact, Ticker, Website)
Table 6.10 ExxonMobil Total Company Revenue 2012-2017 (US$m, AGR %)
Table 6.11 ExxonMobil Revenue in the Business Segment that includes Oil Refineries Market 2012-2017 (US$m, AGR %)
Table 6.12 Total S.A. 2017 (CEO, Total Company Revenue US$m, Revenue in the Market US$m, Share of Company Revenue from Oil Refineries Market %, Net Income / Loss US$m, Net Capital Expenditure US$m, Strongest Business Region, Business Segment in the Market, HQ, Founded, No. of Employees, IR Contact, Ticker, Website)
Table 6.13 Total S.A. Total Company Revenue 2012-2017 (US$m, AGR %)
Table 6.14 Total S.A. Revenue in the Business Segment that includes Oil Refineries Market 2012-2017 (US$m, AGR %)
Table 6.15 Royal Dutch Shell 2017 (CEO, Total Company Revenue US$m, Revenue in the Market US$m, Share of Company Revenue from Oil Refineries Market %, Net Income / Loss US$m, Net Capital Expenditure US$m, Strongest Business Region, Business Segment in the Market, HQ, Founded, No. of Employees, IR Contact, Ticker, Website)
Table 6.16 Royal Dutch Shell Total Company Revenue 2012-2017 (US$m, AGR %)
Table 6.17 Royal Dutch Shell Revenue in the Business Segment that includes Oil Refineries Market 2012-2017 (US$m, AGR %)
Table 6.18 Petrobras 2017 (CEO, Total Company Revenue US$m, Revenue in the Market US$m, Share of Company Revenue from Oil Refineries Market %, Net Income / Loss US$m, Net Capital Expenditure US$m, Strongest Business Region, Business Segment in the Market, HQ, Founded, No. of Employees, IR Contact, Ticker, Website)
Table 6.19 Petrobras Total Company Revenue 2012-2017 (US$m, AGR %)
Table 6.20 Petrobras Revenue in the Business Segment that includes Oil Refineries Market 2012-2017 (US$m, AGR %)
Table 6.21 Lukoil 2017 (CEO, Total Company Revenue US$m, Revenue in the Market US$m, Share of Company Revenue from Oil Refineries Market %, Net Income / Loss US$m, Net Capital Expenditure US$m, Strongest Business Region, Business Segment in the Market, HQ, Founded, No. of Employees, IR Contact, Ticker, Website)
Table 6.22 Lukoil Total Company Revenue 2012-2017 (US$m, AGR %)
Table 6.23 Lukoil Revenue in the Business Segment that includes Oil Refineries Market 2012-2017 (US$m, AGR %)
Table 6.24 Valero Energy Corporation 2017 (CEO, Total Company Revenue US$m, Revenue in the Market US$m, Share of Company Revenue from Oil Refineries Market %, Net Income / Loss US$m, Net Capital Expenditure US$m, Strongest Business Region, Business Segment in the Market, HQ, Founded, No. of Employees, IR Contact, Ticker, Website)
Table 6.25 Valero Energy Corporation Total Company Revenue 2012-2017 (US$m, AGR %)
Table 6.26 Valero Energy Corporation Revenue in the Business Segment that includes Oil Refineries Market 2012-2017 (US$m, AGR %)
Table 6.27 Rosneft 2017 (CEO, Total Company Revenue US$m, Revenue in the Market US$m, Share of Company Revenue from Oil Refineries Market %, Net Income / Loss US$m, Net Capital Expenditure US$m, Strongest Business Region, Business Segment in the Market, HQ, Founded, No. of Employees, IR Contact, Ticker, Website)
Table 6.28 Rosneft Total Company Revenue 2012-2017 (US$m, AGR %)
Table 6.29 Rosneft Revenue in the Business Segment that includes Oil Refineries Market 2012-2017 (US$m, AGR %)
Table 6.30 JGC Corporation 2017 (CEO, Total Company Revenue US$m, Revenue in the Market US$m, Share of Company Revenue from Oil Refineries Market %, Net Income / Loss US$m, Net Capital Expenditure US$m, Strongest Business Region, Business Segment in the Market, HQ, Founded, No. of Employees, IR Contact, Ticker, Website)
Table 6.31 JGC Corporation Total Company Revenue 2012-2017 (US$m, AGR %)
Table 6.32 JGC Corporation Revenue in the Business Segment that includes Oil Refineries Market 2011-2017 (US$m, AGR %)
Table 6.33 Phillips 66 2017 (CEO, Total Company Revenue US$m, Revenue in the Market US$m, Share of Company Revenue from Oil Refineries Market %, Net Income / Loss US$m, Net Capital Expenditure US$m, Strongest Business Region, Business Segment in the Market, HQ, Founded, No. of Employees, IR Contact, Ticker, Website)
Table 6.34 Phillips 66 Total Company Revenue 2012-2017 (US$m, AGR %)
Table 6.35 Phillips 66 Revenue in the Business Segment that includes Oil Refineries Market 2012-2017 (US$m, AGR %)
Table 6.36 Reliance Industries 2017 (CEO, Total Company Revenue US$m, Revenue in the Market US$m, Share of Company Revenue from Oil Refineries Market %, Net Income / Loss US$m, Net Capital Expenditure US$m, Strongest Business Region, Business Segment in the Market, HQ, Founded, No. of Employees, IR Contact, Ticker, Website)
Table 6.37 Reliance Industries Total Company Revenue 2012-2017 (US$m, AGR %)
Table 6.38 Reliance Industries Revenue in the Business Segment that includes Oil Refineries Market 2012-2017 (US$m, AGR %)
Table 6.39 PKN Orlen 2017 (CEO, Total Company Revenue US$m, Revenue in the Market US$m, Share of Company Revenue from Oil Refineries Market %, Net Income / Loss US$m, Net Capital Expenditure US$m, Strongest Business Region, Business Segment in the Market, HQ, Founded, No. of Employees, IR Contact, Ticker, Website)
Table 6.40 PKN Orlen Total Company Revenue 2011-2017 (US$m, AGR %)
Table 6.41 PKN Orlen Revenue in the Business Segment that includes Oil Refineries Market 2011-2017 (US$m, AGR %)
Table 6.42 Gazprom 2017 (CEO, Total Company Revenue US$m, Revenue in the Market US$m, Share of Company Revenue from Oil Refineries Market %, Net Income / Loss US$m, Net Capital Expenditure US$m, Strongest Business Region, Business Segment in the Market, HQ, Founded, No. of Employees, IR Contact, Ticker, Website)
Table 6.43 Gazprom Total Company Revenue 2012-2017 (US$m, AGR %)
Table 6.44 Other Companies Involved in the Oil Refineries Market 2017 (Company, Location)
Table 7.1 Global Oil Refineries Market by Region Forecast 2018-2028 (US$ mn, AGR %, Cumulative)
List of Figures
Figure 2.1 Global Oil Refineries Market Segmentation Overview
Figure 3.1 Global Oil Refineries Market Expenditure Forecast 2018-2028 (US$ mn, AGR %)
Figure 4.1 Global Oil Refineries Market by Regional Capex Market Forecast 2018-2028 (US$ mn, Global AGR %)
Figure 4.2 Global Oil Refineries Market by Region Market AGR Forecast 2018-2028 (AGR %)
Figure 4.3 Global Oil Refineries Market by Regional Market Share Forecast 2018 (% Share)
Figure 4.4 Global Oil Refineries Market by Regional Market Share Forecast 2023 (% Share)
Figure 4.5 Global Oil Refineries Market by Regional Market Share Forecast 2028 (% Share)
Figure 4.6 North America Oil Refineries Expenditure by Country Forecast 2018-2028 (US$ mn, North America Total Market Sales AGR %)
Figure 4.7 North America Oil Refineries Market Share by Country Forecast 2018, 2023, 2028 (% Share)
Figure 4.8 The U.S. Oil Refineries Market Expenditure Forecast 2018-2028 (US$ mn)
Figure 4.9 Canada Oil Refineries Market Expenditure Forecast 2018-2028 (US$ mn)
Figure 4.10 Mexico Oil Refineries Market Expenditure Forecast 2018-2028 (US$ mn)
Figure 4.11 Europe Oil Refineries Market by Country AGR Forecast 2018-2028 (AGR %)
Figure 4.12 Europe Oil Refineries Market Expenditure by Country Forecast 2018-2028 (US$ mn, Europe Total Market Sales AGR %)
Figure 4.13 Europe Oil Refineries Market Share by Country Forecast 2018, 2023, 2028 (% Share)
Figure 4.14 Germany Oil Refineries Market Expenditure Forecast 2018-2028 (US$ mn)
Figure 4.15 The UK Oil Refineries Market Expenditure Forecast 2018-2028 (US$ mn)
Figure 4.16 France Oil Refineries Market Expenditure Forecast 2018-2028 (US$ mn)
Figure 4.17 Russia Oil Refineries Market Expenditure Forecast 2018-2028 (US$ mn)
Figure 4.18 Rest of Europe Oil Refineries Market Expenditure Forecast 2018-2028 (US$ mn)
Figure 4.19 Asia Pacific Oil Refineries Market by Country AGR Forecast 2018-2028 (AGR %)
Figure 4.20 Asia Pacific Oil Refineries Market Expenditure by Country Forecast 2018-2028 (US$ mn, Asia Pacific Total Market Sales AGR %)
Figure 4.21 Asia Pacific Oil Refineries Market Share by Country Forecast 2018, 2023, 2028 (% Share)
Figure 4.22 China Oil Refineries Market Expenditure Forecast 2018-2028 (US$ mn)
Figure 4.23 Japan Oil Refineries Market Expenditure Forecast 2018-2028 (US$ mn)
Figure 4.24 India Oil Refineries Market Expenditure Forecast 2018-2028 (US$ mn)
Figure 4.25 South Korea Oil Refineries Market Expenditure Forecast 2018-2028 (US$ mn)
Figure 4.26 Rest of Asia Pacific Oil Refineries Market Expenditure Forecast 2018-2028 (US$ mn)
Figure 4.27 Middle East Oil Refineries Market by Country AGR Forecast 2018-2028 (AGR %)
Figure 4.28 Middle East Oil Refineries Market Expenditure by Country Forecast 2018-2028 (US$ mn, Middle East Total Market Sales AGR %)
Figure 4.29 Middle East Oil Refineries Market Share By Country Forecast 2018, 2023, 2028 (% Share)
Figure 4.30 Iran Oil Refineries Market Expenditure Forecast 2018-2028 (US$ mn)
Figure 4.31 Saudi Arabia Oil Refineries Market Forecast 2018-2028 (US$ mn)
Figure 4.32 UAE Oil Refineries Market Expenditure Forecast 2018-2028 (US$ mn)
Figure 4.33 Kuwait Oil Refineries Market Expenditure Forecast 2018-2028 (US$ mn)
Figure 4.34 Rest of Middle East Oil Refineries Market Expenditure Forecast 2018-2028 (US$ mn)
Figure 4.35 Africa Oil Refineries Market by Country AGR Forecast 2018-2028 (AGR %)
Figure 4.36 Africa Oil Refineries Market Expenditure by Country Forecast 2018-2028 (US$ mn, Africa Total Market Sales AGR %)
Figure 4.37 Africa Oil Refineries Market Share by Country Forecast 2018, 2023, 2028 (% Share)
Figure 4.38 South Africa Oil Refineries Market Expenditure Forecast 2018-2028 (US$ mn)
Figure 4.39 Algeria Oil Refineries Market Expenditure Forecast 2018-2028 (US$ mn)
Figure 4.40 Rest of Africa Oil Refineries Market Expenditure Forecast 2018-2028 (US$ mn)
Figure 4.41 Latin America Oil Refineries Market by Country AGR Forecast 2018-2028 (AGR %)
Figure 4.42 Latin America Oil Refineries Market Expenditure by Country Forecast 2018-2028 (US$ mn, Latin America Total Market Sales AGR %)
Figure 4.43 Latin America Oil Refineries Market Share by Country Forecast 2018, 2023, 2028 (% Share)
Figure 4.44 Brazil Oil Refineries Market Expenditure Forecast 2018-2028 (US$ mn)
Figure 4.45 Argentina Oil Refineries Market Expenditure Forecast 2018-2028 (US$ mn)
Figure 4.46 Rest of Latin America Oil Refineries Market Expenditure Forecast 2018-2028 (US$ mn)
Figure 6.1 Chevron Corporation Company Revenue by Region 2017 (%)
Figure 6.2 Chevron Corporation Total Company Revenue 2012-2017 (US$ m, AGR %)
Figure 6.3 Chevron Corporation Revenue in the Business Segment that includes Oil Refineries Market 2012-2017 (US$ m, AGR %)
Figure 6.4 Bharat Petroleum Total Company Revenue 2013-2017 (US$m, AGR %)
Figure 6.5 Bharat Petroleum Revenue in the Business Segment that includes Oil Refineries Market 2013-2017 (US$m, AGR %)
Figure 6.6 ENI Total Company Revenue 2012-2017 (US$m, AGR %)
Figure 6.7 ExxonMobil Company Revenue by Region 2017 (%)
Figure 6.8 ExxonMobil Total Company Revenue 2012-2017 (US$m, AGR %)
Figure 6.9 ExxonMobil Revenue in the Business Segment that includes Oil Refineries Market 2012-2017 (US$m, AGR %)
Figure 6.10 Total S.A. Company Revenue by Region 2017 (%)
Figure 6.11 Total S.A. Total Company Revenue 2012-2017 (US$m, AGR %)
Figure 6.12 Total S.A. Revenue in the Business Segment that includes Oil Refineries Market 2012-2017 (US$m, AGR %)
Figure 6.13 Royal Dutch Shell Company Regional Revenue 2017 (%)
Figure 6.14 Royal Dutch Shell Total Company Revenue 2012-2017 (US$m, AGR %)
Figure 6.15 Royal Dutch Shell Revenue in the Business Segment that includes Oil Refineries Market 2012-2017 (US$m, AGR %)
Figure 6.16 Petrobras Total Company Revenue 2012-2017 (US$m, AGR %)
Figure 6.17 Petrobras Revenue in the Business Segment that includes Oil Refineries Market 2012-2017 (US$m, AGR %)
Figure 6.18 Lukoil Company Revenue by Region 2017 (%)
Figure 6.19 Lukoil Total Company Revenue 2012-2017 (US$m, AGR %)
Figure 6.20 Lukoil Revenue in the Business Segment that includes Oil Refineries Market 2012-2017 (US$m, AGR %)
Figure 6.21 Valero Energy Corporation Company Revenue by Region 2017 (%)
Figure 6.22 Valero Energy Corporation Total Company Revenue 2012-2017 (US$m, AGR %)
Figure 6.23 Valero Energy Corporation Revenue in the Business Segment that includes Oil Refineries Market 2012-2017 (US$m, AGR %)
Figure 6.24 Rosneft Total Company Revenue 2012-2017 (US$m, AGR %)
Figure 6.25 Rosneft Revenue in the Business Segment that includes Oil Refineries Market 2012-2017 (US$m, AGR %)
Figure 6.26 JGC Corporation Company Revenue by Region 2017 (%)
Figure 6.27 JGC Corporation Total Company Revenue 2012-2017 (US$m, AGR %)
Figure 6.28 JGC Corporation Revenue in the Business Segment that includes Oil Refineries Market 2012-2017 (US$m, AGR %)
Figure 6.29 Phillips 66 Company Revenue by Region 2017 (%)
Figure 6.30 Phillips 66 Total Company Revenue 2012-2017 (US$m, AGR %)
Figure 6.31 Phillips 66 Revenue in the Business Segment that includes Oil Refineries Market 2012-2017 (US$m, AGR %)
Figure 6.32 Reliance Industries Company Revenue by Region 2017 (%)
Figure 6.33 Reliance Industries Total Company Revenue 2012-2017 (US$m, AGR %)
Figure 6.34 Reliance Industries Revenue in the Business Segment that includes Oil Refineries Market 2012-2017 (US$m, AGR %)
Figure 6.35 PKN Orlen Company Revenue by Region 2017 (%)
Figure 6.36 PKN Orlen Total Company Revenue 2012-2017 (US$m, AGR %)
Figure 6.37 PKN Orlen Revenue in the Business Segment that includes Oil Refineries Market 2012-2017 (US$m, AGR %)
Figure 6.38 Gazprom Total Company Revenue 2012-2017 (US$m, AGR %)
Aker Solutions
Axion Energy
Bharat Petroleum
BP
BPCL
Canadian Association of Petroleum Producers (CAPP)
Chevron Corporation
China National Petroleum Corporation
ConocoPhilips
Cosmo Oil
Daelim
ENI
Essar
ExxonMobil
Flint Hills Resources
Fluor Corporation
Foster Wheeler
Gazprom
Halliburton
Holly Frontier Corporation
Idemitsu Kosan
Indian Oil Corporation
INEOS Group
International Energy Agency (IEA)
Jacobs Engineering Group
JGC Corporation
JX Holdings
KBR
Kuwait National Petroleum Company (KNPC)
Lukoil
Magellan Midstream Partners LP
Microsoft
National Iranian Oil Company
National Iranian Oil Refining and Distribution Company (NIORDC)
NITI Aayog
Pan American Energy (PAE)
PBF Energy
PDVSA
Petro Rabigh
Petrobras
Petroleos de Venezuela
Petroleos Mexicanos
Petroleum Oil and Gas Corporation of South Africa Limited (Petro SA)
Phillips 66
PKN Orlen
Reliance Industries
Rosneft
Royal Dutch Shell
Samsung
Shaw Group
Showa Shell Group
Sinopec
Sumitomo
Tamin Petroleum
Tatneft Europe AG
Techint E&C
Technip
Tesoro Corporation
Tonen General Sekiyu
Total S.A.
Valero Energy Corporation
World Bank
Worley Parsons
Government Organisations Mentioned
Ministry of Economy, Trade and Industry (METI Japan)
Ministry of Energy (Russia)
Ministry of Finance (Russia)
National Energy Board
National Society for Hydrocarbon Research, Production, Transport, Processing and Marketing (Algeria)
Organisation of the Petroleum Exporting Countries (OPEC)
Petroleum Association of Japan (PAJ)
Saudi Aramco
US Energy Information Administration (EIA)
