Industries > Energy > The Tire Derived Fuel (TDF) Market Forecast 2019-2029
The Tire Derived Fuel (TDF) Market Forecast 2019-2029
Volume (Thousand Tons) & Revenue ($mn) Forecasts by Tire Type (Shredded and Whole Tire) and by End-Use (Cement, Pulp & Paper, Boiler, Other). Plus Analysis and Forecasts by Country and Forecasts by Leading Countries and Companies Involved in this Sector
Tire derived fuel (TDF) is composed of scrap or misshapen tires which can be either shredded or chipped to between 1 and 4 inches. These scrap tires can be collected from manufacturers, retail partners, local councils and processed at various plants. After they have been shredded, the TDF can be mixed with coal and other fuels such as wood and chemical waste. These mixtures can then be burned in concrete kilns, paper mills or even power plants.
According to the Environmental Protection Agency, TDF produces the same amount of energy as oil and up to 25% more energy than coal, while simultaneously producing less emissions. When burned, TDF produces less emissions due to the tire ash containing a lower content of heavy metals than some coals, resulting in lower NOx emissions than these coals, especially the high-sulfur coals.
The report will answer questions such as:
• What are the prospects for the overall tire derived fuel industry?
• Where are the major investments occurring?
• Who are the key players in the tire derived fuel industry?
• What are the market dynamics underpinning the sector?
Four Reasons Why You Must Order and Read This Report Today:
1) The report provides detailed profiles of the top 9 leading companies operating within the Tire Derived Fuel Market:
– Liberty Tire Recycling
– Ragn-Sells Group
– ResourceCo
– Lakin Tire West Inc.
– L&S Tire Company
– Probio Energy International
– Renelux Cyprus
– Globarket Tire Recycling
– Emanuel Tire LLC
2) The study reveals where companies are investing in Tire Derived Fuel and Volume of Tires expected (TT). Analysis of three regional markets, 6 national markets:
– U.S. Tire Derived Fuel (TDF) Market Forecast 2019-2029
– Canada Tire Derived Fuel (TDF) Market Forecast 2019-2029
– Japan Tire Derived Fuel (TDF) Market Forecast 2019-2029
– India Tire Derived Fuel (TDF) Market Forecast 2019-2029
– Rest of Asia Pacific Tire Derived Fuel (TDF) Market Forecast 2019-2029
– UK Tire Derived Fuel (TDF) Market Forecast 2019-2029
– Germany Tire Derived Fuel (TDF) Market Forecast 2019-2029
– Rest of Europe Tire Derived Fuel (TDF) Market Forecast 2019-2029
– Rest of the World Tire Derived Fuel (TDF) Market Forecast 2019-2029
3) The analysis is underpinned by an exclusive interview with a leading Tire Derived Fuel expert:
Ragn-Sells Group – Sales Division
4) The study reveals the type of tire and end-use that will see strongest growth in use over the forecast period
– Whole Tire
– Shredded Tire
– Cement
– Pulp & Paper
– Boiler
– Others
This independent 181-page report guarantees you will remain better informed than your competition. With 181 tables and figures examining the Tire Derived Fuel market space, the report gives you a visual, one-stop breakdown of your market including capital expenditure forecasts from 2019-2029, as well as analysis PLUS tire volume (thousand tons) forecasts from 2019-2029, keeping your knowledge that one step ahead helping you to succeed.
The Tire Derived Fuel (TDF) Market is essential reading for you or anyone in the energy or waste/ recycling sectors with an interest in waste-to-energy. Purchasing this report today will help you to recognise those important market opportunities and understand the possibilities there. I look forward to receiving your order.
Visiongain is a trading partner with the US Federal Government
CCR Ref number: KD4R6
1. Report Overview
1.1 Tire Derived Fuel (TDF) Market Overview
1.2 Market Structure Overview and Market Definition
1.3 Why You Should Read This Report
1.4 How This Report Delivers
1.5 Key Questions Answered by This Analytical Report Include
1.6 Who is This Report For?
1.7 Methodology
1.7.1 Primary Research
1.7.2 Secondary Research
1.7.3 Market Evaluation & Forecasting Methodology
1.8 Frequently Asked Questions (FAQ)
1.9 Associated Visiongain Reports
1.10 About Visiongain
2. Introduction to The Tire Derived Fuel (TDF) Market
2.1 Global Tire Derived Fuel (TDF) Market Structure
2.2 Tire Derived Fuel Market Definition
2.3 Tire Derived Fuel (TDF) Regulatory Scenario
2.4 Global Tire Derived Fuel Industry Analysis
3. Global Overview of Tire Derived Fuel (TDF) Market
3.1 Regional Overview of Tire Derived Fuel (TDF) Market 2019-2029
3.2 Global Tire Derived Fuel (TDF) Market Drivers and Restraints
4. Global Tire Derived Fuel (TDF) Submarkets Forecast 2019-2029
4.1 Global Tire Derived Fuel (TDF) Submarkets Forecast, by Tire Type 2019-2029
4.1.1 Global Tire Derived Fuel (TDF) Market, by Shredded Tire Forecasts 2019-2029
4.1.1.1 Global Tire Derived Fuel (TDF) Market, by Shredded Tire Driver & Restraints
4.1.2 Global Tire Derived Fuel (TDF) Market, by Whole Tire Forecasts 2019-2029
4.1.2.1 Global Tire Derived Fuel (TDF) Market, by Whole Tire Drivers & Restraints
4.1.3 Global Tire Derived Fuel (TDF) Market Comparison Matrix (Tire Type vs Region)
4.2 Global Tire Derived Fuel (TDF) Submarkets Forecast, by End-user 2019-2029
4.2.1 Global Tire Derived Fuel (TDF) Market, by Cement Forecasts 2019-2029
4.2.1.1 Global Tire Derived Fuel (TDF) Market, by Cement Driver & Restraints
4.2.2 Global Tire Derived Fuel (TDF) Market, by Pulp & Paper Forecasts 2019-2029
4.2.2.1 Global Tire Derived Fuel (TDF) Market, by Pulp & Paper Driver & Restraints
4.2.3 Global Tire Derived Fuel (TDF) Market, by Boiler Forecasts 2019-2029
4.2.3.1 Global Tire Derived Fuel (TDF) Market, by Boiler Driver & Restraints
4.2.4 Global Tire Derived Fuel (TDF) Market, by Others Forecasts 2019-2029
4.2.4.1 Global Tire Derived Fuel (TDF) Market, by Other Driver & Restraints
4.2.5 Global Tire Derived Fuel (TDF) Market- Comparison Matrix (End-user Type VS Region)
5. Leading Nations in Tire Derived Fuel (TDF) Market 2019-2029
5.1 U.S. Tire Derived Fuel (TDF) Market Forecast 2019-2029
5.1.1 U.S. Tire Derived Fuel (TDF) Submarket Forecast 2019-2029
5.1.1.1 U.S. Tire Derived Fuel (TDF) Market Forecast by Tire Type 2019-2029
5.1.1.2 U.S. Tire Derived Fuel (TDF) Market Forecast by End-user 2019-2029
5.2 Canada Tire Derived Fuel (TDF) Market Forecast 2019-2029
5.2.1 Canada Tire Derived Fuel (TDF) Submarket Forecast 2019-2029
5.2.1.1 Canada Tire Derived Fuel (TDF) Market Forecast by Tire Type 2019-2029
5.2.1.2 Canada Tire Derived Fuel (TDF) Market Forecast by End-user 2019-2029
5.3 Japan Tire Derived Fuel (TDF) Market Forecast 2019-2029
5.3.1 Japan Tire Derived Fuel (TDF) Submarket Forecast 2019-2029
5.3.1.1 Japan Tire Derived Fuel (TDF) Market Forecast by Tire Type 2019-2029
5.3.1.2 Japan Tire Derived Fuel (TDF) Market Forecast by End-user 2019-2029
5.4 India Tire Derived Fuel (TDF) Market Forecast 2019-2029
5.4.1 India Tire Derived Fuel (TDF) Submarket Forecast 2019-2029
5.4.1.1 India Tire Derived Fuel (TDF) Market Forecast by Tire Type 2019-2029
5.4.1.2 India Tire Derived Fuel (TDF) Market Forecast by End-user 2019-2029
5.5 Rest of Asia Pacific Tire Derived Fuel (TDF) Market Forecast 2019-2029
5.5.1 Rest of Asia Pacific Tire Derived Fuel (TDF) Submarket Forecast 2019-2029
5.5.1.1 Rest of Asia Pacific Tire Derived Fuel (TDF) Market Forecast by Tire Type 2019-2029
5.5.1.2 Rest of Asia Pacific Tire Derived Fuel (TDF) Market Forecast by End-user 2019-2029
5.6 U.K. Tire Derived Fuel (TDF) Market Forecast 2019-2029
5.6.1 U.K. Tire Derived Fuel (TDF) Submarket Forecast 2019-2029
5.6.1.1 U.K. Tire Derived Fuel (TDF) Market Forecast by Tire Type 2019-2029
5.6.1.2 U.K. Tire Derived Fuel (TDF) Market Forecast by End-user 2019-2029
5.7 Germany Tire Derived Fuel (TDF) Market Forecast 2019-2029
5.7.1 Germany Tire Derived Fuel (TDF) Submarket Forecast 2019-2029
5.7.1.1 Germany Tire Derived Fuel (TDF) Market Forecast by Tire Type 2019-2029
5.7.1.2 Germany Tire Derived Fuel (TDF) Market Forecast by End-user 2019-2029
5.8 Rest of Europe Tire Derived Fuel (TDF) Market Forecast 2019-2029
5.8.1 Rest of Europe Tire Derived Fuel (TDF) Submarket Forecast 2019-2029
5.8.1.1 Rest of Europe Tire Derived Fuel (TDF) Market Forecast by Tire Type 2019-2029
5.8.1.2 Rest of Europe Tire Derived Fuel (TDF) Market Forecast by End-user 2019-2029
5.9 Rest of the World Tire Derived Fuel (TDF) Market Forecast 2019-2029
5.9.1 Rest of the World Tire Derived Fuel (TDF) Submarket Forecast 2019-2029
5.9.1.1 Rest of the World Tire Derived Fuel (TDF) Market Forecast by Tire Type 2019-2029
5.9.1.2 Rest of the World Tire Derived Fuel (TDF) Market Forecast by End-user 2019-2029
6. PEST Analysis of the Tire Derived Fuel (TDF) Market
6.1 Political Impact
6.2 Economic Impact
6.3 Social Impact
6.4 Technological Impact
7. Expert Opinion
7.1 Primary Correspondents
7.2 Global Tire Derived Fuel Market Outlook
7.3 Drivers & Restraints
7.4 Dominant Region/Country in the Tire Derived Fuel Market
7.5 Dominant Tire Type and End-User Type
7.6 Overall Growth Rate, Globally
8. Leading Companies in Gas Insulated Transformers Market
8.1 Liberty Tire Recycling
8.1.1 Liberty Tire Recycling Overview
8.2 Ragn-Sells Group
8.2.1 Ragn-Sells Group Overview
8.2.2 Ragn-Sells Group Business Strategy
8.3 ResourceCo Pty Ltd.
8.3.1 ResourceCo Pty Ltd. Overview
8.3.2 ResourceCo Pty Ltd. Recent Developments
8.4 Lakin Tire West Inc.
8.4.1 Lakin Tire West Inc. Overview
8.5 L & S Tire Company
8.5.1 L & S Tire Company Overview
8.6 Probio Energy International
8.6.1 Probio Energy International Overview
8.6.2 Probio Energy International Recent Developments
8.7 Renelux Cyprus Ltd
8.7.1 Renelux Cyprus Ltd Overview
8.7.2 Renelux Cyprus Recent Activity
8.8 Globarket Tire Recycling LLC
8.8.1 Globarket Tire Recycling LLC Overview
8.9 Emanuel Tire, LLC
8.9.1 Emanuel Tire, LLC Overview
8.10 Tire Disposal & Recycling, Inc.
8.10.1 Tire Disposal & Recycling, Inc. Overview
9. Conclusion & Recommendations
9.1 Recommendations
10. Glossary
Associated Visiongain Reports
Visiongain Report Sales Order Form
Appendix A
About Visiongain
Appendix B
Visiongain Report Evaluation Form
List of Tables
Table 2.1 List of Key Customers: Tire-derived Fuel Market
Table 2.2 List of Key Tire Shredders
Table 3.1 Global Tire Derived Fuel (TDF) Market Forecast 2018-2029 (TT, $ mn, AGR %, CAGR %, Cumulative)
Table 3.2 Global Tire Derived Fuel (TDF) Market by Regional Forecast 2019-2029 (TT, AGR %, CAGR %, Cumulative)
Table 3.3 Global Tire Derived Fuel (TDF) Marketby Regional Forecast 2019-2029 ($mn, AGR %, CAGR %, Cumulative)
Table 3.4 Global Tire Derived Fuel (TDF) Market Drivers and Restraints
Table 4.1 Global Tire Derived Fuel (TDF) Market, by Tire Type Forecast 2019-2029 ($mn, AGR %, Cumulative)
Table 4.2 Global Tire Derived Fuel (TDF) Market, by Shredded Tire Forecast 2019-2029 (TT, $ mn, AGR %, CAGR %, Cumulative)
Table 4.3 Global Tire Derived Fuel (TDF) Market, by Shredded Tire Driver & Restraints
Table 4.4 Global Tire Derived Fuel (TDF) Market, by Whole Tire Forecast 2019-2029 (TT, $ mn, AGR %, CAGR %, Cumulative)
Table 4.5 Global Tire Derived Fuel (TDF) Market, by Whole Tire Drivers and Restraints
Table 4.6 Global Tire Derived Fuel (TDF) Market, by End-user Type Forecast 2019-2029 ($mn, AGR %, Cumulative)
Table 4.7 Global Tire Derived Fuel (TDF) Market, by Cement Forecast 2019-2029 (TT, $ mn, AGR %, CAGR %, Cumulative)
Table 4.8 Global Tire Derived Fuel (TDF) Market, by Cement Driver & Restraints
Table 4.9 Global Tire Derived Fuel (TDF) Market, by Pulp & Paper Forecast 2019-2029 (TT, $ mn, AGR %, CAGR %, Cumulative)
Table 4.10 Global Tire Derived Fuel (TDF) Market, by Pulp & Paper Drivers and Restraints
Table 4.11 Global Tire Derived Fuel (TDF) Market, by Boiler Forecast 2019-2029 (TT, $ mn, AGR %, CAGR %, Cumulative)
Table 4.12 Global Tire Derived Fuel (TDF) Market, by Boiler Drivers and Restraints
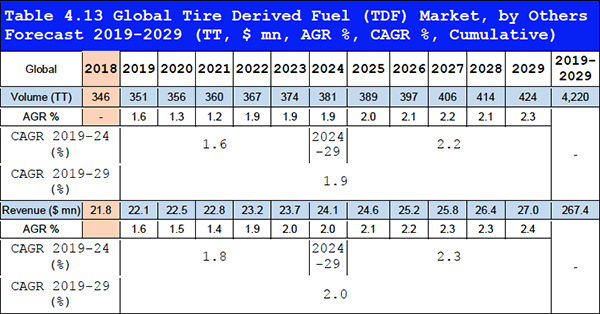
Table 4.13 Global Tire Derived Fuel (TDF) Market, by Others Forecast 2019-2029 (TT, $ mn, AGR %, CAGR %, Cumulative)
Table 4.14 Global Tire Derived Fuel (TDF) Market, by Others Drivers and Restraints
Table 5.1 Global Tire Derived Fuel (TDF) Market by Country Forecast 2019-2029 Volume (Thousand Tons, AGR %, Cumulative)
Table 5.1 Global Tire Derived Fuel (TDF) Market by Country Forecast 2019-2029 ($ mn, AGR %, Cumulative)
Table 5.3 U.S. Tire Derived Fuel (TDF) Market Forecast 2019-2029 (TT, $ mn, AGR %, CAGR %, Cumulative)
Table 5.4 U.S. Tire Derived Fuel (TDF) Market, by Tire Type Forecast 2019-2029 ($mn, AGR %, Cumulative)
Table 5.5 U.S. Tire Derived Fuel (TDF) Market, by End-user Type Forecast 2019-2029 ($mn, AGR %, Cumulative)
Table 5.6 Canada Tire Derived Fuel (TDF) Market Forecast 2019-2029 (TT, $ mn, AGR %, CAGR %, Cumulative)
Table 5.7 Canada Tire Derived Fuel (TDF) Market, by Tire Type Forecast 2019-2029 ($mn, AGR %, Cumulative)
Table 5.8 Canada Tire Derived Fuel (TDF) Market, by End-user Type Forecast 2019-2029 ($mn, AGR %, Cumulative)
Table 5.9 Japan Tire Derived Fuel (TDF) Market Forecast 2019-2029 (TT, $ mn, AGR %, CAGR %, Cumulative)
Table 5.10 Japan Tire Derived Fuel (TDF) Market, by Tire Type Forecast 2019-2029 ($mn, AGR %, Cumulative)
Table 5.11 Japan Tire Derived Fuel (TDF) Market, by End-user Type Forecast 2019-2029 ($mn, AGR %, Cumulative)
Table 5.12 India Tire Derived Fuel (TDF)Market Forecast 2018-2029 (TT, $ mn, AGR %, CAGR %, Cumulative)
Table 5.13 India Tire Derived Fuel (TDF) Market, by Tire Type Forecast 2019-2029 ($mn, AGR %, Cumulative)
Table 5.14 India Tire Derived Fuel (TDF) Market, by End-user Type Forecast 2019-2029 ($mn, AGR %, Cumulative)
Table 5.15 Rest of Asia Pacific Tire Derived Fuel (TDF) Market Forecast 2019-2029 (TT, $ mn, AGR %, CAGR %, Cumulative)
Table 5.16 Rest of Asia Pacific Tire Derived Fuel (TDF) Market, by Tire Type Forecast 2019-2029 ($mn, AGR %, Cumulative)
Table 5.17 Rest of Asia Pacific Tire Derived Fuel (TDF) Market, by End-user Type Forecast 2019-2029 ($mn, AGR %, Cumulative)
Table 5.18 U.K. Tire Derived Fuel(TDF)Market Forecast 2019-2029 (TT, $ mn, AGR %, CAGR %, Cumulative)
Table 5.19 U.K. Tire Derived Fuel (TDF) Market, by Tire Type Forecast 2019-2029 ($mn, AGR %, Cumulative)
Table 5.20 U.K. Tire Derived Fuel (TDF) Market, by End-user Type Forecast 2019-2029 ($mn, AGR %, Cumulative)
Table 5.21 Germany Tire Derived Fuel (TDF) Market Forecast 2019-2029 (TT, $ mn, AGR %, CAGR %, Cumulative)
Table 5.22 Germany Tire Derived Fuel (TDF) Market, by Tire Type Forecast 2019-2029 ($mn, AGR %, Cumulative)
Table 5.23 Germany Tire Derived Fuel (TDF) Market, by End-user Type Forecast 2019-2029 ($mn, AGR %, Cumulative)
Table 5.24 Rest of Europe Tire Derived Fuel (TDF) Market Forecast 2019-2029 (TT, $ mn, AGR %, CAGR %, Cumulative)
Table 5.25 Rest of Europe Tire Derived Fuel (TDF) Market, by Tire Type Forecast 2019-2029 ($mn, AGR %, Cumulative)
Table 5.26 Rest of Europe Tire Derived Fuel (TDF) Market, by End-user Type Forecast 2019-2029 ($mn, AGR %, Cumulative)
Table 5.27 Rest of the World Tire Derived Fuel (TDF) Market Forecast 2019-2029 (TT, $ mn, AGR %, CAGR %, Cumulative)
Table 5.28 Rest of the World Tire Derived Fuel (TDF) Market, by Tire Type Forecast 2019-2029 ($mn, AGR %, Cumulative)
Table 5.29 Rest of the World Tire Derived Fuel (TDF) Market, by End-user Type Forecast 2019-2029 ($mn, AGR %, Cumulative)
Table 6.1 PESTEL Analysis, Tire Derived Fuel (TDF) Market
Table 8.1 Liberty Tire Recycling Profile 2017 (Market Entry, Public/Private, Headquarter, Total Company Sales $mn, Geography, Key Market, Company Sales from Tire Derived Fuel Market, Region, Business Segment in the Market, Submarket Involvement, No. of Employees)
Table 8.2 Ragn-Sells Group Profile 2017 (Market Entry, Public/Private, Headquarter, Total Company Sales $mn, Geography, Key Market, Company Sales from Tire Derived Fuel Market, Region, Business Segment in the Market, Submarket Involvement, No. of Employees)
Table 8.3 ResourceCo Pty Ltd. Profile 2017 (Market Entry, Public/Private, Headquarter, Total Company Sales $mn, Geography, Key Market, Company Sales from Tire Derived Fuel Market, Region, Business Segment in the Market, Submarket Involvement, No. of Employees)
Table 8.4 Lakin Tire West Inc. Profile 2017 (Market Entry, Public/Private, Headquarter, Total Company Sales $mn, Geography, Key Market, Company Sales from Tire Derived Fuel Market, Region, Business Segment in the Market, Submarket Involvement, No. of Employees)
Table 8.5 L & S Tire Company Profile 2017 (Market Entry, Public/Private, Headquarter, Total Company Sales $mn, Geography, Key Market, Company Sales from Tire Derived Fuel Market, Region, Business Segment in the Market, Submarket Involvement, No. of Employees)
Table 8.6 Probio Energy International Company Profile 2017 (Market Entry, Public/Private, Headquarter, Total Company Sales $mn, Geography, Key Market, Company Sales from Tire Derived Fuel Market, Region, Business Segment in the Market, Submarket Involvement, No. of Employees)
Table 8.7 Renelux Cyprus Ltd Company Profile 2017 (Market Entry, Public/Private, Headquarter, Total Company Sales $mn, Geography, Key Market, Company Sales from Tire Derived Fuel Market, Region, Business Segment in the Market, Submarket Involvement, No. of Employees)
Table 8.8 Globarket Tire Recycling LLC Company Profile 2017 (Market Entry, Public/Private, Headquarter, Total Company Sales $mn, Geography, Key Market, Company Sales from Tire Derived Fuel Market, Region, Business Segment in the Market, Submarket Involvement, No. of Employees)
Table 8.9 Emanuel Tire, LLC Company Profile 2017 (Market Entry, Public/Private, Headquarter, Total Company Sales $mn, Geography, Key Market, Company Sales from Tire Derived Fuel Market, Region, Business Segment in the Market, Submarket Involvement, No. of Employees)
Table 8.10 Other Companies Involved in the Tire Derived Fuels Market
List of Figures
Figure 1.1 The Tire Derived Fuel (TDF) Market by Country/Region Market Share Forecast 2018, 2024, 2029 (% Share)
Figure 2.1 Global Tire Derived Fuel (TDF) Market Segmentation Overview
Figure 2.2 Tire-derived Fuel-Value Chain Analysis
Figure 3.1 Global Tire Derived Fuel (TDF) Market Forecast 2019-2029 (TT, AGR%)
Figure 3.2 Global Tire Derived Fuel (TDF) Market Forecast 2019-2029 ($ mn, AGR %)
Figure 3.3 Global Tire Derived Fuel (TDF), by Application Submarket Forecast 2019-2029 (TT)
Figure 3.4 Regional Tire Derived Fuel (TDF) Market Forecast 2019-2029 ($mn)
Figure 3.5 Global Tire Derived Fuel (TDF) Market by Regional % Share Forecast 2019, 2024, 2029 (Revenue)
Figure 3.6 Global Tire Derived Fuel (TDF) Forecast 2019-2029, by Region (AGR %)
Figure 3.7 U.S. Tire-derived Fuel Consumed for Cement Kilns (Thousand Tons), 2011, 2013, 2015, and 2017
Figure 3.8 Global Vehicle Production (Million Units), 2013–2016
Figure 4.1 Global Tire Derived Fuel (TDF), by Tire Type Submarket Forecast 2019-2029 (TT)
Figure 4.2 Global Tire Derived Fuel (TDF), by Tire Type Submarket Forecast 2019-2029 ($mn)
Figure 4.3 Global Tire Derived Fuel (TDF) Market by Tire Type (Revenue) Share Forecast 2019, 2024, 2029 (% Share)
Figure 4.4 Global Tire Derived Fuel (TDF) Market, By Shredded Tire Forecast 2019-2029 (TT, AGR%)
Figure 4.5 Global Tire Derived Fuel (TDF) Market, by Shredded Tire Forecast 2019-2029 ($ mn, AGR %)
Figure 4.6 Tire Derived Fuel (TDF) Market, By Whole Tire Forecast 2019-2029 (TT, AGR%)
Figure 4.7 Tire Derived Fuel (TDF) Market, By Whole Tire Forecast 2019-2029 ($ mn, AGR%)
Figure 4.8 Global Tire Derived Fuel (TDF) Market, Comparison Matrix, by Tire Type VS Region (Comparison Matrix)
Figure 4.9 Global Tire Derived Fuel (TDF), by End-user Submarket Forecast 2019-2029 (TT)
Figure 4.10 Global Tire Derived Fuel (TDF), by End-user Submarket Forecast 2019-2029 ($mn)
Figure 4.11 Global Tire Derived Fuel (TDF) Market by End-user (Revenue) Share Forecast 2019, 2024, 2029 (% Share)
Figure 4.12 Global Tire Derived Fuel (TDF) Market, By Cement Forecast 2019-2029 (TT, AGR%)
Figure 4.13 Global Tire Derived Fuel (TDF) Market, by Cement Forecast 2019-2029 ($ mn, AGR %)
Figure 4.14 Tire Derived Fuel (TDF) Market, By Pulp & Paper Forecast 2019-2029 (TT, AGR%)
Figure 4.15 Tire Derived Fuel (TDF) Market, By Pulp & Paper Forecast 2019-2029 ($ mn, AGR%)
Figure 4.16 Tire Derived Fuel (TDF) Market, By Boiler Forecast 2019-2029 (TT, AGR%)
Figure 4.17 Tire Derived Fuel (TDF) Market, By Boiler Forecast 2019-2029 ($ mn, AGR%)
Figure 4.18 Tire Derived Fuel (TDF) Market, By Others Forecast 2019-2029 (TT, AGR%)
Figure 4.19 Tire Derived Fuel (TDF) Market, By Others Forecast 2019-2029 ($ mn, AGR%)
Figure 4.20 Global Tire Derived Fuel (TDF) Market, Comparison Matrix, by End-user Type VS Region (Comparison Matric)
Figure 5.1 Global Tire Derived Fuel (TDF) Market Forecast by Leading Nations, Volume (TT)
Figure 5.2 Global Tire Derived Fuel (TDF) Market Forecast by Leading Nations (Revenue), by AGR (%)
Figure 5.3 Global Tire Derived Fuel (TDF) Market Forecast by Leading Nations ($ mn)
Figure 5.4 Leading Country/Regional Tire Derived Fuel (TDF) Market Share Forecast 2019 (% Share)
Figure 5.5 Leading Country/Regional Tire Derived Fuel (TDF) Market Share Forecast 2024 (% Share)
Figure 5.6 Leading Country/Regional Tire Derived Fuel (TDF) Market Share Forecast 2029 (% Share)
Figure 5.7 U.S. Tire Derived Fuel (TDF) Market Forecast 2019-2029 (TT, AGR%)
Figure 5.8 U.S. Tire Derived Fuel (TDF) Market Forecast 2019-2029 ($mn, AGR%)
Figure 5.9 U.S. Tire Derived Fuel (TDF) Market Share Forecast 2019, 2024, 2029 (% Share)
Figure 5.10 U.S. Tire Derived Fuel (TDF), by Tire Type Submarket Forecast 2019-2029(TT)
Figure 5.11 U.S. Tire Derived Fuel (TDF) Market Forecast 2019-2029, by Tire Type($mn, AGR%)
Figure 5.12 U.S. Tire Derived Fuel (TDF) Market Share Forecast 2019, 2024, 2029 (% Share), by Tire Type, Revenue ($ mn)
Figure 5.13 U.S. Tire Derived Fuel (TDF), by End-user Submarket Forecast 2019-2029 (TT)
Figure 5.14 U.S. Tire Derived Fuel (TDF) Market Forecast 2019-2029, by End-user ($mn, AGR%)
Figure 5.15 U.S. Tire Derived Fuel (TDF) Market Share Forecast 2019, 2024, 2029 (% Share), by End-user
Figure 5.16 Canada Tire Derived Fuel (TDF) Market Forecast 2019-2029 (TT, AGR%)
Figure 5.17 Canada Tire Derived Fuel (TDF) Market Forecast 2019-2029 ($mn, AGR%)
Figure 5.18 Canada Tire Derived Fuel (TDF) Market Share Forecast 2019, 2024, 2029 (% Share)
Figure 5.19 Canada Tire Derived Fuel (TDF), by Tire Type Submarket Forecast 2019-2029 (TT)
Figure 5.20 Canada Tire Derived Fuel (TDF) Market Forecast 2019-2029, by Tire Type($mn, AGR%)
Figure 5.21 Canada Tire Derived Fuel (TDF) Market Share Forecast 2019, 2024, 2029 (% Share), by Tire Type, Revenue ($ mn)
Figure 5.22 Canada Tire Derived Fuel (TDF), by End-user Submarket Forecast 2019-2029 (TT)
Figure 5.23 Canada Tire Derived Fuel (TDF) Market Forecast 2019-2029, by End-user ($mn, AGR%)
Figure 5.24 Canada Tire Derived Fuel (TDF) Market Share Forecast 2019, 2024, 2029 (% Share), by End-user
Figure 5.25 Japan Tire Derived Fuel (TDF) Market Forecast 2019-2029 (TT, AGR%)
Figure 5.26 Japan Tire Derived Fuel (TDF) Market Forecast 2019-2029 ($mn, AGR%)
Figure 5.27 Japan Tire Derived Fuel (TDF) Market Share Forecast 2019, 2024, 2029 (% Share)
Figure 5.28 Japan Tire Derived Fuel (TDF), by Tire Type Submarket Forecast 2019-2029(TT)
Figure 5.29 Japan Tire Derived Fuel (TDF) Market Forecast 2019-2029, by Tire Type($mn, AGR%)
Figure 5.30 Japan Tire Derived Fuel (TDF) Market Share Forecast 2019, 2024, 2029 (% Share), by Tire Type, Revenue ($ mn)
Figure 5.31 Japan Tire Derived Fuel (TDF), by End-user Submarket Forecast 2019-2029 (TT)
Figure 5.32 Japan Tire Derived Fuel (TDF) Market Forecast 2019-2029, by End-user ($mn, AGR%)
Figure 5.33 Japan Tire Derived Fuel (TDF) Market Share Forecast 2019, 2024, 2029 (% Share), by End-user
Figure 5.34 India Tire Derived Fuel (TDF) Market Forecast 2019-2029 (TT, AGR%)
Figure 5.35 India Tire Derived Fuel (TDF) Market Forecast 2019-2029 ($mn, AGR%)
Figure 5.36 India Tire Derived Fuel (TDF) Market Share Forecast 2019, 2024, 2029 (% Share)
Figure 5.37 India Tire Derived Fuel (TDF), by Tire Type Submarket Forecast 2019-2029 (TT)
Figure 5.38 India Tire Derived Fuel (TDF) Market Forecast 2019-2029, by Tire Type($mn, AGR%)
Figure 5.39 India Tire Derived Fuel (TDF) Market Share Forecast 2019, 2024, 2029 (% Share), by Tire Type, Revenue ($ mn)
Figure 5.40 India Tire Derived Fuel (TDF), by End-user Submarket Forecast 2019-2029 (TT)
Figure 5.41 India Tire Derived Fuel (TDF) Market Forecast 2019-2029, by End-user ($mn, AGR%)
Figure 5.42 India Tire Derived Fuel (TDF) Market Share Forecast 2019, 2024, 2029 (% Share), by End-user
Figure 5.43 Rest of Asia Pacific Tire Derived Fuel (TDF) Market Forecast 2019-2029 (TT, AGR%)
Figure 5.44 Rest of Asia Pacific Tire Derived Fuel (TDF) Market Forecast 2019-2029 ($mn, AGR%)
Figure 5.45 Rest of Asia Pacific Tire Derived Fuel (TDF) Market Share Forecast 2019, 2024, 2029 (% Share)
Figure 5.46 Rest of Asia Pacific Tire Derived Fuel (TDF), by Tire Type Submarket Forecast 2019-2029 (TT)
Figure 5.47 Rest of Asia Pacific Tire Derived Fuel (TDF) Market Forecast 2019-2029, by Tire Type($mn, AGR%)
Figure 5.48 Rest of Asia Pacific Tire Derived Fuel (TDF) Market Share Forecast 2019, 2024, 2029 (% Share), by Tire Type, Revenue ($ mn)
Figure 5.49 Rest of Asia Pacific Tire Derived Fuel (TDF), by End-user Submarket Forecast 2019-2029 (TT)
Figure 5.50 Rest of Asia Pacific Tire Derived Fuel (TDF) Market Forecast 2019-2029, by End-user ($mn, AGR%)
Figure 5.51 Rest of Asia Pacific Tire Derived Fuel (TDF) Market Share Forecast 2019, 2024, 2029 (% Share), by End-user
Figure 5.52 U.K. Tire Derived Fuel (TDF) Market Forecast 2019-2029 (TT, AGR%)
Figure 5.53 U.K. Tire Derived Fuel (TDF) Market Forecast 2019-2029 ($mn, AGR%)
Figure 5.54 U.K. Tire Derived Fuel (TDF) Market Share Forecast 2019, 2024, 2029 (% Share)
Figure 5.55 U.K. Tire Derived Fuel (TDF), by Tire Type Submarket Forecast 2019-2029 (TT)
Figure 5.56 U.K. Tire Derived Fuel (TDF) Market Forecast 2019-2029, by Tire Type ($mn, AGR%)
Figure 5.57 U.K. Tire Derived Fuel (TDF) Market Share Forecast 2019, 2024, 2029 (% Share), by Tire Type, Revenue ($ mn)
Figure 5.58 U.K. Tire Derived Fuel (TDF), by End-user Submarket Forecast 2019-2029 (TT)
Figure 5.59 U.K. Tire Derived Fuel (TDF) Market Forecast 2019-2029, by End-user ($mn, AGR%)
Figure 5.60 U.K. Tire Derived Fuel (TDF) Market Share Forecast 2019, 2024, 2029 (% Share), by End-user
Figure 5.61 Germany Tire Derived Fuel (TDF) Market Forecast 2019-2029 (TT, AGR%)
Figure 5.62 Germany Tire Derived Fuel (TDF) Market Forecast 2019-2029 ($mn, AGR%)
Figure 5.63 Germany Tire Derived Fuel (TDF) Market Share Forecast 2019, 2024, 2029 (% Share)
Figure 5.64 Germany Tire Derived Fuel (TDF), by Tire Type Submarket Forecast 2019-2029(TT)
Figure 5.65 Germany Tire Derived Fuel (TDF) Market Forecast 2019-2029, by Tire Type($mn, AGR%)
Figure 5.66 Germany Tire Derived Fuel (TDF) Market Share Forecast 2019, 2024, 2029 (% Share), by Tire Type, Revenue ($ mn)
Figure 5.67 Germany Tire Derived Fuel (TDF), by End-user Submarket Forecast 2019-2029 (TT)
Figure 5.68 Germany Tire Derived Fuel (TDF) Market Forecast 2019-2029, by End-user ($mn, AGR%)
Figure 5.69 Germany Tire Derived Fuel (TDF) Market Share Forecast 2019, 2024, 2029 (% Share), by End-user
Figure 5.70 Rest of Europe Tire Derived Fuel (TDF) Market Forecast 2019-2029 (TT, AGR%)
Figure 5.71 Rest of Europe Tire Derived Fuel (TDF) Market Forecast 2019-2029 ($mn, AGR%)
Figure 5.72 Rest of Europe Tire Derived Fuel (TDF) Market Share Forecast 2019, 2024, 2029 (% Share)
Figure 5.73 Rest of Europe Tire Derived Fuel (TDF), by Tire Type Submarket Forecast 2019-2029 (TT)
Figure 5.74 Rest of Europe Tire Derived Fuel (TDF) Market Forecast 2019-2029, by Tire Type ($mn, AGR%)
Figure 5.75 Rest of Europe Tire Derived Fuel (TDF) Market Share Forecast 2019, 2024, 2029 (% Share), by Tire Type, Revenue ($ mn)
Figure 5.76 Rest of Europe Tire Derived Fuel (TDF), by End-user Submarket Forecast 2019-2029 (TT)
Figure 5.77 Rest of Europe Tire Derived Fuel (TDF) Market Forecast 2019-2029, by End-user ($mn, AGR%)
Figure 5.78 Rest of Europe Tire Derived Fuel (TDF) Market Share Forecast 2019, 2024, 2029 (% Share), by End-user
Figure 5.79 Rest of the World Tire Derived Fuel (TDF) Market Forecast 2019-2029 (TT, AGR%)
Figure 5.80 Rest of the World Tire Derived Fuel (TDF) Market Forecast 2019-2029 ($mn, AGR%)
Figure 5.81 Rest of the World Tire Derived Fuel (TDF) Market Share Forecast 2019, 2024, 2029 (% Share)
Figure 5.82 Rest of the World Tire Derived Fuel (TDF), by Tire Type Submarket Forecast 2019-2029 (TT)
Figure 5.83 Rest of the World Tire Derived Fuel (TDF) Market Forecast 2019-2029, by Tire Type ($mn, AGR%)
Figure 5.84 Rest of the World Tire Derived Fuel (TDF) Market Share Forecast 2019, 2024, 2029 (% Share), by Tire Type, Revenue ($ mn)
Figure 5.85 Rest of the World Tire Derived Fuel (TDF), by End-user Submarket Forecast 2019-2029 (TT)
Figure 5.86 Rest of the World Tire Derived Fuel (TDF) Market Forecast 2019-2029, by End-user ($mn, AGR%)
Figure 5.87 Rest of the World Tire Derived Fuel (TDF) Market Share Forecast 2019, 2024, 2029 (% Share), by End-user
Figure 8.1 Ragn-Sells % outgoing materials from facilities
Figure 8.2 Global Tire-derived Fuel Market Share Analysis, by Company (2018)
Figure 9.1 Global Tire Derived Fuel (TDF) Market Forecast 2019-2029 ($ mn, TT, AGR %)
All American Tire Recycling
Ambuia Cements Ltd.
Ash Grove Cement Company
BDS Waste Disposal
Bridgestone Corporation
C&R Tire Recycling Pty Ltd
CalPortland
Cemex SAB de CV
Cherry Companies
Colt, Inc. Scrap Tire Centers
Columbus McKinnon Corporation
Continental AG
Dunlop
Emanuel Tire LLC
Emterra Group Inc.
ETR Group
Firestone
Front Range Tire Recycle Inc.
Global Tire Recycling
Globarket Tire Recycling LLC
Golden Bay Cement
HeidelbergCement
Hikari World Co. Ltd
Holcim NZ
Kokubu Shokai Inc.
L&S Tire Company
LafargeHolcim
Lakin Tire West Inc.
Liberty Tire Recycling
Michelin Group
MS Tire recycling LLC
New River Tire Recycling
New Zealand Steel
Pan Pac
Penn Turf Inc.
Probio Energy International
Ragn-Sells Group
RCBC Global Inc.
Recycling Equipment Canada
Reliable Tire Disposal
Renelux Cyprus Ltd.
ResourceCO Ltd
RMB Group
Ruixin Environmental Specialty Manufacturing Co. Ltd.
Texas-Lehigh Cement Co.
The Goodyear Tire & Rubber Company
The Monarch Cement Company
Tire Disposal & Recycling Inc.
Tirebin
Toyo Tire & Rubber Co. Ltd.
UltraTech Cement Ltd
West Coast Rubber Recycling Inc.
Wheelabrator Technologies Inc.
Organisations Mentioned
Clean Energy Finance Corporation (CEFC)
U.S. Environmental Protection Agency (EPA)
Download sample pages
Complete the form below to download your free sample pages for The Tire Derived Fuel (TDF) Market Forecast 2019-2029
Related reports
-

Bag Filter Market Forecast Report 2019-2029
Our 147-page report provides 138 tables, charts, and graphs covering 16 leading and distinct submarkets. Discover the most lucrative areas...Full DetailsPublished: 04 September 2019 -

Waste to Energy (WtE) Yearbook 2018
Visiongain assesses that CAPEX on Waste-to-Energy will reach $15.4bn in 2018.
...Full DetailsPublished: 28 September 2018 -

The Plastic-to-Fuel Technologies Market Forecast 2019-2029
Rising usage of plastics is the key driver for oil demand as various chemicals / petrochemicals used in plastics are...
Full DetailsPublished: 14 February 2019 -

Landfill Gas to Energy Market Report 2019-2029
Visiongain has calculated that the global landfill gas to energy market will see a total expenditure of $3.659bn in 2019,...
Full DetailsPublished: 05 July 2019 -

Combined Heat & Power (CHP) Installation Market Forecast 2019-2029
The $800 million combined heat and power installation sector is expected to flourish in the next few years because of...Full DetailsPublished: 10 January 2019 -

Oil Refineries Market Report 2018-2028
With the recent upswing in oil prices these margins are again rising and Visiongain expects the value of the refinery...Full DetailsPublished: 24 July 2018 -

Commercial Aircraft Disassembly, Dismantling & Recycling Market Report 2018-2028
Visiongain assesses that the Commercial Aircraft Disassembly, Dismantling & Recycling market will reach US$6.1bn in 2018. ...Full DetailsPublished: 13 September 2018 -

The Plastic-to-Fuel Technologies Market Forecast 2020-2030
Plastics-to-fuel technologies complement plastics recycling by converting non-recycled plastics into valuable products. Plastics-to-fuel technologies offer the opportunity to reduce greenhouse...
Full DetailsPublished: 23 January 2020 -

Zero Liquid Discharge (ZLD) Market Forecast 2019-2029
Visiongain assesses that the global waste-to-energy market will experience spending of $721m in 2019. Read on to discover the potential...
Full DetailsPublished: 16 August 2019 -

Van Market Outlook Report 2019-2029
The $40bn van market is expected to flourish in the next few years because of Increasing demand for vans especially...
Full DetailsPublished: 13 November 2018
Download sample pages
Complete the form below to download your free sample pages for The Tire Derived Fuel (TDF) Market Forecast 2019-2029
Do you have any custom requirements we can help you with?
Any specific country, geo region, market segment or specific company information?
Email us today, we can discuss your needs and see how we can help: jamie.roberts@visiongain.com
Would you like a free report overview of the report of your choice?
If so, please drop an email to Jamie Roberts stating your chosen report title to jamie.roberts@visiongain.com
Visiongain energy reports are compiled using a broad and rich mixture of both primary and secondary information to produce an overall industry outlook. In order to provide our clients with the best product possible product, we do not rely on any one single source of information. Visiongain analysts reach out to market-leading vendors and industry experts where possible but also review a wealth of financial data and product information from a vast range of sources. To find out more about our reports methodology, please email jamie.roberts@visiongain.com
Would you like to get the latest Visiongain energy reports catalogue?
What are the dynamic growth sectors? where are the regional business opportunities?
Which technologies will prevail and who are the leading companies succeeding in these sectors and why?
If you want definitive answers to business critical questions, discover Visiongain’s full range of business intelligence reports.
If so, please email Jamie Roberts on jamie.roberts@visiongain.com or call her today on +44 207 336 6100
“The Visiongain report was extremely insightful and helped us construct our basic go-to market strategy for our solution.”
H.
“F.B has used Visiongain to prepare two separate market studies on the ceramic proppants market over the last 12 months. These reports have been professionally researched and written and have assisted FBX greatly in developing its business strategy and investment plans.”
F.B
“We just received your very interesting report on the Energy Storage Technologies (EST) Market and this is a very impressive and useful document on that subject.”
I.E.N
“Visiongain does an outstanding job on putting the reports together and provides valuable insight at the right informative level for our needs. The EOR Visiongain report provided confirmation and market outlook data for EOR in MENA with the leading countries being Oman, Kuwait and eventually Saudi Arabia.”
E.S
“Visiongain produced a comprehensive, well-structured GTL Market report striking a good balance between scope and detail, global and local perspective, large and small industry segments. It is an informative forecast, useful for practitioners as a trusted and upto-date reference.”
Y.N Ltd
Association of Dutch Suppliers in the Oil & Gas Industry
Society of Naval Architects & Marine Engineers
Association of Diving Contractors
Association of Diving Contractors International
Associazione Imprese Subacquee Italiane
Australian Petroleum Production & Exploration Association
Brazilian Association of Offshore Support Companies
Brazilian Petroleum Institute
Canadian Energy Pipeline
Diving Medical Advisory Committee
European Diving Technology Committee
French Oil and Gas Industry Council
IMarEST – Institute of Marine Engineering, Science & Technology
International Association of Drilling Contractors
International Association of Geophysical Contractors
International Association of Oil & Gas Producers
International Chamber of Shipping
International Shipping Federation
International Marine Contractors Association
International Tanker Owners Pollution Federation
Leading Oil & Gas Industry Competitiveness
Maritime Energy Association
National Ocean Industries Association
Netherlands Oil and Gas Exploration and Production Association
NOF Energy
Norsk olje og gass Norwegian Oil and Gas Association
Offshore Contractors’ Association
Offshore Mechanical Handling Equipment Committee
Oil & Gas UK
Oil Companies International Marine Forum
Ontario Petroleum Institute
Organisation of the Petroleum Exporting Countries
Regional Association of Oil and Natural Gas Companies in Latin America and the Caribbean
Society for Underwater Technology
Society of Maritime Industries
Society of Petroleum Engineers
Society of Petroleum Enginners – Calgary
Step Change in Safety
Subsea UK
The East of England Energy Group
UK Petroleum Industry Association
All the events postponed due to COVID-19.
Don’t Miss Out!
Subscribe to receive the latest Industry news, trending insight and analysis straight to your inbox.Choose your preferences:
Latest Energy news
Energy as a Service (EaaS) Market
The global Energy as a Service (EaaS) market is projected to grow at a CAGR of 12.6% by 2034
25 July 2024
Synthetic Fuels Market
The global Synthetic Fuels market is projected to grow at a CAGR of 23% by 2034
18 July 2024
Power-to-X (P2X) Market
The global Power-to-X (P2X) market is projected to grow at a CAGR of 10.6% by 2034
09 July 2024
Airborne Wind Energy Market
The global Airborne Wind Energy market is projected to grow at a CAGR of 9.7% by 2034
05 June 2024
