• Do you need definitive van market data?
• Succinct van market analysis?
• Technological insight?
• Clear competitor analysis?
• Actionable business recommendations?
Read on to discover how this definitive report can transform your own research and save you time.
The increasing mergers and acquisition in this sector, have led Visiongain to publish this timely report. The $40bn van market is expected to flourish in the next few years because of Increasing demand for vans especially in North America, Asia Pacific automobile sector modernization and increasing online delivery services.
If you want to be part of this growing industry, then read on to discover how you can maximise your investment potential.
Report highlights
• 98 Tables, Charts, And Graphs
• Analysis Of Key Players In The Van Market
• Ford Motor Company
• Citroen
• Fiat Automobiles S.p.A
• Iveco
• Daimler AG
• Mitsubishi Motors
• Nissan
• Peugeot
• Groupe Renault
• Toyota Motor Corporation
• General Motors Company
• Volkswagen of America, Inc.
• Tata Group
• Mahindra And Mahindra Limited
Global Van Market Forecast From 2019-2029 ($m & unit sales)
Van End User Forecasts From 2019-2029 ($m & unit sales)
• Commercial Van Forecast 2019-2029 ($m & unit sales)
• Personal Van Forecast 2019-2029 ($m & unit sales)
• Emergency Van Forecast 2019-2029 ($m & unit sales)
• Others Van Forecast 2019-2029 ($m & unit sales)
Regional Van Market Forecasts From 2019-2029 ($m & unit sales)
North America Van Market 2019-2029 ($m & unit sales)
• U.S. Van Market 2019-2029 ($m)
• Canada Van Market 2019-2029 ($m)
• Rest of North America Van Market 2019-2029 ($m)
Europe Van Market 2019-2029 ($m & unit sales)
• France Van Market 2019-2029 ($m)
• Germany Van Market 2019-2029 ($m)
• U.K Van Market 2019-2029 ($m)
• Russia Van Market 2019-2029($m)
• Spain Van Market 2019-2029 ($m)
• Italy Van Market 2019-2029 ($m)
• Rest of Europe Van Market 2019-2029 ($m)
Asia-Pacific Van Market 2019-2029 ($m & unit sales)
• China Van Market 2019-2029 ($m)
• India Van Market 2019-2029 ($m)
• Japan Van Market 2019-2029 ($m)
• Australia Van Market 2019-2029 ($m)
• South Korea Van Market 2019-2029 ($m)
• Rest of APAC Van Market 2019-2029 ($m)
Latin America Middle East & Africa Van Market 2019-2029 ($m & unit sales)
• Brazil Van Market 2019-2029 ($m)
• MEA Van Market 2019-2029 ($m)
• Rest of Latin America Van Market 2019-2029 ($m)
Key questions answered
• What does the future hold for the van industry?
• Where should you target your business strategy?
• Which end-user should you focus upon?
• Which company is likely to success and why?
• What business models should you adopt?
• What industry trends should you be aware of?
Target audience
• Van manufacturers
• Automotive OEMs
• Logistics & delivery companies
• Leasing companies
• Van hire companies
• Automobile organizations
• Technology investors
• Automobile investors
• Market analysts
• Consultants
• Banks
• Regulators
• Associations
• Investors
• Automobile industry bodies
• Automobile regulators and other policy makers
• National and international automobile authorities
• Business, marketing or competitive intelligence manager
• Business intelligence consultant
• Marketing manager
• Business development manager
• Product development manager
• Chief executive officer (CEO)
• Commercial director
• Sales manager
• R&D manager
Visiongain is a trading partner with the US Federal Government
CCR Ref number: KD4R6
1. Report Overview
1.1 Global Van Market Overview
1.2 Why You Should Read This Report
1.3 How This Report Delivers 9
1.4 Key Questions Answered by This Analytical Report Include:
1.5 Who is This Report For?.
1.6 Methodology
1.6.1 Research.
1.6.2 Market Evaluation & Forecasting Methodology
1.7 Frequently Asked Questions (FAQ)
1.8 Associated Visiongain Reports
1.9 About Visiongain
2. Introduction to the Van Market
2.1 Global Van Market Structure
2.2 Van Market Definition
2.3 Van Market By Usage Type Submarket Definition
3. Global Van Market 2019-2029
3.1 Global Van Market Forecast 2019-2029
3.2 Global Van Market Dynamics 2019
3.2.1 Drivers
3.2.2 Restraints
4. Global Van Market By End-User 2019-2029
4.1 Global Commercial Van Submarket Forecast By Regional Market 2019-2029
4.2 Global Emergency Van Submarket Forecast 2019-2029
4.3 Global Personal Van Submarket Forecast 2019-2029
4.4 Global Others Van Submarket Forecast 2019-2029.
5. Global Van Market Regional Forecast 2019-2029
5.1 North America Van Market Forecast 2019-2029
5.1.1 North America Van Market by End-User Forecast 2019-2029
5.1.3 North America Van Market Drivers & Restraints
5.2 Europe Van Market Forecast 2019-2029.
5.2.1 Europe Van Market by End-User Forecast 2019-2029.
5.2.3 Europe Van Market Drivers & Restraints.
5.3 Asia-Pacific Van Market Forecast 2019-2029
5.3.1 Asia Pacific Van Market by End-User Forecast 2019-2029
5.3.1.1 China Van Market Analysis
5.3.1.2 India Van Market Analysis
5.3.1.3 Japan Van Market Analysis
5.3.1.4 Australia Van Market Analysis
5.3.1.5 South Korea Van Market Analysis
5.3.3 Asia-Pacific Van Market Drivers & Restraints
5.4 Latin America and Middle East and Africa Van Market Forecast 2019-2029
5.4.1 Latin America and Middle East Van Market by End-User Forecast 2019-2029
5.4.1.1 Brazil Van Market Analysis
5.4.1.2 Latin America and Middle East and Africa Van Market Analysis
5.4.3 Latin America and Middle East and Africa Van Market Drivers & Restraints
6. Leading 14 Van Companies
6.1 Ford Motor Company
6.1.1 Ford Motor Company Key Developments 2017-2018
6.1.2 Ford Motor Company Primary Market Competitors 2019
6.1.3 Ford Motor Company Analysis and Future Outlook.
6.2 Citroen-Groupe PSA
6.2.1 Citroen-Groupe PSA Key Developments 2018
6.2.2 Citroen- Groupe PSA Primary Market Competitors 2019
6.2.3 Citroen-Groupe PSA Analysis and Future Outlook.
6.3 Fiat Automobiles S.p.A
6.3.1 Fiat Automobiles S.p.A Key Developments 2018
6.3.2 Fiat Automobiles S.p.A Primary Market Competitors 2019
6.3.3 Fiat Automobiles S.p.A Analysis and Future Outlook
6.4 IVECO
6.4.1 IVECO Key Developments 2016-2018
6.4.2 IVECO Primary Market Competitors 2019
6.4.3 IVECO Analysis and Future Outlook
6.5 Daimler AG
6.5.1 Daimler AG Key Developments 2017-2018
6.5.2 Daimler AG Primary Market Competitors 2019
6.5.3 Daimler AG Analysis and Future Outlook
6.6 Mitsubishi Motors
6.6.1 Mitsubishi Motors Key Developments 2016-2018
6.6.2 Mitsubishi Motor Primary Market Competitors 2019
6.6.3 Mitsubishi Analysis and Future Outlook
6.7 Nissan.
6.7.1 Nissan Key Developments 2010-2018
6.7.2 Nissan Primary Market Competitors 2019
6.7.3 Nissan Analysis and Future Outlook
6.8 Peugeot-Groupe PSA
6.8.1 Peugeot-Groupe PSA Key Developments 2017-2018
6.8.2 Peugeot- Groupe PSA Primary Market Competitors 2019
6.8.3 Peugeot-Groupe PSA Analysis and Future Outlook
6.9 Groupe Renault
6.9.1 Groupe Renault Selected Recent Contracts / Projects / Programmes 2017
6.9.2 Groupe Renault Primary Market Competitors 2019
6.9.3 Groupe Renault Analysis and Future Outlook
6.10 Toyota Motor Corporation
6.10.1 Toyota Motor Corporation Selected Recent Contracts / Projects / Programmes 2014-2018.
6.10.2 Toyota Motor Company Primary Market Competitors 2019
6.10.3 Toyota Motor Company Analysis and Future Outlook
6.11 General Motor Company
6.11.1 General Motor Company Selected Recent Contracts / Projects / Programmes 2014-2018
6.11.2 General Motor Company Primary Market Competitors 2019
6.11.3 General Motor Company Analysis and Future Outlook
6.12 Volkswagen of America
6.12.1 Volkswagen of America, Inc. Selected Recent Contracts / Projects / Programmes 2018
6.12.2 Volkswagen of America, Inc. Primary Market Competitors 2019
6.12.3 Volkswagen of America, Inc. Analysis and Future Outlook
6.13 Tata Group
6.13.1 Tata Group Selected Recent Contracts / Projects / Programmes 2011-2018
6.13.2 Tata Group, Inc. Primary Market Competitors 2019
6.13.3 Tata Group Analysis and Future Outlook
6.14 Mahindra & Mahindra
6.14.1 Mahindra & Mahindra Key Developments 2016-2018
6.14.2 Mahindra & Mahindra Primary Market Competitors 2019.
6.14.3 Mahindra & Mahindra Analysis and Future Outlook
7. Conclusions
7.1 Van Market Outlook
7.2 Product in Focus
7.3 Prospective Regions
8. Glossary
List of Tables
Table 1.1 Example of Leading Van Market Forecast 2019-2029 (US$b, AGR %, Cumulative)
Table 3.1 Global Van Market Forecast 2019-2029 (US$b, AGR %, CAGR %, Cumulative)
Table 3.2 Global Van Market Forecast 2019-2029 (Units Sales, CAGR %, Cumulative)
Table 3.3 Global Van Market Drivers & Restraints 2019
Table 4.1 Global Van Market by End-User Submarket Forecast 2019-2029 (US$b, AGR %, Cumulative)
Table 4.2 Global Van Market by End-User Submarket Forecast by Regional Market 2019-2029 (US$b, Cumulative, Global AGR %
Table 4.3 Global Van Market by End-User Submarket CAGR Forecast 2019-2029, 2019-2024, 2024-2029 (CAGR %)
Table 4.4 Global Commercial Van Submarket by Regional Market Forecast 2019-2029 (US$b, AGR %, CAGR %, Cumulative)
Table 4.5 Global Emergency Van Submarket by Regional Market Forecast 2019-2029 (US$b, AGR %, CAGR %, Cumulative)
Table 4.6 Global Personal Van Submarket by Regional Market Forecast 2019-2029 (US$b, AGR %, CAGR %, Cumulative)
Table 4.7 Global Others Van Submarket by Regional Market Forecast 2019-2029 (US$b, AGR %, CAGR %, Cumulative)
Table 4.8 Global Van Submarket Forecast 2019-2029 (Units,CAGR %, Cumulative)
Table 4.9 Global Van Regional Forecast 2019-2029 (Units,CAGR %, Cumulative)
Table 4.10 Global Van Market by End-User Submarket CAGR Forecast 2019-2029, 2019-2024, 2024-2029 (CAGR %) (Volume)
Table 4.11 Global Van Market by Regional Submarket CAGR Forecast 2019-2029, 2019-2024, 2024-2029 (CAGR %) (Volume)
Table 5.1 North America Van Market Forecast 2019-2029 (US$b, Global AGR %, Cumulative)
Table 5.2 Leading National Van Market CAGR Forecast 2019-2029, 2019-2024, 2024-2029 (CAGR %)
Table 5.3 North America Van Market by Country Forecast 2019-2029 (US$b)
Table 5.4 North America Van Market by End-User Submarket Forecast 2019-2029 (US$b)
Table 5.5 North America Van Market by End-User Submarket Forecast 2019-2029 (Units
Table 5.6 North America Van Market Drivers & Restraints 2019
Table 5.7 Europe Van Market Forecast By Country 2019-2029 (US$b, AGR %, CAGR %, Cumulative)
Table 5.8 Europe Van Market by End-User Submarket Forecast 2019-2029 (US$b)
Table 5.9 Europe Van Market by End-User Submarket Forecast 2019-2029 (Units)
Table 5.10 Europe Van Market Drivers & Restraints 2019
Table 5.11 Asia-Pacific Van Market Forecast By Country 2019-2029 (US$b)
Table 5.12 Asia Pacific Van Market by End-User Submarket Forecast 2019-2029 (US$b, Cumulative, Global AGR%)
Table 5.13 Asia Pacific Van Market by End-User Submarket Forecast 2019-2029 (Units)
Table 5.14 Asia-Pacific Van Market Drivers & Restraints 2019
Table 5.15 Latin America, Middle East and Africa Van Market by Country Forecast 2019-2029 (US$b)
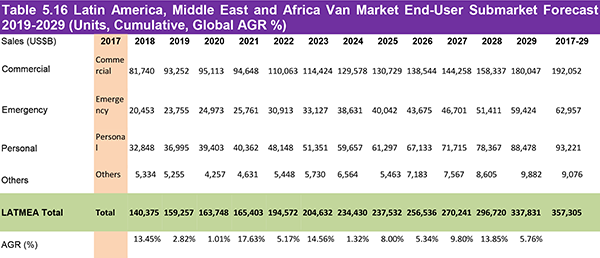
Table 5.16 Latin America, Middle East and Africa Van Market End-User Submarket Forecast 2019-2029 (Units)
Table 5.17 Latin America, Middle East and Africa Van Market by End-User Submarket Forecast 2019-2029 (US$b, Cumulative, Global AGR %)
Table 5.18 Latin America and Middle East and Africa Van Market Drivers & Restraints 2019
Table 6.1 Ford Motor Company 2017 (CEO, Total Company Sales US$m, HQ, Founded, No. of Employees, Website)
Table 6.2 Selected Recent Ford Motor Company Contracts / Projects / New Products/Programmes
Table 6.3 Citroen Profile 2017 (CEO, Total Company Sales US$m, Net Income US$m, , HQ, Founded, No. of Employees, Website)
Table 6.4 Selected Recent Citroen- Groupe PSA Contracts / Projects / New Products/Programmes
Table 6.5 Fiat Automobiles S.p.A 2017 (CEO, Total Company Sales US$m, Net Income US$m, , HQ, Founded, No. of Employees, Website)
Table 6.6 Selected Recent Fiat Automobiles S.p.A Contracts / Projects / New Products/Programmes
Table 6.7 IVECO Profile 2017 (CEO, Total Company Sales US$m, HQ, Founded, Website)
Table 6.8 Selected Recent Fiat IVECO Contracts / Projects / New Products/Programmes
Table 6.9 Daimler AG Profile 2017 (CEO, Total Company Sales US$m, HQ, Founded, No. of Employees, Website)
Table 6.10 Selected Recent Daimler AG Contracts / Projects / New Products/Programmes
Table 6.11 Mitsubishi Motors Profile 2017 (CEO, Total Company Sales US$m, HQ, Founded, No. of Employees, Website)
Table 6.12 Selected Recent Mitsubishi Motor Contracts / Projects / New Products/Programmes
Table 6.13 Rheinmetall AG Profile 2016 (CEO, Total Company Sales US$m HQ, Founded, No. of Employees, Website)
Table 6.14 Selected Recent Fiat Nissan Contracts / Projects / New Products/Programmes
Table 6.15 Peugeot Profile 2017 (CEO, Total Company Sales US$m, Net Income US$m, , HQ, Founded, No. of Employees, Website)
Table 6.16 Selected Recent Peugeot- Groupe PSA Contracts / Projects / New Products/Programmes
Table 6.17 Groupe Renault Company Profile 2017 (CEO, Total Company Sales US$m HQ, Founded, No. of Employees, Website)
Table 6.18 Selected Recent Groupe Renault Contracts / Projects / New Products/Programmes
Table 6.19 Toyota Motor Corporation Profile 2017 (CEO, Total Company Sales US$m HQ, Founded, No. of Employees, Website)
Table 6.20 Selected Recent Toyota Motor Corporation Contracts / Projects / New Products/Programmes
Table 6.21 General Motor Company Profile 2017 (CEO, Total Company Sales US$m HQ, Founded, No. of Employees, Website)
Table 6.22 Selected Recent General Motor Company Contracts / Projects / New Products/Programmes
Table 6.23 Volkswagen of America, Inc. Profile 2017 (CEO, Total Company Sales US$m HQ, Founded, No. of Employees, Website)
Table 6.24 Selected Recent Volkswagen of America, Inc. Contracts / Projects / New Products/Programmes
Table 6.25Safran S.A Profile 2017 (CEO, Total Company Sales US$m HQ, Founded, No. of Employees, Website)
Table 6.26 Selected Recent Tata Group Contracts / Projects / New Products/Programmes
Table 6.27 Mahindra & Mahindra 2016 (CEO, HQ, Founded, No. of Employees, Website)
Table 6.28 Selected Recent Mahindra & Mahindra Contracts / Projects / New Products/Programmes
Table 6.29 Other Van Manufacturers & Brands
List of Figures
Figure 1.1 Example of Van Market by Submarket Forecast 2019-2029 (US$b, AGR %)
Figure 2.1 Global Van Market Product Segmentation Overview
Figure 3.1 Global Van Market Forecast 2019-2029 (US$b)
Figure 4.1 Global Van Market by End-User Submarket AGR Forecast 2019-2029 (AGR %)
Figure 4.2 Global Van Market by End-User Submarket Forecast 2019-2029 (US$b, Global)
Figure 4.3 Global Van Market by End-User Submarket Share Forecast 2019 (% Share)
Figure 4.4 Global Van Market by End-User Submarket Share Forecast 2029 (% Share)
Figure 4.5 Global Commercial Van Submarket Forecast by Regional Market 2019-2029 (US$b)
Figure 4.6 Global Commercial Van Submarket Share by Regional Market Forecast 2019 (% Share)
Figure 4.7 Global Commercial Van Submarket Share by Regional Market Forecast 2024 (% Share)
Figure 4.8 Global Commercial Van Submarket Share by Regional Market Forecast 2029 (% Share)
Figure 4.9 Global Emergency Van Submarket Forecast by Regional Market Forecast 2019-2029 (US$b)
Figure 4.10 Global Emergency Van Submarket Share by Regional Market Forecast 2019 (% Share)
Figure 4.11 Global Emergency Van Submarket Share by Regional Market Forecast 2024 (% Share)
Figure 4.12 Global Emergency Van Submarket Share by Regional Market Forecast 2029 (% Share)
Figure 4.13 Global Personal Van Submarket Forecast by Regional Market 2019-2029 (US$b)
Figure 4.14 Global Personal Van Submarket Share by Regional Market Forecast 2019 (% Share)
Figure 4.15 Global Personal Van Submarket Share by Regional Market Forecast 2024 (% Share)
Figure 4.16 Global Personal Van Submarket Share by Regional Market Forecast 2029 (% Share)
Figure 4.17 Global Others Van Submarket Share by Regional Market Forecast 2019 (% Share)
Figure 4.18 Global Others Van Submarket Share by Regional Market Forecast 2024 (% Share)
Figure 4.19 Global Others Van Submarket Share by Regional Market Forecast 2029 (% Share)
Figure 6.1 Ford Motor Company Primary Market Competitors 2018
Figure 6.2 Groupe PSA Primary Market Competitors 2018
Figure 6.3. Fiat Automobiles Primary Market Competitors 2018
Figure 6.4I VECO Primary Market Competitors 2018
Figure 6.5 Daimler AG Primary Market Competitors 2018
Figure 6.6 Mitsubishi Motor Primary Market Competitors 2018
Figure 6.7 Nissan Primary Market Competitors 2018
Figure 6.8 Groupe PSA Primary Market Competitors 2018
Figure 6.9 Groupe Renault Primary Market Competitors 2018
Figure 6.10 Toyota Motor Corporation Primary Market Competitors 2018
Figure 6.11 Safran S.A Primary Market Competitors 2018
Figure 6.12 Volkswagen of America, Inc. Primary Market Competitors 2018
Figure 6.13 Tata Group Primary Market Competitors 2018
Figure 6.14 Mahinda & Mahindra Primary Market Competitors 2016
Adrian Steel
BMC Commercial Vehicles
BMW
Buick
BYD
Chery
Chevrolet
Chrysler
Citroën
Citroen-Groupe PSA
CNH Industrial Group
Dacia
Daihatsu
Daimler AG
Dodge
FCA Ram
Fiat Automobiles S.p.A
Fiat Chrysler Automobiles N.V(FCA)
Ford Motor Company
FSC
GAZ
Glas
GM
GM Korea
GMC
Groupe PSA
HAITEC
Hermes
Hertz
Himachal Road Transport Corporation (HRTC)
Holden
Honda
Hyundai
Isuzu
IVECO
IVECO New Zealand
Jaguar Land Rover (JLR)
Jeep
Kia
LeasePlan
Luxgen
Mahindra & Mahindra Ltd (M&M Ltd)
Mahindra (China) Tractor Co. Ltd.
Mahindra Europe S.r.l
Mahindra Group
Mahindra South Africa
Mahindra USA Inc.
Maruti Suzuki
Mazda Motor Corporation
Mercedes-Benz
Mercedes-Benz Vans
Mercedes-Benz/Freightliner
Mitsubishi Motors
Mitsubishi Motors Australia Ltd,
Morgan Olson
Navistar, Inc.
Nissan Motor Co., Ltd.
Opel/Vauxhall
Proton
Pyonghwa Motors
Renault-Nissan-Mitsubishi Alliance
SAIC-GM-Wuling
SEAT
Shanghai GM
SsangYong Motor Company
Star Trucks International
Subaru
Suzuki Motor Corporation
Tata Chemicals
Tata Communications
Tata Consultancy Services
Tata Global Beverages
Tata Group
Tata Motors
Tata Power
Tata Steel
Tata Teleservices
Textron Inc
The Indian Hotels Company Limited
Titan
Toyota Coaster
Toyota Motor Corporation
Vauxhall
Volkswagen Group
Volkswagen Commercial Vehicles
Volkswagen of America, Inc
Waymo
Wuling Motors
Yulon Motor
Organisations mentioned
ACEA
National Truck Equipment Association (NTEA)
Society of Motor Manufacturers and Traders (SMMT)

