Industries > Energy > Combined Heat & Power (CHP) Installation Market Forecast 2019-2029
Combined Heat & Power (CHP) Installation Market Forecast 2019-2029
Forecasts by Submarkets with Capacity (GW) and Revenue ($bn); Prime Mover (Steam Turbine, Combined Cycle, Reciprocating Engine, Others), by Fuel Type (Biomass, Coal, Natural Gas, Others) With Analysis of Leading Countries and Companies Operating Within the Sector
• Do you need definitive Combined Heat and Power Installation market data?
• Succinct Combined Heat and Power Installation market analysis?
• Technological insight?
• Clear competitor analysis?
• Actionable business recommendations?
Read on to discover how this definitive report can transform your own research and save you time.
The Global Energy transition has led Visiongain to publish this timely report. The $800 million combined heat and power installation sector is expected to flourish in the next few years because of the increasing desirability of low carbon and efficient energy systems around the world due to increasing government policies demanding that countries meet their climate change objectives driving growth to new heights. If you want to be part of this growing industry, then read on to discover how you can maximise your investment potential.
Report highlights
• 209 quantitative tables, charts, and graphs
• Market Share and Operations Analysis of key players in Combined Heat and Power Installation
• 2G Energy International
• Wartsila
• General Electric
• Generac
• Capstone Turbine
• Siemens AG
• Cummins Inc
• Tecogen Inc
• Global Combined Heat and Power Installation market outlook and analysis from 2019-2029
• One expert interview with a key industry expert
• Siemens AG
• Combined Heat and Power Prime Mover forecasts and analysis from 2019-2029
• Global Steam Turbine Forecast 2019-2029
• Global Combined Cycle Forecast 2019-2029
• Gas Turbine Forecast 2019-2029
• Reciprocating Engine Forecast 2019-2029
• Others Forecast 2019-2029
• Combined Heat and Power Fuel Type forecasts and analysis 2019-2029
• Global Coal Forecast 2019-2029
• Natural Gas Forecast 2019-2029
• Biomass Forecast 2019-2029
• Others Forecast 2019-2029
• Key questions answered
• What does the future hold for the combined heat and power installation industry?
• Where should you target your business strategy?
• Which applications should you focus upon?
• Which disruptive technologies should you invest in?
• Which companies should you form strategic alliances with?
• Which company is likely to success and why?
• What business models should you adopt?
• What industry trends should you be aware of?
• Target audience
• Leading combined Heat and Power systems companies
• Leading fuel suppliers
• Electricity grid specialists
• Transmission & Distribution (T&D) suppliers
• Smart grid hardware and software vendors
• Utility companies
• Electronics companies
• Renewables specialists
• Battery suppliers
• Energy storage developers
• Suppliers
• Contractors
• Technologists
• R&D staff
• Consultants
• Analysts
• CEO’s
• CIO’s
• COO’s
• Business development managers
• Investors
• Governments
• Agencies
• Industry organisations
• Banks
Visiongain is a trading partner with the US Federal Government
CCR Ref number: KD4R6
1.1 Combined Heat & Power (CHP) Installation Market Overview
1.2 Market Structure Overview and Market Definition
1.3 Why You Should Read This Report
1.4 How This Report Delivers
1.5 Key Questions Answered by This Analytical Report Include:
1.6 Who is This Report For?
1.7 Methodology
1.7.1 Primary Research
1.7.2 Secondary Research
1.7.3 Market Evaluation & Forecasting Methodology
1.8 Frequently Asked Questions (FAQ)
1.9 Associated Visiongain Reports
1.10 About Visiongain
2. Introduction to The Combined Heat & Power (CHP) Installation Market
2.1 Global Combined Heat & Power (CHP) Installation Market Structure
2.2 Market Definition
2.3 Combined Heat & Power (CHP) Installation-Value Chain Analysis
2.4 Combined Heat & Power (CHP) Installation-Pricing Analysis
3. Global Overview of Combined Heat & Power (CHP) Installation Market
3.1 Regional Overview of Combined Heat & Power (CHP) Installation Market 2019-2029
3.2 Global Combined Heat & Power (CHP) Installation Market Drivers and Restraints
3.3 CHP Investment Cost Analysis
3.4 CHP Production Cost Analysis
3.5 CHP Production Cost Analysis – Contract Manufacturing
3.6 Global CHP Installation Market, Drivers & Restraints
4.Global Combined Heat & Power (CHP) Installation Submarkets Forecast 2019-2029
4.1 Global Combined Heat & Power (CHP) Installation Submarkets Forecast, by Fuel 2019-2029
4.1.1 Global Combined Heat & Power (CHP) Installation Market, by Coal Forecasts 2019-2029
4.1.2 Global Combined Heat & Power (CHP) Installation Market, by Natural Gas Forecasts 2019-2029
4.1.3 Global Combined Heat & Power (CHP) Installation Market, by Biomass Forecasts 2019-2029
4.1.4 Global Combined Heat & Power (CHP) Installation Market, by Others Forecasts 2019-2029
4.2 Global Combined Heat & Power (CHP) Installation Submarkets Forecast, by Prime Mover 2019-2029
4.2.1 Global Combined Heat & Power (CHP) Installation Market, by Steam Turbine Forecasts 2019-2029
4.2.2 Global Combined Heat & Power (CHP) Installation Market, by Combined Cycle Forecasts 2019-2029
4.2.3 Global Combined Heat & Power (CHP) Installation Market, by Gas Turbine Forecasts 2019-2029
4.2.4 Global Combined Heat & Power (CHP) Installation Market, by Reciprocating Engine Forecasts 2019-2029
4.2.5 Global Combined Heat & Power (CHP) Installation Market, by Others Forecasts 2019-2029
5. Leading Nations in Combined Heat & Power (CHP) Installation Market 2019-2029
5.1 U.S. Combined Heat & Power (CHP) Installation Market Forecast 2019-2029
5.1.1 U.S. Combined Heat & Power (CHP) Installation Submarket Forecast 2019-2029
5.1.1.1 U.S. Combined Heat & Power (CHP) Installation Market Forecast by Fuel 2019-2029
5.1.1.2 U.S. Combined Heat & Power (CHP) Installation Market Forecast by Prime Mover 2019-2029
5.2 Canada Combined Heat & Power (CHP) Installation Market Forecast 2019-2029
5.2.1 Canada Combined Heat & Power (CHP) Installation Submarket Forecast 2019-2029
5.2.1.1 Canada Combined Heat & Power (CHP) Installation Market Forecast by Fuel 2019-2029
5.2.1.2 Canada Combined Heat & Power (CHP) Installation Market Forecast by Prime Mover 2019-2029
5.3 China Combined Heat & Power (CHP) Installation Market Forecast 2019-2029
5.3.1 China Combined Heat & Power (CHP) Installation Submarket Forecast 2019-2029
5.3.1.1 China Combined Heat & Power (CHP) Installation Market Forecast by Fuel 2019-2029
5.3.1.2 China Combined Heat & Power (CHP) Installation Market Forecast by Prime Mover 2019-2029
5.4 India Combined Heat & Power (CHP) Installation Market Forecast 2019-2029
5.4.1 India Combined Heat & Power (CHP) Installation Submarket Forecast 2019-2029
5.4.1.1 India Combined Heat & Power (CHP) Installation Market Forecast by Fuel 2019-2029
5.4.1.2 India Combined Heat & Power (CHP) Installation Market Forecast by Prime Mover 2019-2029
5.5 Rest of Asia Pacific Combined Heat & Power (CHP) Installation Market Forecast 2019-2029
5.5.1 Rest of Asia Pacific Combined Heat & Power (CHP) Installation Submarket Forecast 2019-2029
5.5.1.1 Rest of Asia Pacific Combined Heat & Power (CHP) Installation Market Forecast by Fuel 2019-2029
5.5.1.2 Rest of Asia Pacific Combined Heat & Power (CHP) Installation Market Forecast by Prime Mover 2019-2029
5.6 Germany Combined Heat & Power (CHP) Installation Market Forecast 2019-2029
5.6.1 Germany Combined Heat & Power (CHP) Installation Submarket Forecast 2019-2029
5.6.1.1 Germany Combined Heat & Power (CHP) Installation Market Forecast by Fuel 2019-2029
5.6.1.2 Germany Combined Heat & Power (CHP) Installation Market Forecast by Prime Mover 2019-2029
5.7 Russia Combined Heat & Power (CHP) Installation Market Forecast 2019-2029
5.7.1 Russia Combined Heat & Power (CHP) Installation Submarket Forecast 2019-2029
5.7.1.1 Russia Combined Heat & Power (CHP) Installation Market Forecast by Fuel 2019-2029
5.7.1.2 Russia Combined Heat & Power (CHP) Installation Market Forecast by Prime Mover 2019-2029
5.8 Rest of Europe Combined Heat & Power (CHP) Installation Market Forecast 2019-2029
5.8.1 Rest of Europe Combined Heat & Power (CHP) Installation Submarket Forecast 2019-2029
5.8.1.1 Rest of Europe Combined Heat & Power (CHP) Installation Market Forecast by Fuel 2019-2029
5.8.1.2 Rest of Europe Combined Heat & Power (CHP) Installation Market Forecast by Prime Mover 2019-2029
5.9 Rest of the World Combined Heat & Power (CHP) Installation Market Forecast 2019-2029
5.9.1 Rest of the World Combined Heat & Power (CHP) Installation Submarket Forecast 2019-2029
5.9.1.1 Rest of the World Combined Heat & Power (CHP) Installation Market Forecast by Fuel 2019-2029
5.9.1.2 Rest of the World Combined Heat & Power (CHP) Installation Market Forecast by Prime Mover 2019-2029
6. PEST Analysis of the Combined Heat & Power (CHP) Installation Market
7. Expert Opinion
7.1 Primary Correspondents
7.1.1 Global CHP Installation Outlook
7.1.2 Driver & Restraints
7.1.3 Dominant Region/Country in the CHP Installation Market
7.1.4 Overall Growth Rate, Globally
8. Leading Companies in CHP Installation Market
8.1 Global CHP Installation Market, Company Analysis
8.2 General Electric
8.2.1 Business Overview
8.2.2 Recent Developments
8.2.3 Business Strategy
8.2.4 Marketing Channel
8.3 Siemens AG
8.3.1 Business Overview
8.3.2 Recent Developments
8.3.3 Business Strategy
8.3.4 Marketing Channel
8.4 Capstone Turbine Corporation
8.4.1 Business Overview
8.4.2 Recent Developments
8.4.3 Business Strategy
8.4.4 Marketing Channel
8.5 2G Energy Inc.
8.5.1 Business Overview
8.5.2 Recent Developments
8.5.3 Business Strategy
8.5.4 Marketing Channel
8.6 Wartsila
8.6.1 Company Analysis
8.6.2 Recent Developments
8.6.3 Marketing Channel
8.7 Generac Holdings Inc.
8.7.1 Business Overview
8.7.2 Recent Developments
8.7.3 Business Strategy
8.7.4 Marketing Channel
8.8 Cummins Inc.
8.8.1 Business Overview
8.8.2 Recent Developments
8.8.3 Business Strategy
8.8.4 Marketing Channel
8.9 Tecogen, Inc.
8.9.1 Business Overview
8.9.2 Recent Developments
8.9.3 Business Strategy
8.9.4 Marketing Channel
9. Conclusion & Recommendations
9.1 Recommendations
10. Glossary
Associated Visiongain Reports
Visiongain Report Sales Order Form
Appendix A
About Visiongain
Appendix B
Visiongain report evaluation form
List of Tables
Table 3.1 Global Combined Heat & Power (CHP) Installation Market Forecast 2019-2029 (Capacity (GW), Revenue ($ bn), AGR %, CAGR %, Cumulative)
Table 3.2 Global Combined Heat & Power (CHP) Installation Market Regional Forecast by Capacity 2019-2029(GW, AGR %, CAGR %, Cumulative)
Table 3.3 Global Combined Heat & Power (CHP) Installation Market Regional Forecast by Spending 2019-2029 ($mn, AGR %, CAGR %, Cumulative)
Table 3.4 Global Combined Heat & Power (CHP) Installation Market Regional Forecast by Capacity 2019-2029(GW, AGR %, CAGR %, Cumulative)
Table 3.5 Global Combined Heat & Power (CHP) Installation Market Drivers and Restraints
Table 3.6 Global Combined Heat & Power (CHP) Installation Market, List of Key Manufacturers/Suppliers
Table 3.7 Capital Investment Cost, CHP Power Plant (200 kW-5000 kW)
Table 3.8 Own Manufacturing Total Electricity Generation Cost, CHP Power Plant (200 kW-5000 kW)
Table 3.9 Contract Manufacturing Total Electricity Generation Cost, CHP Power Plant (200 kW-5000 kW)
Table 3.10 Global Combined Heat & Power (CHP) Installation Market, Drivers and Restraints
Table 4.1 Global Combined Heat & Power (CHP) Installation Market, by Fuel Type Forecast 2019-2029 ($bn, AGR %, Cumulative)
Table 4.2 Global Combined Heat & Power (CHP) Installation Market, by Coal Forecast 2019-2029 (GW, $ bn, AGR %, CAGR %, Cumulative)
Table 4.3 Global Combined Heat & Power (CHP) Installation Market, by Natural Gas Forecast 2019-2029 (GW, $ bn, AGR %, CAGR %, Cumulative)
Table 4.4 Global Combined Heat & Power (CHP) Installation Market, by Biomass Forecast 2019-2029 (GW, $ bn, AGR %, CAGR %, Cumulative)
Table 4.5 Global Combined Heat & Power (CHP) Installation Market, by Others Forecast 2019-2029 (GW, $ bn, AGR %, CAGR %, Cumulative)
Table 4.6 Global Combined Heat & Power (CHP) Installation Market, by Fuel Drivers and Restraints
Table 4.7 Global Combined Heat & Power (CHP) Installation Market, by Prime Mover Type Forecast 2019-2029 ($bn, AGR %, Cumulative)
Table 4.8 Global Combined Heat & Power (CHP) Installation Market, by Steam Turbine Forecast 2019-2029 (GW, $ bn, AGR %, CAGR %, Cumulative)
Table 4.9 Global Combined Heat & Power (CHP) Installation Market, by Combined Cycle Forecast 2019-2029 (GW, $ bn, AGR %, CAGR %, Cumulative)
Table 4.10 Global Combined Heat & Power (CHP) Installation Market, by Gas Turbine Forecast 2019-2029 (GW, $ bn, AGR %, CAGR %, Cumulative)
Table 4.11 Global Combined Heat & Power (CHP) Installation Market, by Reciprocating Engine Forecast 2019-2029 (GW, $ bn, AGR %, CAGR %, Cumulative)
Table 4.12 Global Combined Heat & Power (CHP) Installation Market, by Reciprocating Engine Forecast 2019-2029 (GW, $ bn, AGR %, CAGR %, Cumulative)
Table 4.13 Global Combined Heat & Power (CHP) Installation Market, by Prime Mover Drivers and Restraints
Table 5.1 Global Combined Heat & Power (CHP) Installation Market by Country Forecast 2019-2029 (Capacity (GW), AGR %, Cumulative)
Table 5.2 Global Combined Heat & Power (CHP) Installation Market by Country Forecast 2019-2029 ($ bn, AGR %, Cumulative)
Table 5.3 U.S. Combined Heat & Power (CHP) Installation Market, by Seamless Forecast 2019-2029 (GW, $ bn, AGR %, CAGR %, Cumulative)
Table 5.4 U.S. Combined Heat & Power (CHP) Installation Market, by Fuel Type Forecast 2019-2029 (Capacity (GW), $bn, AGR %, Cumulative)
Table 5.5 U.S. Combined Heat & Power (CHP) Installation Market, by Prime Mover Type Forecast 2019-2029 (Capacity (GW), $bn, AGR %, Cumulative)
Table 5.6 List of U.S. CHP Installed Base, 2014-2017 (City, Facility Name, Application, Op Year, Capacity (kW), Prime Mover)
Table 5.7 Canada Combined Heat & Power (CHP) Installation Market Forecast 2018-2029 (GW, $ bn, AGR %, CAGR %, Cumulative)
Table 5.8 Canada Combined Heat & Power (CHP) Installation Market, by Fuel Type Forecast 2019-2029 (Capacity (GW), $bn, AGR %, Cumulative)
Table 5.9 Canada Combined Heat & Power (CHP) Installation Market, by Prime Mover Type Forecast 2019-2029 ($bn, AGR %, Cumulative)
Table 5.10 China Combined Heat & Power (CHP) Installation Market Forecast 2019-2029 (GW, $ bn, AGR %, CAGR %, Cumulative)
Table 5.11 China Combined Heat & Power (CHP) Installation Market, by Fuel Type Forecast 2019-2029 (Capacity (GW), $bn, AGR %, Cumulative)
Table 5.12 China Combined Heat & Power (CHP) Installation Market, by Prime Mover Type Forecast 2019-2029 ($bn, AGR %, Cumulative)
Table 5.13 India Combined Heat & Power (CHP) Installation Market Forecast 2019-2029 (GW, $ bn, AGR %, CAGR %, Cumulative)
Table 5.14 India Combined Heat & Power (CHP) Installation Market, by Fuel Type Forecast 2019-2029 (Capacity (GW), $bn, AGR %, Cumulative)
Table 5.15 India Combined Heat & Power (CHP) Installation Market, by Prime Mover Type Forecast 2019-2029 (Capacity (GW), $bn, AGR %, Cumulative)
Table 5.16 Rest of Asia Pacific Combined Heat & Power (CHP) Installation Market Forecast 2018-2029 (GW, $ bn, AGR %, CAGR %, Cumulative)
Table 5.17 Rest of Asia Pacific Combined Heat & Power (CHP) Installation Market, by Fuel Type Forecast 2019-2029 (Capacity (GW), $bn, AGR %, Cumulative)
Table 5.18 Rest of Asia Pacific Combined Heat & Power (CHP) Installation Market, by Prime Mover Type Forecast 2019-2029 (Capacity (GW), $bn, AGR %, Cumulative)
Table 5.19 Germany Combined Heat & Power (CHP) Installation Market Forecast 2019-2029 (GW, $ bn, AGR %, CAGR %, Cumulative)
Table 5.20 Germany Combined Heat & Power (CHP) Installation Market, by Fuel Type Forecast 2019-2029 (Capacity (GW), $bn, AGR %, Cumulative)
Table 5.21 Germany Combined Heat & Power (CHP) Installation Market, by Prime Mover Type Forecast 2019-2029 (Capacity (GW), $bn, AGR %, Cumulative)
Table 5.22 Russia Combined Heat & Power (CHP) Installation Market Forecast 2019-2029 (GW, $ bn, AGR %, CAGR %, Cumulative)
Table 5.23 Russia Combined Heat & Power (CHP) Installation Market, by Fuel Type Forecast 2019-2029 (Capacity (GW), $bn, AGR %, Cumulative)
Table 5.24 Russia Combined Heat & Power (CHP) Installation Market, by Prime Mover Type Forecast 2019-2029 (Capacity (GW), $bn, AGR %, Cumulative)
Table 5.25 Rest of Europe Combined Heat & Power (CHP) Installation Market Forecast 2019-2029 (GW, $ bn, AGR %, CAGR %, Cumulative)
Table 5.26 Rest of Europe Combined Heat & Power (CHP) Installation Market, by Fuel Type Forecast 2019-2029 (Capacity (GW), $bn, AGR %, Cumulative)
Table 5.27 Rest of Europe Combined Heat & Power (CHP) Installation Market, by Prime Mover Type Forecast 2019-2029 (Capacity (GW), $bn, AGR %, Cumulative)
Table 5.28 Rest of the World Combined Heat & Power (CHP) Installation Market Forecast 2019-2029 (GW, $ bn, AGR %, CAGR %, Cumulative)
Table 5.29 Rest of the World Combined Heat & Power (CHP) Installation Market, by Fuel Type Forecast 2019-2029 (Capacity (GW), $bn, AGR %, Cumulative)
Table 5.30 Rest of the World Combined Heat & Power (CHP) Installation Market, by Prime Mover Type Forecast 2019-2029 (Capacity (GW), $bn, AGR %, Cumulative)
Table 6.1 PEST Analysis, Combined Heat & Power (CHP) Installation Market
Table 8.1 General Electric Profile 2017 (Market Entry, Public/Private, Headquarter, Total Company Revenue $bn, Change in Revenue (%), Geography, Key Market, Listed on, Products/Services, No. of Employees)
Table 8.2 General Electric Total Company Revenue 2013-2017 ($bn, AGR %)
Table 8.3 Siemens AG Profile 2017 (Market Entry, Public/Private, Headquarter, Total Company Revenue $bn, Change in Revenue, Geography, Key Market, Listed on, Products/Services, No. of Employees)
Table 8.4 Siemens AG, Total Company Revenue 2013-2017 ($bn, AGR %)
Table 8.5 Capstone Turbine Corporation Profile 2017 (Market Entry, Public/Private, Headquarter, Total Company Revenue $mn, Change in Revenue (%), Geography, Key Markets, Listed on, Products/Services, No. of Employees)
Table 8.6 Capstone Turbine Corporation, Total Company Revenue 2013-2017 ($mn, AGR %)
Table 8.7 Capstone Turbine Corporation, List of Distributors (North America and Europe)
Table 8.8 Capstone Turbine Corporation, List of Distributors (Asia)
Table 8.9 Capstone Turbine Corporation, List of Distributors (Russia/CIS)
Table 8.10 Capstone Turbine Corporation, List of Distributors (Latin America)
Table 8.11 Capstone Turbine Corporation, List of Distributors (Africa)
Table 8.12 Capstone Turbine Corporation, List of Distributors (Middle East)
Table 8.13 2G Energy Inc. Profile 2017 (Market Entry, Public/Private, Headquarter, Total Company Revenue $mn, Change in Revenue (%), Geography, Key Market, Products/Services, No. of Employees)
Table 8.14 2G Energy Inc., Total Company Operating Revenue 2013-2017 ($mn, AGR %)
Table 8.15 2G Energy Inc. List of Distributors
Table 8.16 Wartsila Profile 2017 (Market Entry, Public/Private, Headquarter, Total Company Revenue US$mn, Change in Revenue, Geography, Key Market, Listed on, Products/Services, No. of Employees)
Table 8.17 Wartsila Total Company Revenue 2013-2017 ($bn, AGR %)
Table 8.18 Generac Holdings Inc. Profile 2017 (Market Entry, Public/Private, Headquarter, Total Company Revenue $bn, Change in Revenue (%), Geography, Key Market, Listed on, Products/Services, No. of Employees)
Table 8.19 Generac Holdings Inc. Total Company Revenue 2014-2017 ($bn, AGR %)
Table 8.20 Cummins Inc. Profile 2017 (Market Entry, Public/Private, Headquarter, Total Company Revenue $bn, Change in Revenue, Geography, Key Market, Listed on, Products/Services, No. of Employees)
Table 8.21 Cummins Inc. Total Company Revenue 2014-2017 ($bn, AGR %)
Table 8.22 Tecogen, Inc. Profile 2017 (Market Entry, Public/Private, Headquarter, Total Company Revenue $bn, Change in Revenue (%), Geography, Key Market, Products/Services, No. of Employees)
Table 8.23 Tecogen, Inc. Total Company Revenue 2014-2017 ($mn, AGR %)
List of Figures
Figure 2.1 Global Combined Heat & Power (CHP) Installation Market Segmentation Overview
Figure 2.2 Combined Heat & Power (CHP) Installation-Value Chain Analysis
Figure 3.1 Global Combined Heat & Power (CHP) Installation Market Forecast 2019-2029 (GW, AGR%)
Figure 3.2 Global Combined Heat & Power (CHP) Installation Market Forecast 2019-2029 ($ bn, AGR %)
Figure 3.3 Global Combined Heat & Power (CHP) Installation, by Application Submarket Forecast 2019-2029 (GW)
Figure 3.4 Regional Combined Heat & Power (CHP) Installation Market Forecast 2019-2029 ($bn)
Figure 3.5 Global Combined Heat & Power (CHP) Installation Market by Regional % Share Forecast 2019, 2024, 2029 (Revenue)
Figure 3.6 Global Combined Heat & Power (CHP) Installation Forecast 2019-2029, by Region (AGR %)-Revenue
Figure 4.1 Global Combined Heat & Power (CHP) Installation, by Fuel Submarket Forecast 2019-2029 (GW)
Figure 4.2 Global Combined Heat & Power (CHP) Installation, by Fuel Submarket Forecast 2019-2029 ($bn)
Figure 4.3 Global Combined Heat & Power (CHP) Installation Market by Fuel (Revenue) Share Forecast 2019, 2024, 2029 (% Share)
Figure 4.4 Global Combined Heat & Power (CHP) Installation Market, By Coal Forecast 2019-2029 (GW, AGR%)
Figure 4.5 Global Combined Heat & Power (CHP) Installation Market, by Coal Forecast 2019-2029 ($ bn, AGR %)
Figure 4.6 Combined Heat & Power (CHP) Installation Market, By Natural Gas Forecast 2019-2029 (GW, AGR%)
Figure 4.7 Combined Heat & Power (CHP) Installation Market, By Natural Gas Forecast 2019-2029 ($ bn, AGR%)
Figure 4.8 Combined Heat & Power (CHP) Installation Market, By Biomass Forecast 2019-2029 (GW, AGR%)
Figure 4.9 Combined Heat & Power (CHP) Installation Market, By Biomass Forecast 2019-2029 ($ bn, AGR%)
Figure 4.10 Combined Heat & Power (CHP) Installation Market, By Others Forecast 2019-2029 (GW, AGR%)
Figure 4.11 Combined Heat & Power (CHP) Installation Market, By Others Forecast 2019-2029 ($ bn, AGR%)
Figure 4.12 Global Combined Heat & Power (CHP) Installation Market, Comparison Matrix, by Solution Type VS Region (Comparison Matric)
Figure 4.13 Global Combined Heat & Power (CHP) Installation, by Prime Mover Submarket Forecast 2019-2029 (GW)
Figure 4.14 Global Combined Heat & Power (CHP) Installation, by Prime Mover Submarket Forecast 2019-2029 ($bn)
Figure 4.15 Global Combined Heat & Power (CHP) Installation Market by Prime Mover (Revenue) Share Forecast 2019, 2024, 2029 (% Share)
Figure 4.16 Global Combined Heat & Power (CHP) Installation Market, By Steam Turbine Forecast 2019-2029 (GW, AGR%)
Figure 4.17 Global Combined Heat & Power (CHP) Installation Market, by Steam Turbine Forecast 2019-2029 ($ bn, AGR %)
Figure 4.18 Combined Heat & Power (CHP) Installation Market, By Combined Cycle Forecast 2019-2029 (GW, AGR%)
Figure 4.19 Combined Heat & Power (CHP) Installation Market, By Combined Cycle Forecast 2019-2029 ($ bn, AGR%)
Figure 4.20 Combined Heat & Power (CHP) Installation Market, By Gas Turbine Forecast 2019-2029 (GW, AGR%)
Figure 4.21 Combined Heat & Power (CHP) Installation Market, By Gas Turbine Forecast 2019-2029 ($ bn, AGR%)
Figure 4.22 Combined Heat & Power (CHP) Installation Market, By Reciprocating Engine Forecast 2019-2029 (GW, AGR%)
Figure 4.23 Combined Heat & Power (CHP) Installation Market, By Reciprocating Engine Forecast 2019-2029 ($ bn, AGR%)
Figure 4.24 Combined Heat & Power (CHP) Installation Market, By Others Forecast 2019-2029 (GW, AGR%)
Figure 4.25 Combined Heat & Power (CHP) Installation Market, By Others Forecast 2019-2029 ($ bn, AGR%)
Figure 4.26 Global Combined Heat & Power (CHP) Installation Market, Comparison Matrix, by Solution Type VS Region (Comparison Matric)
Figure 5.1 Global Combined Heat & Power (CHP) Installation Market Forecast by Leading Nations, Capacity (GW) 2019-2029
Figure 5.2 Global Combined Heat & Power (CHP) Installation Market Forecast by Top 3 Nations, by Installed Capacity (GW) 2018
Figure 5.3 Global Combined Heat & Power (CHP) Installation Market Forecast by Leading Nations ($ bn) 2019-2029
Figure 5.4 Leading Country/Regional Combined Heat & Power (CHP) Installation Market Share Forecast 2019 (% Share)
Figure 5.5 Leading Country/Regional Combined Heat & Power (CHP) Installation Market Share Forecast 2024 (% Share)
Figure 5.6 Leading Country/Regional Combined Heat & Power (CHP) Installation Market Share Forecast 2029 (% Share)
Figure 5.7 U.S. Combined Heat & Power (CHP) Installation Market Forecast 2019-2029 (GW & $ bn)
Figure 5.8 U.S. Combined Heat & Power (CHP) Installation Market Share Forecast 2019, 2024, 2029 (% Share)
Figure 5.9 U.S. Combined Heat & Power (CHP) Installation, by Fuel Submarket Forecast 2019-2029 (GW)
Figure 5.10 U.S. Combined Heat & Power (CHP) Installation Market Forecast 2019-2029, by Fuel ($bn, AGR%)
Figure 5.11 U.S. Combined Heat & Power (CHP) Installation, by Prime Mover Submarket Forecast 2019-2029 (GW)
Figure 5.12 U.S. Combined Heat & Power (CHP) Installation Market Forecast 2019-2029, by Prime Mover ($bn, AGR%)
Figure 5.13 U.S. CHP Installation Market, Price Comparison ($/KW), by Turbine Type/Prime Mover 2018
Figure 5.14 U.S. Overall CHP Installed Base (Cumulative), Total Units and Capacity (GW) 2018
Figure 5.15 U.S. CHP Installed Base (200kW-5,000 kW), Total Units and Capacity (GW), 2016
Figure 5.16 U.S. CHP Installed Base (200kW-5,000 kW), Total Sites (Units) and Capacity (GW) Installed, by Fuel Type, 2016
Figure 5.17 U.S. CHP Installed Base (200kW-5,000 kW), Total Sites (Units) and Capacity (GW) Installed, by Turbine/Prime Mover, 2016
Figure 5.18 U.S. CHP Installed Base (200kW-5,000 kW), CHP Unit Sales, by Key Players, 2017
Figure 5.19 U.S. CHP Installed Base, New VS Replacement, % Share, 2016
Figure 5.20 Canada Combined Heat & Power (CHP) Installation Market Forecast 2019-2029 (GW & $ bn)
Figure 5.21 Canada Combined Heat & Power (CHP) Installation Market Share Forecast 2019, 2024, 2029 (% Share)
Figure 5.22 Canada Combined Heat & Power (CHP) Installation, by Fuel Submarket Forecast 2019-2029 (GW)
Figure 5.23 Canada Combined Heat & Power (CHP) Installation Market Forecast 2019-2029, by Fuel($bn, AGR%)
Figure 5.24 Canada Combined Heat & Power (CHP) Installation, by Prime Mover Submarket Forecast 2019-2029 (GW)
Figure 5.25 Canada Combined Heat & Power (CHP) Installation Market Forecast 2019-2029, by Prime Mover ($bn, AGR%)
Figure 5.26 China Combined Heat & Power (CHP) Installation Market Forecast 2019-2029 (GW & $ bn)
Figure 5.27 China Combined Heat & Power (CHP) Installation Market Share Forecast 2019, 2024, 2029 (% Share)
Figure 5.28 China Combined Heat & Power (CHP) Installation, by Fuel Submarket Forecast 2019-2029 (GW)
Figure 5.29 China Combined Heat & Power (CHP) Installation Market Forecast 2019-2029, by Fuel ($bn, AGR%)
Figure 5.30 China Combined Heat & Power (CHP) Installation, by Prime Mover Submarket Forecast 2019-2029 (GW)
Figure 5.31 China Combined Heat & Power (CHP) Installation Market Forecast 2019-2029, by Prime Mover ($bn, AGR%)
Figure 5.32 India Combined Heat & Power (CHP) Installation Market Forecast 2019-2029 (GW & $ bn)
Figure 5.33 India Combined Heat & Power (CHP) Installation Market Share Forecast 2019, 2024, 2029 (% Share)
Figure 5.34 India Combined Heat & Power (CHP) Installation, by Fuel Submarket Forecast 2019-2029 (GW)
Figure 5.35 India Combined Heat & Power (CHP) Installation Market Forecast 2019-2029, by Fuel ($bn, AGR%)
Figure 5.36 India Combined Heat & Power (CHP) Installation, by Prime Mover Submarket Forecast 2019-2029 (GW)
Figure 5.37 India Combined Heat & Power (CHP) Installation Market Forecast 2019-2029, by Prime Mover ($bn, AGR%)
Figure 5.38 Rest of Asia Pacific Combined Heat & Power (CHP) Installation Market Forecast 2019-2029 (GW & $ bn)
Figure 5.39 Rest of Asia Pacific Combined Heat & Power (CHP) Installation Market Share Forecast 2019, 2024, 2029 (% Share)
Figure 5.40 Rest of Asia Pacific Combined Heat & Power (CHP) Installation, by Fuel Submarket Forecast 2019-2029 (GW)
Figure 5.41 Rest of Asia Pacific Combined Heat & Power (CHP) Installation Market Forecast 2019-2029, by Fuel ($bn, AGR%)
Figure 5.42 Rest of Asia Pacific Combined Heat & Power (CHP) Installation, by Prime Mover Submarket Forecast 2019-2029 (GW)
Figure 5.43 Rest of Asia Pacific Combined Heat & Power (CHP) Installation Market Forecast 2019-2029, by Prime Mover ($bn, AGR%)
Figure 5.44 Germany Combined Heat & Power (CHP) Installation Market Forecast 2019-2029 (GW & $ bn)
Figure 5.45 Germany Combined Heat & Power (CHP) Installation Market Share Forecast 2019, 2024, 2029 (% Share)
Figure 5.46 Germany Combined Heat & Power (CHP) Installation, by Fuel Submarket Forecast 2019-2029 (GW)
Figure 5.47 Germany Combined Heat & Power (CHP) Installation Market Forecast 2019-2029, by Fuel ($bn, AGR%)
Figure 5.48 Germany Combined Heat & Power (CHP) Installation, by Prime Mover Submarket Forecast 2019-2029 (GW)
Figure 5.49 Germany Combined Heat & Power (CHP) Installation Market Forecast 2019-2029, by Prime Mover ($bn, AGR%)
Figure 5.50 Russia Combined Heat & Power (CHP) Installation Market Forecast 2019-2029 (GW & $ bn)
Figure 5.51 Russia Combined Heat & Power (CHP) Installation Market Share Forecast 2019, 2024, 2029 (% Share)
Figure 5.52 Russia Combined Heat & Power (CHP) Installation, by Fuel Submarket Forecast 2019-2029 (GW)
Figure 5.53 Russia Combined Heat & Power (CHP) Installation Market Forecast 2019-2029, by Fuel ($bn, AGR%)
Figure 5.54 Russia Combined Heat & Power (CHP) Installation, by Prime Mover Submarket Forecast 2019-2029 (GW)
Figure 5.55 Russia Combined Heat & Power (CHP) Installation Market Forecast 2019-2029, by Prime Mover ($bn, AGR%)
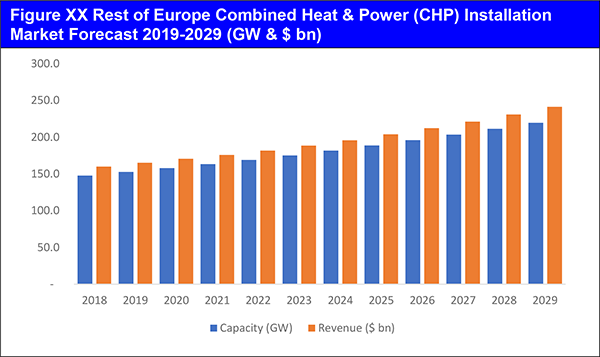
Figure 5.56 Rest of Europe Combined Heat & Power (CHP) Installation Market Forecast 2019-2029 (GW & $ bn)
Figure 5.57 Rest of Europe Combined Heat & Power (CHP) Installation Market Share Forecast 2019, 2024, 2029 (% Share)
Figure 5.58 Rest of Europe Combined Heat & Power (CHP) Installation, by Fuel Submarket Forecast 2019-2029 (GW)
Figure 5.59 Rest of Europe Combined Heat & Power (CHP) Installation Market Forecast 2019-2029, by Fuel ($bn, AGR%)
Figure 5.60 Rest of Europe Combined Heat & Power (CHP) Installation, by Prime Mover Submarket Forecast 2019-2029 (GW)
Figure 5.61 Rest of Europe Combined Heat & Power (CHP) Installation Market Forecast 2019-2029, by Prime Mover ($bn, AGR%)
Figure 5.62 Rest of the World Combined Heat & Power (CHP) Installation Market Forecast 2019-2029 (GW & $ bn)
Figure 5.63 Rest of the World Combined Heat & Power (CHP) Installation Market Share Forecast 2019, 2024, 2029 (% Share)
Figure 5.64 Rest of the World Combined Heat & Power (CHP) Installation, by Fuel Submarket Forecast 2019-2029 (GW)
Figure 5.65 Rest of the World Combined Heat & Power (CHP) Installation Market Forecast 2019-2029, by Fuel ($bn, AGR%)
Figure 5.66 Rest of the World Combined Heat & Power (CHP) Installation, by Prime Mover Submarket Forecast 2019-2029 (GW)
Figure 5.67 Rest of the World Combined Heat & Power (CHP) Installation Market Forecast 2019-2029, by Prime Mover ($bn, AGR%)
Figure 8.1 Global CHP Installation Market, Company Market Share (%) Analysis, 2017
Figure 8.2 General Electric Total Company Revenue, ($bn& AGR %), 2013-2017
Figure 8.3 General Electric % Revenue Share, by Business Segment, 2017
Figure 8.4 General Electric % Revenue Share, by Regional Segment, 2017
Figure 8.5 Siemens AG, Company Revenue, ($bn & AGR %), 2013-2017
Figure 8.6 Siemens AG, % Revenue Share, by Regional Segment, 2017
Figure 8.7 Siemens AG, % Revenue Share, by Business Segment, 2017
Figure 8.8 Siemens AG, Breakup Revenue (US$ Mn), by Sale of Product & Services, 2017
Figure 8.9 Capstone Turbine Corporation, Total Company Revenue 2013-2017 ($mn, AGR %)
Figure 8.10 Capstone Turbine Corporation % Revenue Share, by Product Segment, 2017
Figure 8.11 Capstone Turbine Corporation % Revenue Share, by Regional Segment, 2017
Figure 8.12 Capstone Turbine Corporation Product Shipment, % Share, by Vertical Markets, 2017
Figure 8.13 Capstone Turbine Corporation, Revenue (“000$”), by Sale of Products, 2017
Figure 8.14 2G Energy Inc., Total Company Revenue 2013-2017 ($mn, AGR %)
Figure 8.15 2G Energy Inc. % Revenue Share, by Geographical Segment, 2017
Figure 8.16 2G Energy Inc., CHP System Sales (Units), 2015 & 2016
Figure 8.17 2G Energy Inc., CHP System Sales, % Share, by Fuel Type 2016
Figure 8.18 2G Energy Inc., Order Book (US$ Mn) for CHP Systems; as on August 2017
Figure 8.19 Wartsila Total Company Revenue, ($bn& AGR %), 2013-2017
Figure 8.20 Wartsila Total Company Revenue %Share, by Business Segment, 2017
Figure 8.21 Wartsila Revenue %Share, by Regional Segment, 2017
Figure 8.22 Generac Holdings Inc. Total Company Revenue, ($bn& AGR %), 2014-2017
Figure 8.23 Generac Holdings Inc. % Revenue Share, by Operating Segment, 2017
Figure 8.24 Cummins Inc. Total Company Revenue, ($bn& AGR %), 2014-2017
Figure 8.25 Cummins Inc. % Revenue Share, by Operating Segment, 2017
Figure 8.26 Cummins Inc. % Revenue Share, by Regional Segment, 2017
Figure 8.27 Cummins Inc. – Distribution Segment, Revenue Analysis (US$ Mn), 2017
Figure 8.28 Tecogen, Inc. Total Company Revenue, ($mn & AGR %), 2014-2017
Figure 8.29 Tecogen, Inc. % Revenue Share, by Business Segment, 2017
Figure 8.30 Tecogen, Inc. % Revenue Share, by Regional Segment, 2017
Figure 8.31 Tecogen, Inc. –Product/Service Sales Analysis (US$ Mn), 2017
Figure 9.1 Global Combined Heat & Power (CHP) Installation Market Forecast 2019-2029 ($ bn, GW, AGR %)
Abastible SA
Accurate Solutions & Designs, Inc.
Acrona South Africa
ADA Engineering Co.
Advent International
AIDC
Alstom
Approvisionnement Congo Services (ACS)
Arctic Energy Inc
B&W Megtec
Behco, Inc.
Beijing Haohi Power Tech Co.
Beltran Technologies, Inc.
BMTec
Brandon & Clark Inc.
Brio Energy Private Limited
Cal Microturbine
Capstone Turbine Corporation
Caterpillar
CB Pacific
Clarke Energy
Critchfield Pacific Incorporated
Critical Power Group
CSI Matforce
Cummins Power Generation
DTC Ecoenergia
DV Energy LLC
Ecuatoriana De Petroleos (ECUAPET)
EED International
E-Finity Distributed Generation, LLC
Eko Star d.o.o
Electrosystems LLC
Enertiva Senerco Energy Corporation
Enesa Energia S.A.
EPM Elektro-Projekt Mittweida GmbH
Flex Energy Inc
Fluxo Solucoes Integradas
GAL Power
GEM Energy
Generac Holdings Inc.
General Electric
GESS Consulting Ukraine
Granada Green Energy
Greensmith
Highland West Energy
Horizon Power Systems
InVerde
Jiangsu Jintongling Fluid Machinery Technology Co.
Jonkman Construction Company LLC
Kanamoto Ltd
Kraft Power Corporation
Leon Heimer S/A
Lipten Energy Solutions
Logic Energy
MAN Diesel & Turbo
Marathon Engine Systems
Martin Energy Group
Master Parts and Services S.A.
Mentor Graphics Corporation
MicroTurbine Power
Monelco SRL
Motortech Holding GmbH
Must Capital Gestao e Investimentos, Lda.
Neptunus Power
Northeast Energy Systems
Optimal Group Australia Pty
PENN Power
PlanET Biogas
PM Technologies
PR Industrial s.r.l
Regatta Solutions
RSP Systems
S&G Power Systems
Saratoga Energy Resources
Sarlin Oy
SCE Energy Limited
SEISA
Selmec Equipos Industriales S.A.
Serba Dinamik Sdn Bhd
Seven Turbine Power BV
Siemens
Sino Clean Energy Group
Sky Solar
Supernova Energy Services SAS
Team Power Solutions
Tecogen
Tedom A.S.
TOO Synergy Astana
Top-Well Services Inc.
Turbomaquinarias S.A.
Unison Solutions
Valeo
Vergent Power Solutions, Inc.
Volkswagen
Wartsila
Wels Strom GmbH
Western Energy Systems
White Harvest Energy
Organisations Mentioned
Government of India
The Commercial & Residential Association of China (MAC)
US Environmental Protection Agency
US Government
Download sample pages
Complete the form below to download your free sample pages for Combined Heat & Power (CHP) Installation Market Forecast 2019-2029
Related reports
-

Marine Seismic Equipment & Acquisition Market Forecast 2018-2028
This latest report by business intelligence provider Visiongain assesses that marine seismic equipment and acquisition market will reach $5.01bn in...
Full DetailsPublished: 26 June 2018 -

Small Modular Nuclear Reactor Market Report 2019-2029
The $4.5bn small modular nuclear reactor sector is expected to flourish in the next few years because of the need...Full DetailsPublished: 31 January 2019 -

Van Market Outlook Report 2019-2029
The $40bn van market is expected to flourish in the next few years because of Increasing demand for vans especially...
Full DetailsPublished: 13 November 2018 -

Bag Filter Market Forecast Report 2019-2029
Our 147-page report provides 138 tables, charts, and graphs covering 16 leading and distinct submarkets. Discover the most lucrative areas...Full DetailsPublished: 04 September 2019 -

Electric Vehicle Supply Equipment (EVSE) Market Report 2019-2029
Read on to discover how this definitive report can transform your own research and save you time.
...Full DetailsPublished: 31 December 2018 -

The Plastic-to-Fuel Technologies Market Forecast 2019-2029
Rising usage of plastics is the key driver for oil demand as various chemicals / petrochemicals used in plastics are...
Full DetailsPublished: 14 February 2019 -

The Microgrid Market Forecast 2019-2029
Visiongain has calculated that the Microgrid Market will see a capital expenditure (CAPEX) of $12.6bn in 2019. Read on to...Full DetailsPublished: 25 February 2019 -

The Power Transformers Market Forecast 2018-2028
The increased focus on a more efficient energy grid infrastructure has led Visiongain to publish this timely report. The market...Full DetailsPublished: 27 July 2018 -

The Airborne Geophysical Services Market Forecast 2019-2029
The airborne geophysical services market entails high capital investments along with high risk. The risk involved is comparatively high owing...Full DetailsPublished: 19 March 2019 -

Waste to Energy (WtE) Yearbook 2018
Visiongain assesses that CAPEX on Waste-to-Energy will reach $15.4bn in 2018.
...Full DetailsPublished: 28 September 2018
Download sample pages
Complete the form below to download your free sample pages for Combined Heat & Power (CHP) Installation Market Forecast 2019-2029
Do you have any custom requirements we can help you with?
Any specific country, geo region, market segment or specific company information?
Email us today, we can discuss your needs and see how we can help: jamie.roberts@visiongain.com
Would you like a free report overview of the report of your choice?
If so, please drop an email to Jamie Roberts stating your chosen report title to jamie.roberts@visiongain.com
Visiongain energy reports are compiled using a broad and rich mixture of both primary and secondary information to produce an overall industry outlook. In order to provide our clients with the best product possible product, we do not rely on any one single source of information. Visiongain analysts reach out to market-leading vendors and industry experts where possible but also review a wealth of financial data and product information from a vast range of sources. To find out more about our reports methodology, please email jamie.roberts@visiongain.com
Would you like to get the latest Visiongain energy reports catalogue?
What are the dynamic growth sectors? where are the regional business opportunities?
Which technologies will prevail and who are the leading companies succeeding in these sectors and why?
If you want definitive answers to business critical questions, discover Visiongain’s full range of business intelligence reports.
If so, please email Jamie Roberts on jamie.roberts@visiongain.com or call her today on +44 207 336 6100
“The Visiongain report was extremely insightful and helped us construct our basic go-to market strategy for our solution.”
H.
“F.B has used Visiongain to prepare two separate market studies on the ceramic proppants market over the last 12 months. These reports have been professionally researched and written and have assisted FBX greatly in developing its business strategy and investment plans.”
F.B
“We just received your very interesting report on the Energy Storage Technologies (EST) Market and this is a very impressive and useful document on that subject.”
I.E.N
“Visiongain does an outstanding job on putting the reports together and provides valuable insight at the right informative level for our needs. The EOR Visiongain report provided confirmation and market outlook data for EOR in MENA with the leading countries being Oman, Kuwait and eventually Saudi Arabia.”
E.S
“Visiongain produced a comprehensive, well-structured GTL Market report striking a good balance between scope and detail, global and local perspective, large and small industry segments. It is an informative forecast, useful for practitioners as a trusted and upto-date reference.”
Y.N Ltd
Association of Dutch Suppliers in the Oil & Gas Industry
Society of Naval Architects & Marine Engineers
Association of Diving Contractors
Association of Diving Contractors International
Associazione Imprese Subacquee Italiane
Australian Petroleum Production & Exploration Association
Brazilian Association of Offshore Support Companies
Brazilian Petroleum Institute
Canadian Energy Pipeline
Diving Medical Advisory Committee
European Diving Technology Committee
French Oil and Gas Industry Council
IMarEST – Institute of Marine Engineering, Science & Technology
International Association of Drilling Contractors
International Association of Geophysical Contractors
International Association of Oil & Gas Producers
International Chamber of Shipping
International Shipping Federation
International Marine Contractors Association
International Tanker Owners Pollution Federation
Leading Oil & Gas Industry Competitiveness
Maritime Energy Association
National Ocean Industries Association
Netherlands Oil and Gas Exploration and Production Association
NOF Energy
Norsk olje og gass Norwegian Oil and Gas Association
Offshore Contractors’ Association
Offshore Mechanical Handling Equipment Committee
Oil & Gas UK
Oil Companies International Marine Forum
Ontario Petroleum Institute
Organisation of the Petroleum Exporting Countries
Regional Association of Oil and Natural Gas Companies in Latin America and the Caribbean
Society for Underwater Technology
Society of Maritime Industries
Society of Petroleum Engineers
Society of Petroleum Enginners – Calgary
Step Change in Safety
Subsea UK
The East of England Energy Group
UK Petroleum Industry Association
All the events postponed due to COVID-19.
Latest Energy news
Visiongain Publishes Carbon Capture Utilisation and Storage (CCUS) Market Report 2024-2034
The global carbon capture utilisation and storage (CCUS) market was valued at US$3.75 billion in 2023 and is projected to grow at a CAGR of 20.6% during the forecast period 2024-2034.
19 April 2024
Visiongain Publishes Liquid Biofuels Market Report 2024-2034
The global Liquid Biofuels market was valued at US$90.7 billion in 2023 and is projected to grow at a CAGR of 6.7% during the forecast period 2024-2034.
03 April 2024
Visiongain Publishes Hydrogen Generation Market Report 2024-2034
The global Hydrogen Generation market was valued at US$162.3 billion in 2023 and is projected to grow at a CAGR of 3.7% during the forecast period 2024-2034.
28 March 2024
Visiongain Publishes Biofuel Industry Market Report 2024-2034
The global Biofuel Industry market was valued at US$123.2 billion in 2023 and is projected to grow at a CAGR of 7.6% during the forecast period 2024-2034.
27 March 2024
