Industries > Automotive > Connected Trucks Market Outlook Report 2018-2028
Connected Trucks Market Outlook Report 2018-2028
Forecasts ($m & Unit Sales Volume) by Component (Hardware, Software), by Region & by Country Plus Analysis of Leading Companies Developing Telematics & Connectivity Technologies Within the Internet of Things (IoT) Ecosystem
The connected trucks market is on a strong growth trajectory right now. The connected solutions market in particular is booming due to its increasing adoption in vehicles due to improved vehicle performance, increased connectivity, enhanced driver in-vehicle experiences, low maintenance costs and growing demand for vehicle safety on a global level. Visiongain evaluates the connected trucks market as worth $22.9bn in 2018 with major opportunities for incumbent and new entrants to capitalize upon this market expansion.
Market Trends
• Growth opportunities in emerging markets
• Increasing trend for connected devices
• Improving business conditions and company expansions
• Growing regulations regarding the safety and security of vehicles
Quantitative Data
• Global Connected Trucks Forecasts From 2018-2028 ($m & Unit Sales Volume)
• Regional Connected Trucks Forecasts From 2018-2028 ($m & Unit Sales Volume)
• Asia-Oceania Connected Trucks Forecast 2018-2028 ($m & Unit Sales Volume)
• China Connected Trucks Forecast 2018-2028 ($m & Unit Sales Volume)
• India Connected Trucks Forecast 2018-2028 ($m & Unit Sales Volume)
• Japan Connected Trucks Forecast 2018-2028 ($m & Unit Sales Volume)
• Rest of Asia-Oceania Connected Trucks Forecast 2018-2028 ($m & Unit Sales Volume)
• North America Connected Trucks Forecast 2018-2028 ($m & Unit Sales Volume)
• US Connected Trucks Forecast 2018-2028 ($m & Unit Sales Volume)
• Canada Connected Trucks Forecast 2018-2028 ($m & Unit Sales Volume)
• Mexico Connected Trucks Forecast 2018-2028 ($m & Unit Sales Volume)
• Europe Connected Trucks Forecast 2018-2028 ($m & Unit Sales Volume)
• UK Connected Trucks Forecast 2018-2028 ($m & Unit Sales Volume)
• Germany Connected Trucks Forecast 2018-2028 ($m & Unit Sales Volume)
• France Connected Trucks Forecast 2018-2028 ($m & Unit Sales Volume)
• Rest of Europe Connected Trucks Forecast 2018-2028($m & Unit Sales Volume)
• RoW Connected Trucks Forecast 2018-2028 ($m & Unit Sales Volume)
• Brazil Connected Trucks Forecast 2018-2028 ($m & Unit Sales Volume)
• South Africa Connected Trucks Forecast 2018-2028 ($m & Unit Sales Volume)
• Others Connected Trucks Forecast 2018-2028 ($m & Unit Sales Volume)
• Connected Trucks Submarket Forecasts By Component From 2018-2028 ($m & Unit Sales Volume)
• Hardware Forecast 2018-2028 ($m & Unit Sales Volume)
• Software Forecast 2018-2028 ($m & Unit Sales Volume)
Qualitative Analyses
• SWOT Analysis Of The Connected Trucks Market
• Drivers And Restraints For Each Market Space
• Porter’s Five Forces Analysis
Competitive Landscape Analysis Of The Leading Companies
• Continental AG
• Robert Bosh GmbH
• Harman International
• ZF TRW
• Delphi Automotive
• NXP Semiconductors
• Sierra Wireless
• TomTom Telematics
• Trimble
• Verizon Telematics
• Denso Corporation
• Magna International Inc
Who should read this report?
• Automotive OEMs
• Truck manufacturers
• Telematics specialists
• Telecoms companies
• Component suppliers
• Electronics companies
• Hardware vendors
• Software developers
• Cyber security companies
• Heads of strategic development
• Marketing staff
• Market analysts
• Procurement staff
• Utility company managers
• Industry administrators
• Industry associations
• Market analysts
• Consultants
• Managers
• Governmental departments & agencies
Visiongain is a trading partner with the US Federal Government
CCR Ref number: KD4R6
1. Report Overview
1.1 Introduction
1.2 Global Connected trucks Market Overview
1.3 Why You Should Read This Report
1.4 How This Report Delivers
1.5 Key Questions Answered by This Analytical Report Include
1.6 Who is This Report For?
1.7 Frequently Asked Questions (FAQ)
1.8 Associated Visiongain Reports
1.9 About Visiongain
2. Research Methodology
2.1 Primary Research
2.2 Secondary Research
2.3 Market Evaluation & Forecasting Methodology
3. Market Overview
3.1 Global Connected Trucks Market Drivers & Restraints 2018
3.1.1 Global Connected Trucks Market Drivers 2018
3.1.1.1 Increasing Trend Of Connected Devices
3.1.1.2 Improving Business Conditions And Company Expansions
3.1.1.3 Growing Regulations Regarding The Safety And Security Of Vehicle
3.1.2 Global Connected Trucks Market Restraints 2018
3.1.2.1 High Emphasis On Cybersecurity For Connected Trucks
3.2. SWOT Analysis of the Global Connected Trucks Market 2018-2028
3.2.1 Increasing Demand For On-Time Delivery And Effective Asset Utilization
3.2.2 Strong R&D Expertise Resulting In Better, Advanced Connected Truck Technologies
3.2.3 Car Recalls Due To Manufacturing Defect Or Technological Failure
3.2.4 Growing Technological Advancements In Connected Trucks Market
3.2.5 Intense Competition In The Automotive Industry
3.3. PORTER’s Five Force Model of the Global Connected Trucks Market 2018-2028
3.3.1 Competitive Rivalry
3.3.2 Supplier’s Bargaining Power
3.3.3 Buyer’s Bargaining Power
3.3.4 Threat of Substitution
3.3.5 Threat of New Entrants
4. Connected Trucks Market, By Region 2018-2028
4.1 Global Connected Trucks Market Forecast 2018-2028, By Region
4.1.1 Asia-Oceania Connected Truck Market 2018-2028
4.1.1.1 China Connected Trucks Market 2018-2028
4.1.1.2 India Connected Trucks Market 2018-2028
4.1.1.3 Japan Connected Trucks Market 2018-2028
4.1.1.4 Rest of Asia-Oceania Connected Trucks Market 2018-2028
4.1.2 North America Connected Trucks Market 2018-2028
4.1.2.1 U.S. Connected Trucks Market 2018-2028
4.1.2.2 Canada Connected Trucks Market 2018-2028
4.1.2.3 Mexico Connected Trucks Market 2018-2028
4.1.3 Europe Connected Trucks Market 2018-2028
4.1.3.1 Germany Connected Trucks Market 2018-2028
4.1.3.2 U.K. Connected Trucks Market 2018-2028
4.1.3.3 France Connected Trucks Market 2018-2028
4.1.3.4 Rest of Europe Connected Trucks Market 2018-2028
4.1.4 Rest of the World Connected Trucks Market 2018-2028
4.1.4.1 Brazil Connected Trucks Market 2018-2028
4.1.4.2 South Africa Connected Trucks Market 2018-2028
4.1.4.3 Others Connected Trucks Market 2018-2028
5. Connected Trucks Market, By Component 2018-2028
5.1 Global Connected Trucks Market Forecast 2018-2028, By Component
5.1.1 Global Hardware Component Market, By Region 2018-2028
5.1.1.1.1 Asia-Oceania Hardware Component Market, By Country 2018-2028
5.1.1.1.2 North America Hardware Component Market By Country 2018-2028
5.1.1.2 Europe Hardware Component Market By Country 2018-2028
5.1.1.2.1 Rest of the World Hardware Component Market By Country 2018-2028
5.1.2 Software Component Market By Region 2018-2028
5.1.2.1 Asia-Oceania Software Component Market By Country 2018-2028
5.1.2.2 North America Software Component Market By Country 2018-2028
5.1.2.3 Europe Software Component Market By Country 2018-2028
5.1.2.4 Rest of the World Software Component Market By Country 2018-2028
6. Competitive Landscape
6.1.1 Acquisitions
6.1.2 New Product Development
6.1.3 Partnership
6.1.4 Expansions
7. Leading Companies Involved With Connected Trucks
7.1 Robert Bosch GmbH
7.1.2 Robert Bosch’s Role in the Connected Services Market
7.1.3 Robert Bosch’s Connected Services Systems Portfolio
7.1.4 Robert Bosch’s Future Outlook
7.2 Continental AG
7.2.1 Continental AG Company Overview
7.2.2 Continental’s Role in the Connected Trucks Market
7.2.3 Continental’s Connected Trucks Product Portfolio
7.2.4 Continental’s Future Outlook
7.2.5 Continental’s Developments
7.3 Denso Corporation
7.3.1 Denso Corporation Company Overview
7.3.2 Denso Corporation’s Role in the Connected Trucks Market
7.3.3 Denso Corporation’s Connected Trucks Product Portfolio
7.3.4 Denso Corporation’s Future Outlook
7.4 Delphi Automotive PLC
7.4.1 Delphi Automotive PLC Company Overview
7.4.2 Delphi Automotive’s Role in the Telematics Systems Market
7.4.3 Delphi Automotive’s Telematics Systems Portfolio
7.4.4 Delphi Automotive’s Future Outlook
7.5 Harman International
7.5.1 Harman International Company Overview
7.5.2 Harman’s Role in Connected Vehicles Market
7.5.3 Harman’s Telematics Portfolio
7.5.4 Harman’s Future Outlook
7.5.5 Harman’s Recent Developments
7.6 ZF TRW
7.6.1 ZF TRW Company Overview
7.6.2 ZF TRW’s Role in the Telematics Systems Market
7.6.3 ZF TRW’s Telematics Systems Portfolio
7.6.4 ZF TRW’s Future Outlook
7.7 NXP Semiconductors N.V.
7.7.1 NXP Semiconductors N.V. Company Overview
7.7.2 NXP Semiconductors N.V.’s Role in Fleet Management Service Market
7.7.3 NXP Semiconductors N.V.’s Fleet Management Portfolio
7.7.4 NXP Semiconductors N.V.’s Future Outlook
7.8 Magna International Inc.
7.8.1 Magna International Inc. Company Overview
7.8.2 Magna’s Role in the Connected Trucks Market
7.8.3 Magna’s Connected Trucks Product Portfolio
7.8.4 Magna’s Future Outlook
7.9 Sierra Wireless
7.9.1 Sierra Wireless Company Overview
7.9.2 Sierra Wireless’s Role in Telematics Solutions Market
7.9.3 Sierra Wireless’s Telematics Portfolio
7.9.4 Sierra Wireless’s Future Outlook
7.9.5 Sierra Wireless Recent Developments
7.10 TomTom
7.10.1 TomTom Company Overview
7.10.2 TomTom’s Role in Fleet Management Service and Telematics Solutions Market
7.10.3 TomTom’s Telematics Portfolio
7.10.4 TomTom’s Future Outlook
7.10.5 TomTom Recent developments
7.11 Trimble
7.11.1 Trimble Company Overview
7.11.2 Trimble’s Role in Fleet Management and Telematics Solutions Market
7.11.3 Trimble’s Mobile Solution’s Portfolio
7.11.4 Trimble’s Future Outlook
7.11.5 Trimble Recent developments
7.12 Verizon Telematics
7.12.1 Verizon Telematics Company Overview
7.12.2 Verizon Telematics’s Role in the Connected Vehicles Market
7.12.3 Verizon Telematics Fleet Management Portfolio
7.12.4 Verizon Telematics Future Outlook
7.12.5 Verizon Telematics Recent Developments
8. Conclusions
8.1 Asia-Oceania Connected Trucks Market
8.1.1 China Connected Trucks Market
8.1.2 India Connected Trucks Market
8.1.3 Japan Connected Trucks Market
8.2 Europe Connected Trucks Market
8.2.1 Germany Connected Trucks Market
8.2.2 U.K. Connected Trucks Market
8.2.3 France Connected Trucks Market
8.3 North America Connected Trucks Market
8.3.1 U.S. Connected Trucks Market
8.3.2 Canada Connected Trucks Market
8.3.3 Mexico Connected Trucks Market
8.4 Rest of the World Connected Trucks Market
9. Glossary of Terms
List of Tables
Table 3.1 Global Connected Trucks Market Drivers & Restraints 2018
Table 3.2 Global Connected Trucks Market SWOT Analysis 2018-2028
Table 4.1 Global Forecast of Connected Truck Market By Region, 2018-2028 (Units, CAGR %)
Table 4.2 Global Forecast of Connected Truck Market By Region, 2018-2028 ($Million, CAGR %)
Table 4.3 Asia-Oceania Forecast of Connected Truck By Country, 2018-2028 (Units, AGR %)
Table 4.4 Asia-Oceania Forecast of Connected Truck By Country, 2018-2028 ($Million, AGR %)
Table 4.5 Asia-Oceania Forecast of Connected Truck Systems By Component, 2018-2028 (Units, AGR %)
Table 4.6 Asia-Oceania Forecast of Connected Truck Systems By Component, 2018-2028 ($Million, AGR %)
Table 4.7 Chinese Forecast of Connected Truck By Component, 2018-2028 (Units, AGR %)
Table 4.8 Chinese Forecast of Connected Truck By Component, 2018-2028 ($Million, AGR %)
Table 4.9 Indian Forecast of Connected Truck By Component, 2018-2028 (Units, AGR %)
Table 4.10 Indian Forecast of Connected Truck By Component, 2018-2028 ($Million, AGR %)
Table 4.11 Japanese Forecast of Connected Trucks Market By Component, 2018-2028 (Units, AGR %)
Table 4.12 Japanese Forecast of Connected Trucks Market By Component, 2018-2028 ($Million, AGR %)
Table 4.13 Rest of Asia-Oceania Forecast of Connected Trucks By Component, 2018-2028 (Units, AGR %)
Table 4.14 Rest of Asia-Oceania Forecast of Connected Trucks By Component, 2018-2028 ($Million, AGR %)
Table 4.15 North American Connected Trucks Market By Country, 2018-2028 (Units, AGR %)
Table 4.16 North American Connected Trucks Market By Country, 2018-2028 ($Million, AGR %)
Table 4.17 North American Connected Trucks Market By Component, 2018-2028 (Units, AGR %)
Table 4.18 North American Connected Trucks Market By Component, 2018-2028 ($Million, AGR %)
Table 4.19 U.S. Connected Trucks Market By Component, 2018-2028 (Units, AGR %)
Table 4.20 U.S. Connected Trucks Market By Component, 2018-2028 ($Million, AGR %)
Table 4.21 Canada Connected Trucks Market By Component, 2018-2028 (Units, AGR %)
Table 4.22 Canada Connected Trucks Market By Component, 2018-2028 ($Million, AGR %)
Table 4.23 Mexican Connected Trucks Market By Component, 2018-2028 (Units, AGR %)
Table 4.24 Mexican Connected Trucks Market By Component, 2018-2028 ($Million, AGR %)
Table 4.25 European Connected Trucks By Component, 2018-2028 (Units, AGR %)
Table 4.26 European Connected Trucks By Component, 2018-2028 ($Million, AGR %)
Table 4.27 European Connected Trucks Market By Component, 2018-2028 (Units, AGR %)
Table 4.28 European Connected Trucks Market By Component, 2018-2028 ($Million, AGR %)
Table 4.29 German Connected Trucks Market By Component, 2018-2028 (Units, AGR %)
Table 4.30 German Connected Trucks Market By Component, 2018-2028 ($Million, AGR %)
Table 4.31 U.K. Connected Trucks Market By Component, 2018-2028 (Units, AGR %)
Table 4.32 U.K. Connected Trucks Market By Component, 2018-2028 ($Million, AGR %)
Table 4.33 France Connected Trucks Market By Component, 2018-2028 (Units, AGR %)
Table 4.34 France Connected Trucks Market By Component, 2018-2028 ($Million, AGR %)
Table 4.35 Rest of Europe Connected Trucks Market By Component, 2018-2028 (Units, AGR %)
Table 4.36 Rest of Europe Connected Trucks Market By Component, 2018-2028 ($Million, AGR %)
Table 4.37 Rest of the World Connected Trucks Market, By Country, 2018-2028 (Units, AGR %)
Table 4.38 Rest of the World Connected Trucks Market, By Country, 2018-2028 ($Million, AGR %)
Table 4.39 Rest of the World Connected Trucks Market, By Component, 2018-2028 (Units, AGR %)
Table 4.40 Rest of the World Connected Trucks Market, By Component, 2018-2028 ($Million, AGR %)
Table 4.41 Brazilian Connected Trucks Market, By Component, 2018-2028 (Units, AGR %)
Table 4.42 Brazilian Connected Trucks Market, By Component, 2018-2028 ($Million, AGR %)
Table 4.43 South African Connected Trucks Market, By Component, 2018-2028 (Units, AGR %)
Table 4.44 South African Connected Trucks Market, By Component, 2018-2028 ($Million, AGR %)
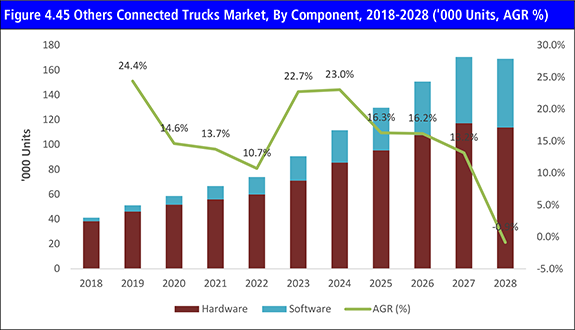
Table 4.45 Others Connected Trucks Market, By Component, 2018-2028 (Units, AGR %)
Table 4.46 Others Connected Trucks Market, By Component, 2018-2028 ($Million, AGR %)
Table 5.1 Global Connected Trucks Market By Component, 2018-2028 (Units, AGR %)
Table 5.2 Global Connected Trucks Market By Component, 2018-2028 ($Million, AGR %)
Table 5.3 Global Hardware Component Market By Region, 2018-2028 (Units, AGR %)
Table 5.4 Global Hardware Component Market By Region, 2018-2028 ($Million, AGR %)
Table 5.5 Asia-Oceania Hardware Component Market By Country, 2018-2028 (Units, AGR %)
Table 5.6 Asia-Oceania Hardware Component Market By Country, 2018-2028 ($Million, AGR %)
Table 5.7 North American Hardware Component Market By Country, 2018-2028 (Units, AGR %)
Table 5.8 North American Hardware Component Market By Country, 2018-2028 ($Million, AGR %)
Table 5.9 European Hardware Component Market By Country, 2018-2028 (Units, AGR %)
Table 5.10 European Hardware Component Market By Country, 2018-2028 ($Million, AGR %)
Table 5.11 Rest of the World Hardware Component Market By Country, 2018-2028 (Units, AGR %)
Table 5.12 Rest of the World Hardware Component Market By Country, 2018-2028 ($Million, AGR %)
Table 5.13 Global Software Component Market By Region, 2018-2028 (Units, AGR %)
Table 5.14 Global Software Component Market By Region, 2018-2028 ($Million, AGR %)
Table 5.15 Asia-Oceania Shift by Wire Market By Country, 2018-2028 (Units, AGR %)
Table 5.16 Asia-Oceania Shift by Wire Market By Country, 2018-2028 ($Million, AGR %)
Table 5.17 North American Software Component Market By Country, 2018-2028 (Units, AGR %)
Table 5.18 North American Software Component Market By Country, 2018-2028 ($Million, AGR %)
Table 5.19 European Software Component Market By Country, 2018-2028 (Units, AGR %)
Table 5.20 European Software Component Market By Country, 2018-2028 ($Million, AGR %)
Table 5.21 Rest of the World Software Component Market By Country, 2018-2028 (Units, AGR %)
Table 5.22 Rest of the World Software Component Market By Country, 2018-2028 ($Million, AGR %)
Table 6.1 Acquisitions (Date, Company, Details)
Table 6.2 New Product Development (Date, Company, Details)
Table 6.3 Partnerships (Date, Company, Details)
Table 6.4 Expansions (Date, Company, Details)
Table 7.1.1 Robert Bosch GmbH Company Overview (Company Revenue, Telematics Systems-Related Products Segment, HQ, Employees, Website)
Table 7.1.2 Robert Bosch GmbH Financials 2012-2016 (5-year Revenue, Capital Expenditure, EBIT, R8D Cost), (In $Million)
Table 7.1.3 Robert Bosch’s Connected Services Systems Product Portfolio
Table 7.2.1 Continental AG Company Overview (Company Revenue, Connected Trucks-Related Products Segment, HQ, Employees, Website)
Table 7.2.2 Continental Financials 2012-2016 (5-year Revenue, Gross Profit, EBIT, R&D Cost), (In $Million)
Table 7.2.3 Continental’s Telematics Systems Product Portfolio
Table 7.2.4 Continental’s Key Developments
Table 7.3.1 Denso Corporation Company Overview (Company Revenue, Connected Trucks-Related Products Segment, HQ, Employees, Website)
Table 7.3.2 Denso Corporation Financials 2012-2016 (5-year Revenue, Operating Profit, Capital Expenditure, R8D Expenditure), (In $Million)
Table 7.3.3 Denso Corporation’s Connected Trucks Product Portfolio
Table 7.4.1 Delphi Automotive PLC Company Overview (Company Revenue, Telematics Systems-Related Products Segment, HQ, Employees, Website)
Table 7.4.2 Delphi Automotive PLC Financials 2012-2016 (5-year Revenue, Gross Profit, SG&A Cost, R8D Cost), (In $Million)
Table 7.4.3 Delphi’s Telematics Systems Product Portfolio
Table 7.5.1 Harman International Company Overview (Company Revenue, Telematics-Related Products Segment, HQ, Employees, Website)
Table 7.5.2 Harman’s Telematics Product Portfolio
Table 7.5.3 Harman’s Key Developments
Table 7.6.1 ZF TRW Company Overview (Company Revenue, Connected Trucks-Related Products Segment, HQ, Employees, Website)
Table 7.6.2 ZF TRW Financials 2012-2016 (5-year Revenue, Gross Profit, EBIT, R8D Cost), (In $Million)
Table 7.6.3 ZF TRW’s Telematics Systems Product Portfolio
Table 7.7.1 NXP Semiconductors N.V. Company Overview (Company Revenue, Telematics-Related Products Segment, HQ, Employees, Website)
Table 7.7.2 NXP Semiconductors N.V. Financials 2012-2016 (5-year Revenue, Gross Profit, EBIT, R&D Cost), (In $Million)
Table 7.7.3 NXP Semiconductors N.V.’s Telematics Product Portfolio
Table 7.8.1 Magna International Inc. Company Overview (Company Revenue, Connected Trucks-Related Products Segment, HQ, Employees, Website)
Table 7.8.2 Magna International Inc. Financials 2012-2016 (5-year Revenue, Net Income, Adjusted EBIT, SG&A), (In $Million)
Table 7.8.3 Magna’s Connected Trucks Product Portfolio
Table 7.9.1 Sierra Wireless Company Overview (Company Revenue, Connected Trucks-Related Products Segment, HQ, Employees, Website)
Table 7.9.2 Sierra Wireless Financials 2012-2016 (5-year Revenue), (In $Million)
Table 7.9.3 Sierra Wireless’s Telematics Product Portfolio
Table 7.10.1 TomTom Company Overview (Company Revenue, Telematics Business Segment, HQ, Employees, Website)
Table 7.10.2 TomTom Financials 2012-2016 (5-year Revenue, Gross Profit, EBIT, R&D Cost), (In $Million)
Table 7.10.3 TomTom’s Telematics Product Portfolio
Table 7.10.4 TomTom’s Key Developments
Table 7.11.1 Trimble Company Overview (Company Revenue, Telematics Business Segment, HQ, Employees, Website)
Table 7.11.2 Continental Financials 2012-2016 (5-year Revenue), (In $Million)
Table 7.11.3 Trimble’s Mobile Solutions
Table 7.11.4 Trimble’s Key Developments
Table 7.12.1 Verizon Telematics Company Overview (Company Revenue, Telematics Business Segment, HQ, Employees, Website)
Table 7.12.2 Verizon Telematics Financials 2012-2016 (5-year Revenue, Net Profit), (In $Million)
Table 7.12.3 Verizon Telematics Fleet Management Systems Product Portfolio
Table 7.12.4 Verizon Telematics Key Developments
List of Figures
Figure 1.1 Global Connected Trucks Market: By Region
Figure 1.2 Global Connected Trucks Market: By Component
Figure 2.1 Market Evaluation and Forecasting Model: Bottom – Up Approach
Figure 4.1 Global Forecast of Connected Truck Market By Region, 2018-2028 (‘000 Units, AGR %)
Figure 4.2 Global Forecast of Connected Truck Market By Region, 2018-2028 ($Billion, AGR %)
Figure 4.3 Asia-Oceania Forecast of Connected Truck By Country, 2018-2028 ('000 Units, AGR %)
Figure 4.4 Asia-Oceania Forecast of Connected Truck By Country, 2018-2028 ($Billion, AGR %)
Figure 4.5 Asia-Oceania Forecast of Connected Truck By Component, 2018-2028 ('00 Units, AGR %)
Figure 4.6 Asia-Oceania Forecast of Connected Truck By Component, 2018-2028 (‘00 $Million, AGR %)
Figure 4.7 Chinese Forecast of Connected Truck By Component, 2018-2028 ('000 Units, AGR %)
Figure 4.8 Chinese Forecast of Connected Truck By Component, 2018-2028 (‘00 $Million, AGR %)
Figure 4.9 Indian Forecast of Connected Truck By Component, 2018-2028 (‘00 units, AGR %)
Figure 4.10 Indian Forecast of Connected Truck By Component, 2018-2028 (‘00 $Million, AGR %)
Figure 4.11 Japanese Forecast of Connected Trucks Market By Component, 2018-2028 ('000 Units, AGR %)
Figure 4.12 Japanese Forecast of Connected Trucks Market By Component, 2018-2028 (‘00 $Million, AGR %)
Figure 4.13 Rest of Asia-Oceania Forecast of Connected Trucks By Component, 2018-2028 ('00 Units, AGR %)
Figure 4.14 Rest of Asia-Oceania Forecast of Connected Trucks By Component, 2018-2028 (‘00 $Million, AGR %)
Figure 4.15 North American Connected Trucks Market By Country, 2018-2028 ('00 Units, AGR %)
Figure 4.16 North American Connected Trucks Market By Country, 2018-2028 (’00 $Million, AGR %)
Figure 4.17 North American Connected Trucks Market By Component, 2018-2028 ('000 Units, AGR %)
Figure 4.18 North American Connected Trucks Market By Component, 2018-2028 (’00 $Million, AGR %)
Figure 4.19 U.S. Connected Trucks Market By Component, 2018-2028 ('000 Units, AGR %)
Figure 4.20 U.S. Connected Trucks Market By Component, 2018-2028 (’00 $Million, AGR %)
Figure 4.21 Canada Connected Trucks Market By Component, 2018-2028 ('000 Units, AGR %)
Figure 4.22 Canada Connected Trucks Market By Component, 2018-2028 (’00 $Million, AGR %)
Figure 4.23 Mexican Connected Trucks Market By Component, 2018-2028 ('000 Units, AGR %)
Figure 4.24 Mexican Connected Trucks Market By Component, 2018-2028 (‘00 $Million, AGR %)
Figure 4.25 European Connected Trucks By Component, 2018-2028 ('00 Units, AGR %)
Figure 4.26 European Connected Trucks By Component, 2018-2028 (’00 $Million, AGR %)
Figure 4.27 European Connected Trucks Market By Component, 2018-2028 '000 Units, AGR %)
Figure 4.28 European Connected Trucks Market By Component, 2018-2028 (’00 $Million, AGR %)
Figure 4.29 German Connected Trucks Market By Component, 2018-2028 ('000 Units, AGR %)
Figure 4.30 German Connected Trucks Market By Component, 2018-2028 (’00 $Million, AGR %)
Figure 4.31 U.K. Connected Trucks Market By Component, 2018-2028 ('000 Units, AGR %)
Figure 4.32 U.K. Connected Trucks Market By Component, 2018-2028 (’00 $Million, AGR %)
Figure 4.33 France Connected Trucks Market By Component, 2018-2028 ('000 Units, AGR %)
Figure 4.34 France Connected Trucks Market By Component, 2018-2028 (’00 $Million, AGR %)
Figure 4.35 Rest of Europe Connected Trucks Market By Component, 2018-2028 ('000 Units, AGR %)
Figure 4.36 Rest of Europe Connected Trucks Market By Component, 2018-2028 (’00 $Million, AGR %)
Figure 4.37 Rest of the World Connected Trucks Market, By Country, 2018-2028 ('00 Units, AGR %)
Figure 4.38 Rest of the World Connected Trucks Market, By Country, 2018-2028 (’00 $Million, AGR %)
Figure 4.39 Rest of the World Connected Trucks Market, By Component, 2018-2028 ('00 Units, AGR %)
Figure 4.40 Rest of the World Connected Trucks Market, By Component, 2018-2028 (’00 $Million, AGR %)
Figure 4.41 Brazilian Connected Trucks Market, By Component, 2018-2028 ('000 Units, AGR %)
Figure 4.42 Brazilian Connected Trucks Market, By Component, 2018-2028 (’00 $Million, AGR %)
Figure 4.43 South African Connected Trucks Market, By Component, 2018-2028 ('000 Units, AGR %)
Figure 4.44 South African Connected Trucks Market, By Component, 2018-2028 (’00 $Million, AGR %)
Figure 4.45 Others Connected Trucks Market, By Component, 2018-2028 ('000 Units, AGR %)
Figure 4.46 Others Connected Trucks Market, By Country, 2018-2028 (’00 $Million, AGR %)
Figure 5.1 Global Connected Trucks Market By Component, 2018-2028 ('000 Units, AGR %)
Figure 5.2 Global Connected Trucks Market By Component, 2018-2028 ($Billion, AGR %)
Figure 5.3 Global Hardware Component Market By Region, 2018-2028 ('000 Units, AGR %)
Figure 5.4 Global Hardware Component Market By Region, 2018-2028 ($Billion, AGR %)
Figure 5.5 Asia-Oceania Hardware Component Market By Country, 2018-2028 ('000 Units, AGR %)
Figure 5.6 Asia-Oceania Hardware Component Market By Country, 2018-2028 ($Billion, AGR %)
Figure 5.7 North American Hardware Component Market By Country, 2018-2028 ('000 Units, AGR %)
Figure 5.8 North American Hardware Component Market By Country, 2018-2028 ($Billion, AGR %)
Figure 5.9 European Hardware Component Market By Country, 2018-2028 ('000 Units, AGR %)
Figure 5.10 European Hardware Component Market By Country, 2018-2028 ($Billion, AGR %)
Figure 5.11 Rest of the World Hardware Component Market By Country, 2018-2028 ('000 Units, AGR %)
Figure 5.12 Rest of the World Hardware Component Market By Country, 2018-2028 (’00 $Million, AGR %)
Figure 5.13 Global Software Component Market By Region, 2018-2028 ('000 Units, AGR %)
Figure 5.14 Global Software Component Market By Region, 2018-2028 (’00 $Million, AGR %)
Figure 5.15 Asia-Oceania Shift by Wire Market By Country, 2018-2028 ('000 Units, AGR %)
Figure 5.16 Asia-Oceania Shift by Wire Market By Country, 2018-2028 ($Billion, AGR %)
Figure 5.17 North American Software Component Market By Country, 2018-2028 ('000 Units, AGR %)
Figure 5.18 North American Software Component Market By Country, 2018-2028 (’00 $Million, AGR %)
Figure 5.19 European Software Component Market By Country, 2018-2028 ('000 Units, AGR %)
Figure 5.20 European Software Component Market By Country, 2018-2028 (’00 $Million, AGR %)
Figure 5.21 Rest of the World Software Component Market By Country, 2018-2028 ('000 Units, AGR %)
Figure 5.22 Rest of the World Software Component Market By Country, 2018-2028 (’00 $Million, AGR %)
Figure 6.1 Market Developments Share, By Type, 2016-17
Figure 7.1.1 Robert Bosch’s 2016 Sales by Region (%)
Figure 7.1.2 Robert Bosch’s 2016 Sales by Business Segment (%)
Figure 7.2.1 Continental’s 2016, Sales by Region (%)
Figure 7.2.2 Continental’s 2016, Sales by Business Segment (%)
Figure 7.3.1 Denso Corporation’s 2016 Sales by Region (%)
Figure 7.3.2 Denso Corporation’s 2016 Sales by Products Category (%)
Figure 7.4.1 Delphi Automotive’s 2016 Sales by Region (%)
Figure 7.4.2 Delphi Automotive’s 2016 Sales by Business Segment (%)
Figure 7.6.1 ZF TRW’s 2016 Sales by Region (%)
Figure 7.6.2 ZF TRW’s 2016 Sales by Products Segment (%)
Figure 7.7.1 NXP Semiconductors N.V.’s 2016, Sales by Business Segment (%)
Figure 7.8.1 Magna’s 2016 Sales by Region (%)
Figure 7.8.2 Magna’s 2016 Sales by Business Segment (%)
Figure 7.9.1 Sierra Wireless’s 2016, Sales by Geographic Segment (%)
Figure 7.9.2 Sierra Wireless’s 2016, Sales by Business Segment (%)
Figure 7.10.1 TomTom’s 2016 Sales by Region (%)
Figure 7.10.2 TomTom’s 2016, Sales by Business Segment (%)
Figure 7.11.1 Trimble’s 2016 Sales by Region (%)
Figure 7.11.2 Trimble’s 2016, Sales by Business Segment (%)
Figure 7.12.1 Verizon Telematic’s 2016, Sales by Business Segment (%)
Adgero
Aliianz
Applied Generics
Audi AG
Autonomous GmbH
Blackbuck
BMW
Bright Box HK Ltd.
CalAmp
Chrono Truck
Continental AG
Control-Tec LLC
Delphi Automotive PLC
Denso Corporation
Fleetmatics
Fleetmatics Group PLC
GenX Mobile Incorporated
Harman International
Honda Motor Co., Ltd.
Innovative Software Engineering (ISE)
Keep Truckin
LeasePlan
LexisNexis
Lightmetrics
LoadMe
LoadSmart
Magna International Inc
Marmalade
Michelin
Movildata Internacional
NetraDyne
Nissan
NXP Semiconductors N.V
Otto
Philips & Lite-On Digital Solutions (PLDS
Quantum Inventions
Quicargo
Robert Bosch GmBH
Sierra Wireless Inc.
Sierra Wireless’s Enterprise Solutions Business Unit
Telogis
Tesla Motors
The Bosch Group
TomTom
TomTom Telematics
Toshiba Corporation
Transfix
TrimbleTrimble Navigation Ltd
Trucker Path
TruckPad
TruckSuvidha
TRW
Vaahika
Verizon Communications Inc
Verizon Telematics
VersaFleet
Volvo Car Corporation
WorkHound
ZF Group
ZF TRW
Zootly
Zurich Insurance Group
Organisations Mentioned
European New Car Assessment Programme (EuroNCAP)
Europe Central Bank (ECB)
Indian Ministry of Road Transport & Highways
National Highway Traffic Safety Administration (NHSTA)
Organisation Internationale des Constructeurs d'Automobiles (OICA)
Download sample pages
Complete the form below to download your free sample pages for Connected Trucks Market Outlook Report 2018-2028
Related reports
-

Connected Car Market Report 2019-2029
The latest report from business intelligence provider Visiongain offers comprehensive analysis of the global connected car market. Visiongain assesses that...
Full DetailsPublished: 03 December 2018 -

Advanced Truck Technologies Market Report 2019-2029
The latest report from business intelligence provider Visiongain offers comprehensive analysis of the global Advanced Truck Technologies Market. Visiongaain assesses...Full DetailsPublished: 04 March 2019 -

100 Connected Car Companies to Watch
The $36.4bn connected car market is expected to flourish in the next few years because of various regional mandates and...
Full DetailsPublished: 02 November 2018 -

Automotive Usage-Based Insurance (UBI) Market Report 2018-2028
The rising share of digital distribution of automotive insurance sales and arrival of connected cars, has led Visiongain to publish...
Full DetailsPublished: 11 May 2018 -

Automotive Vehicle to Everything (V2X) Communications Market 2018-2028
You will receive a highly granular market analysis segmented by region, by subsector and by end use, providing you with...Full DetailsPublished: 02 February 2018 -

Top 20 Automotive Advanced Driver Assistance Systems (ADAS) Companies 2018
Visiongain assesses that the automotive ADAS technologies market will reach $38.4bn in 2018. If you want to be part of...
Full DetailsPublished: 23 May 2018 -

Top 20 Connected Car Companies 2019
Visiongain calculates that the connected car market will reach $42.99bn in 2019. ...Full DetailsPublished: 20 November 2018 -

Top 20 Companies Developing Autonomous Vehicles (AV) Technologies 2018
This report independently evaluates the top 20 players developing autonomous vehicles technologies providing the reader with an objective overview of...Full DetailsPublished: 16 October 2018 -

Top 20 Autonomous Truck Companies 2018
The growth of the autonomous truck sector is largely dependent on demonstrating the potential benefits whilst mitigating the associated costs....Full DetailsPublished: 10 October 2018 -

Top 15 Connected Aircraft Companies 2018
The connected aircraft market is projected to grow substantially during the forecast period owing to the increasing number of air...
Full DetailsPublished: 17 April 2018
Download sample pages
Complete the form below to download your free sample pages for Connected Trucks Market Outlook Report 2018-2028
Do you have any custom requirements we can help you with?
Any specific country, geo region, market segment or specific company information?
Email us today, we can discuss your needs and see how we can help: jamie.roberts@visiongain.com
Would you like a free report overview of the report of your choice?
If so, please drop an email to Jamie Roberts stating your chosen report title to jamie.roberts@visiongain.com
Visiongain automotive reports are compiled using a broad and rich mixture of both primary and secondary information to produce an overall industry outlook. In order to provide our clients with the best product possible product, we do not rely on any one single source of information. Visiongain analysts reach out to market-leading vendors and automotive industry experts but also review a wealth of financial data and product information from a vast range of sources. To find out more about our reports methodology please email jamie.roberts@visiongain.com
Would you like to get the latest Visiongain automotive reports catalogue?
What are the dynamic growth sectors? where are the regional business opportunities?
Which technologies will prevail and who are the leading companies succeeding in these sectors and why?
If you want definitive answers to business critical questions, discover Visiongain’s full range of business intelligence reports.
If so, please email Jamie Roberts on jamie.roberts@visiongain.com or call her today on +44 207 336 6100
Alliance of Automobile Manufacturers (USA)
Association of Russian Automakers
Audio Video Bridging (AVB)
China Association Of Automoblie Manufacturers
European Association of Automotive Suppliers
European Automobile Manufacturers’ Association
European Council for Automotive Research and Development
Former Society of Automotive Engineers
German Association of the Automotive Industry
International Organization of Motor Vehicle Manufacturers
In-Vehicle Infotainment (IVI)
Italian Association of the Automotive Industry
Japan Automobile Manufacturers Association
One-Pair Ether-Net
Society of Indian Automobile Manufacturers (SIAM)
Society of Motor Manufacturers and Traders
The International Council For Clean Transport
US National Highway Traffic Safety Administration
Don’t Miss Out!
Subscribe to receive the latest Industry news, trending insight and analysis straight to your inbox.Choose your preferences:
Latest Automotive news
Hydrogen Vehicle Market
The global Hydrogen Vehicle market was valued at US$23.34 billion in 2023 and is projected to grow at a CAGR of 22.7% during the forecast period 2024-2034.
17 May 2024
Autonomous Vehicle Market
The global Autonomous Vehicle market was valued at US$35.4 billion in 2023 and is projected to grow at a CAGR of 22.7% during the forecast period 2024-2034.
16 May 2024
Automotive Infotainment Market
The global Automotive Infotainment market is estimated at US$20.2 billion in 2023 and is projected to grow at a CAGR of 6.3% during the forecast period 2024-2034.
14 May 2024
Automotive Cyber Security Market
The global Automotive Cyber Security market was valued at US$2,991.6 million in 2024 and is projected to grow at a CAGR of 19.4% during the forecast period 2024-2034.
13 May 2024
