Industries > Aviation > Top 15 Connected Aircraft Companies 2018

Top 15 Connected Aircraft Companies 2018
Contracts, Revenues & Market Share Analysis of Leading Companies with In-Flight Entertainment & Connectivity (IFEC) Technologies, The Internet of Things (IoT), e-Aircraft, In-Cabin Network Hardware, Air-To-Ground & Satellite Communications (SATCOM)
The connected aircraft market is projected to grow substantially during the forecast period owing to the increasing number of air passengers and a growing expectation for in-flight high-speed Internet connectivity by passengers. Connected aircraft systems provide in-flight entertainment to air passengers with the provision of high-quality audio, video, games, flight details, music, movies, radio, and news. They also assist in providing flight safety instructions in regional languages. Passengers can directly get connected to broadcast satellite and have access to international news and GPS maps; this is expected to drive the global the connected aircraft market.
This report evaluates in detail the top 15 companies operating within the $2.8bn connected aircraft market, with detailed evaluation of market shares, revenues and product specialisation.
Market Trends
• Increasing expectation of in-flight entertainment by customers
• Catering to the needs of “always connected” passengers
• Increasing “Bring your own device” trend amongst travellers
Quantitative Market Analysis
• Global connected aircraft market size
• Market share data for the 15 leading connected aircraft companies
• Revenues for the 15 leading connected aircraft companies
• Ranking for the 15 leading connected aircraft companies
Qualitative Analyses
• Analysis of drivers and restraints
• Examination of technological advances
• Consideration of regulation, policy and legal aspects
Details of over 600+ connected aircraft contracts, projects & programmes
Competitive landscape analysis: Market share data, revenues and ranking for the 15 leading connected aircraft companies
• BAE Systems plc
• Cobham plc
• Eutelsat Communications SA
• Global Eagle Entertainment Inc
• Gogo Inc
• Honeywell International Inc
• Inmarsat plc
• Iridium Communications Inc
• Kontron AG
• Panasonic Corporation
• Rockwell Collins Inc
• SITA OnAir
• Thales SA
• ViaSat Inc
• Zodiac Aerospace SA
Visiongain is a trading partner with the US Federal Government
CCR Ref number: KD4R6
1 Report Overview
1.1 Top 15 Connected Aircraft Companies
1.2 Why You Should Read This Report
1.3 How This Report Delivers
1.4 Key Questions Answered by This Analytical Report Include:
1.5 Who is This Report For?
1.6 Methodology
1.6.1 Secondary Research
1.6.2 Market Share Sizing Methodology
1.7 Frequently Asked Questions (FAQ)
1.8 Associated Visiongain Reports
1.9 About Visiongain
2 Introduction to the Connected Aircraft Market
2.1 Leading Connected Aircraft Companies
2.2 Connected Aircraft Market Definition
2.2.1 Innovation Landscape
2.2.2 Effective passenger management
2.2.3 Flight Delay Computation
2.2.4 Laser- enabled Explosive Detection
2.2.5 Explosive Detection
2.2.6 Facial Recognition Technology
2.2.7 Screening of Diseased Passengers
2.2.8 Facial Recognition Software
2.2.9 Authentication with Brainwaves
2.2.10 Terahertz Quantum Cascade Laser
2.2.11 Pyrometric Explosive Detection
2.2.12 QCL screening
2.2.13 Optical Sensing
2.2.14 Nano-sized sensors
3 Competitor Positioning in the Connected Aircraft Market
3.1 Top 15 Companies in the Connected Aircraft Market
3.2 Composition of the Connected Aircraft Market
3.2.1 Connected Aircraft Market Composition Overview
3.2.2 Composition of the Connected Aircraft Market
3.2.3 Leading Connected Aircraft Companies by Regional Distribution
3.2.4 Global Connected Aircraft Market Drivers & Restraints 2018
3.2.5 Market Drivers for Leading Connected Aircraft Companies
3.2.6 Market Challenges for Leading Connected Aircraft Companies
3.2.7 Market Trends for Leading Connected Aircraft Companies
4 Top 15 Connected Aircraft Companies
4.1 SITA OnAir
4.1.1 SITA OnAir Connected Aircraft Market Selected Recent Contracts / Projects / Programmes 2012-2018
4.1.2 SITA OnAir Airline Regional Emphasis / Focus
4.1.3 SITA OnAir Organisational Structure / Partners
4.1.4 SITA OnAir Connected Aircraft Market Products / Services
4.1.5 SITA OnAir Primary Market Competitors 2018
4.1.6 SITA Mergers & Acquisitions (M&A) Activity
4.1.7 SITA OnAir Overview
4.1.8 SITA OnAir Provides Comprehensive Passenger In-Flight Connectivity
4.1.9 SITA OnAir Future Outlook
4.1.10 SITA OnAir SWOT Analysis
4.2 Thales SA
4.2.1 Thales SA Connected Aircraft Market Selected Recent Contracts / Projects / Programmes 2012-2018
4.2.2 Thales SA Total Company Sales 2013-2017
4.2.3 Thales SA Net Income / Loss 2013-2017
4.2.4 Thales SA Net Capital Expenditure 2013-2017
4.2.5 Thales SA Sales by Segment of Business 2013-2017
4.2.6 Thales SA Regional Emphasis / Focus
4.2.7 Thales SA Organisational Structure / Subsidiaries / Number of Employees
4.2.8 Thales SA Connected Aircraft Market Products / Services
4.2.9 Thales SA Primary Market Competitors 2017
4.2.10 Thales SA Mergers & Acquisitions (M&A) Activity
4.2.11 Thales SA Overview
4.2.12 Financial Performance of Thales SA
4.2.13 Thales SA and Connected Aircraft
4.2.14 Thales SA Future Outlook
4.2.15 Thales SA SWOT Analysis
4.3 Global Eagle Entertainment Inc
4.3.1 Global Eagle Entertainment Inc Connected Aircraft Market Selected Recent Contracts / Projects / Programmes 2013-2018
4.3.2 Global Eagle Entertainment Inc Total Company Sales 2012-2016
4.3.3 Global Eagle Entertainment Inc Net Loss 2012-2016
4.3.4 Global Eagle Entertainment Inc Sales by Segment of Business 2013-2016
4.3.5 Global Eagle Entertainment Inc Regional Emphasis / Focus
4.3.6 Global Eagle Entertainment Inc Organisational Structure / Subsidiaries
4.3.7 Global Eagle Entertainment Inc Connected Aircraft Market Products / Services
4.3.8 Global Eagle Entertainment Inc Primary Market Competitors 2018
4.3.9 Global Eagle Entertainment Inc Mergers & Acquisitions (M&A) Activity
4.3.10 Global Eagle Entertainment Inc Overview
4.3.11 Financial Performance of Global Eagle Entertainment Inc
4.3.12 A Leading Player in In-Flight Entertainment, Content Connectivity and Digital Media
4.3.13 Global Eagle Entertainment Inc Future Outlook
4.3.14 Global Eagle Entertainment Inc SWOT Analysis
4.4 Cobham plc
4.4.1 Cobham plc Connected Aircraft Market Selected Recent Contracts / Projects / Programmes 2013-2018
4.4.2 Cobham plc Net Income 2013-2017
4.4.3 Cobham plc Net Capital Expenditure 2013-2017
4.4.4 Cobham plc Sales by Segment of Business 2013-2017
4.4.5 Cobham plc Regional Emphasis / Focus
4.4.6 Cobham plc Organisational Structure / Subsidiaries / Number of Employees
4.4.7 Cobham plc Connected Aircraft Market Products / Services
4.4.8 Cobham plc Primary Market Competitors 2018
4.4.9 Cobham plc Mergers & Acquisitions (M&A) Activity
4.4.10 Cobham plc Overview
4.4.11 Financial Performance of Cobham plc
4.4.12 Partnership with Inmarsat in the Delivery of In-Flight Connectivity
4.4.13 Cobham plc Future Outlook
4.4.14 Cobham plc SWOT Analysis
4.5 Panasonic Corporation
4.5.1 Panasonic Avionics Corporation Connected Aircraft Market Selected Recent Contracts / Projects / Programmes 2012-2018
4.5.2 Aeromobile Communications Ltd Connected Aircraft Market Selected Recent Contracts / Projects / Programmes
4.5.3 Panasonic Corporation Total Company Sales 2013-2017
4.5.4 Panasonic Corporation Net Income / Loss 2013-2017
4.5.5 Panasonic Corporation Net Capital Expenditure 2013-2017
4.5.6 Panasonic Corporation Sales by Segment of Business 2013-2017
4.5.7 Panasonic Corporation Regional Sales
4.5.8 Panasonic Corporation Organisational Structure / Subsidiaries /Number of Employees
4.5.9 Panasonic Avionics Connected Aircraft Market Products / Services
4.5.10 Panasonic Corporation Primary Market Competitors 2017
4.5.11 Panasonic Corporation Mergers& Acquisitions (M&A) Activity
4.5.12 Panasonic Corporation Overview
4.5.13 Financial Performance of Panasonic Corporation
4.5.14 Panasonic Avionics is a World Leader in IFEC Solutions for Commercial Aircraft
4.5.15 Panasonic Corporation Future Outlook
4.6 Honeywell International Inc
4.6.1 Honeywell International Inc Connected Aircraft Market Selected Recent Contracts / Projects / Programmes 2010-2018
4.6.2 Honeywell International Inc Total Company Sales 2013-2017
4.6.3 Honeywell International Inc Net Income 2013-2017
4.6.4 Honeywell International Inc Net Capital Expenditure 2013-2017
4.6.5 Honeywell International Inc Sales by Segment of Business 2013-2017
4.6.6 Honeywell International Inc Regional Emphasis / Focus
4.6.7 Honeywell International Inc Organisational Structure / Subsidiaries / Number of Employees
4.6.8 Honeywell International Inc Connected Aircraft Market Products / Services
4.6.9 Honeywell International Inc Primary Market Competitors 2017
4.6.10 Honeywell International Inc Mergers & Acquisitions (M&A) Activity
4.6.11 Honeywell International Inc Overview
4.6.12 Financial Performance of Honeywell International Inc
4.6.13 Aircraft Connectivity for the Business Jet Sector
4.6.14 Honeywell International Inc Future Outlook
4.6.15 Honeywell International Inc SWOT Analysis
4.7 Gogo Inc
4.7.1 Gogo Inc Connected Aircraft Market Selected Recent Contracts / Projects / Programmes 2012-2018
4.7.2 Gogo Inc Total Company Sales 2013-2017
4.7.3 Gogo Inc Net Income / Loss 2013-2017
4.7.4 Gogo Inc Net Capital Expenditure 2013-2017
4.7.5 Gogo Inc Sales by Segment of Business 2013-2017
4.7.6 Gogo Inc Regional Emphasis / Focus
4.7.7 Gogo Inc Organisational Structure / Subsidiaries / Number of Employees
4.7.8 Gogo Inc Connected Aircraft Market Products / Services
4.7.9 Gogo Inc Primary Market Competitors 2017
4.7.10 Gogo Inc Overview
4.7.11 Financial Performance of Gogo Inc
4.7.12 A Broad Array of Connectivity Solutions for Commercial and Business Aviation
4.7.13 Gogo Inc Future Outlook
4.7.14 Gogo Inc SWOT Analysis
4.8 Inmarsat plc
4.8.1 Inmarsat plc Connected Aircraft Market Selected Recent Contracts / Projects / Programmes 2012-2018
4.8.2 Inmarsat plc Total Company Sales 2013-2017
4.8.3 Inmarsat plc Net Income 2013-2017
4.8.4 Inmarsat plc Net Capital Expenditure 2013-2017
4.8.5 Inmarsat plc Sales by Segment of Business 2014-2017
4.8.6 Inmarsat plc Regional Emphasis / Focus
4.8.7 Inmarsat plc Organisational Structure / Subsidiaries / Number of Employees
4.8.8 Inmarsat plc Connected Aircraft Market Products / Services
4.8.9 Inmarsat plc Primary Market Competitors 2017
4.8.10 Inmarsat plc Mergers & Acquisitions (M&A) Activity
4.8.11 Inmarsat plc Overview
4.8.12 Financial Performance of Inmarsat plc
4.8.13 Inmarsat plc Future Outlook
4.8.14 Inmarsat plc SWOT Analysis
4.9 Rockwell Collins Inc
4.9.1 Rockwell Collins Connected Aircraft Market Selected Recent Contracts / Projects / Programmes 2012-2018
4.9.2 Rockwell Collins Inc Total Company Sales 2013-2017
4.9.3 Rockwell Collins Inc Sales in the Connected Aircraft Market 2013-2017
4.9.4 Rockwell Collins Inc Net Income 2013-2017
4.9.5 Rockwell Collins Inc Net Capital Expenditure 2013-2017
4.9.6 Rockwell Collins Inc Sales by Segment of Business 2013-2017
4.9.7 Rockwell Collins Inc Regional Emphasis / Focus
4.9.8 Rockwell Collins Inc Organisational Structure / Subsidiaries / Number of Employees
4.9.9 Rockwell Collins Inc Connected Aircraft Market Products / Services
4.9.10 Rockwell Collins Inc Primary Market Competitors 2017
4.9.11 Rockwell Collins Inc Mergers & Acquisitions (M&A) Activity
4.9.12 Rockwell Collins Inc Overview
4.9.13 Rockwell Collins Acquired B/E Aerospace
4.9.14 Financial Performance of Rockwell Collins Inc
4.9.15 Rockwell Collins Inc and Aircraft Connectivity
4.9.16 Rockwell Collins Inc Future Outlook
4.9.17 Rockwell Collins Inc SWOT Analysis
4.10 Kontron AG
4.10.1 Kontron AG Connected Aircraft Market Selected Recent Contracts / Projects / Programmes 2011-2018
4.10.2 Kontron AG Total Company Sales 2012-2016
4.10.3 Kontron AG Net Income / Loss 2012-2016
4.10.4 Kontron AG Sales by Segment of Business 2016
4.10.5 Kontron AG Organisational Structure / Subsidiaries / Number of Employees
4.10.6 Kontron AG Connected Aircraft Market Products / Services
4.10.7 Kontron AG Primary Market Competitors 2018
4.10.8 Kontron AG Divestitures Activity
4.10.9 Kontron AG and S&T Group Merger
4.10.10 Kontron AG Overview
4.10.11 Financial Performance of Kontron AG
4.10.12 Developing the Next Generation of IFEC
4.10.13 Kontron AG Future Outlook
4.10.14 Kontron AG SWOT Analysis
4.11 Zodiac Aerospace SA
4.11.1 Zodiac Aerospace Connected Aircraft Market Selected Recent Contracts / Projects / Programmes 2012-2018
4.11.2 Zodiac Aerospace SA Total Company Sales 2013-2017
4.11.3 Zodiac Aerospace SA Net Income 2013-2017
4.11.4 Zodiac Aerospace SA Sales by Segment of Business 2013-2017
4.11.5 Zodiac Aerospace Regional Emphasis / Focus
4.11.6 Zodiac Aerospace SA Organisational Structure / Subsidiaries / Number of Employees
4.11.7 Zodiac Aerospace SA Connected Aircraft Market Products / Services
4.11.8 Zodiac Aerospace SA Primary Market Competitors 2017
4.11.9 Zodiac Aerospace SA Mergers & Acquisitions (M&A) Activity
4.11.10 Zodiac Aerospace SA Overview
4.11.11 Financial Performance of Zodiac Aerospace SA
4.11.12 An Expanding Presence in Aircraft Connectivity and Strong Ties with Airbus
4.11.13 Zodiac Aerospace SA Future Outlook
4.11.14 Zodiac Aerospace SA SWOT Analysis
4.12 ViaSat Inc
4.12.1 ViaSat Inc Connected Aircraft Market Selected Recent Contracts / Projects / Programmes 2010-2018
4.12.2 ViaSat Inc Total Company Sales 2013-2017
4.12.3 ViaSat Inc Net Income / Loss 2013-2017
4.12.4 ViaSat Inc Net Capital Expenditure 2013-2017
4.12.5 ViaSat Inc Sales by Segment of Business 2013-2017
4.12.6 ViaSat Inc Regional Emphasis / Focus
4.12.7 ViaSat Inc Organisational Structure / Subsidiaries
4.12.8 ViaSat Inc Connected Aircraft Market Products / Services
4.12.9 ViaSat Inc Primary Market Competitors 2017
4.12.10 ViaSat Inc Mergers & Acquisitions (M&A) Activity
4.12.11 ViaSat Inc Overview
4.12.12 Financial Performance of ViaSat Inc
4.12.13 Enabling Commercial and Business Aviation In-Flight Connectivity
4.12.14 ViaSat Inc Future Outlook
4.12.15 ViaSat Inc SWOT Analysis
4.13 Eutelsat Communications SA
4.13.1 Eutelsat Communications SA Connected Aircraft Market Selected Recent Contracts / Projects / Programmes 2013-2018
4.13.2 Eutelsat Communications SA Total Company Sales 2012-2017
4.13.3 Eutelsat Communications Net Income SA 2012-2017
4.13.4 Eutelsat Communications SA Regional Emphasis / Focus
4.13.5 Eutelsat Communications SA Organisational Structure / Subsidiaries / Number of Employees
4.13.6 Eutelsat Communications SA Connected Aircraft Market Products / Services
4.13.7 Eutelsat Communications SA Primary Market Competitors 2017
4.13.8 Eutelsat Communications SA Mergers & Acquisitions (M&A) Activity
4.13.9 Eutelsat Communications SA Overview
4.13.10 Eutelsat Communications and Aeronautical Connectivity
4.13.11 Eutelsat Communications SA Future Outlook
4.13.12 Eutelsat Communications SA SWOT Analysis
4.14 Iridium Communications Inc
4.14.1 Iridium Communications Inc Connected Aircraft Market Selected Recent Contracts / Projects / Programmes 2013-2018
4.14.2 Iridium Communications Inc Total Company Sales 2013-2017
4.14.3 Iridium Communications Inc Net Income 2013-2017
4.14.4 Iridium Communications Inc Net Capital Expenditure 2013-2017
4.14.5 Iridium Communications Inc Sales by Segment of Business 2013-2017
4.14.6 Iridium Communications Inc Regional Emphasis / Focus
4.14.7 Iridium Communications Inc Organisational Structure / Subsidiaries
4.14.8 Iridium Communications Inc Connected Aircraft Market Products / Services
4.14.9 Iridium Communications Inc Primary Market Competitors 2017
4.14.10 Iridium Communications Inc Overview
4.14.11 Iridium Communications Inc Financial Performance
4.14.12 Growing Opportunities for Air Passenger Communications Services
4.14.13 Iridium Communications Inc Future Outlook
4.14.14 Iridium Communications Inc SWOT Analysis
4.15 BAE Systems plc
4.15.1 BAE Systems plc Connected Aircraft Market Selected Recent Contracts / Projects / Programmes 2013-2018
4.15.2 BAE Systems plc Total Company Sales 2013-2017
4.15.3 BAE Systems plc Net Income 2013-2017
4.15.4 BAE Systems plc Net Capital Expenditure 2013-2017
4.15.5 BAE Systems plc Sales by Segment of Business 2013-2017
4.15.6 BAE Systems plc Regional Emphasis / Focus
4.15.7 BAE Systems plc Connected Aircraft Market Products / Services
4.15.8 BAE Systems plc Primary Market Competitors 2017
4.15.9 BAE Systems plc Mergers & Acquisitions (M&A) Activity
4.15.10 BAE Systems plc Overview
4.15.11 Financial Performance of BAE Systems plc
4.15.12 A New Player in the Connected Aircraft Market?
4.15.13 BAE Systems plc Future Outlook
4.15.14 BAE Systems plc SWOT Analysis
5 Conclusion
5.1 Global Connected Car Market 2017
5.2 Market Drivers and Challenges in the Connected Aircraft Market 2017
5.3 Leading 15 Companies Ranking in the Connected Aircraft Market 2017
6 Glossary
List of Tables
Table 1.1 Sample Company Sales by Geographic Region 2013-2017 (US$m, AGR %)
Table 3.1 Top 15 Connected Aircraft Market Companies Sales Share 2017 (Ranking, Company, FY2017 Total Company Sales US$m, FY2017 Sales in the Connected Aircraft Market US$m, % of Connected Aircraft Sales from Total Company 2017 Sales, Connected Aircraft Market Share 2017%)
Table 3.2 Connected Aircraft Technologies of the Leading 15 Companies in the Connected Aircraft Market 2017 (Company, Connected Aircraft Technologies)
Table 3.3 Global Connected Aircraft Market Drivers & Restraints 2018
Table 4.1 SITA OnAir Profile 2016 (Connected Aircraft Market Ranking, Connected Aircraft Market Share %, CEO, Parent Company Sales US$m, Sales in the Market US$m, Share of Company Sales from the Market %, Business Segment in the Market, HQ, Founded, No. of Employees, IR Contact, Ticker, Website)
Table 4.2 Selected Recent SITA OnAir Connected Aircraft Market Contracts / Projects / Programmes 2012-2018 (Date, Country / Region, Subcontractor, Value US$m, Product, Details)
Table 4.3 SITA OnAir Partners 2017 (Partner, Location)
Table 4.4 SITA OnAir Connected Aircraft Market Products / Services (Segment of Business, Product, Specification / Features)
Table 4.5 SITA Mergers and Acquisitions 2015 (Date, Company Involved, Details)
Table 4.6 SITA OnAir SWOT Analysis 2018
Table 4.7 Thales SA Profile 2017 (Connected Aircraft Market Ranking, Connected Aircraft Market Share %, CEO, Total Company Sales US$m, Sales in the Connected Aircraft Market US$m, Share of Company Sales from the Connected Aircraft Market %, Net Income US$m, Net Capital Expenditure US$m, Strongest Business Region, Business Segment in the Market, HQ, Founded, No. of Employees, IR Contact, Ticker, Website)
Table 4.8 Thales SA Total Company Sales 2013-2017 (US$m, AGR %)
Table 4.9 Thales SA Net Income / Loss 2013-2017 (US$m, AGR %)
Table 4.10 Thales SA Net Capital Expenditure 2013-2017 (US$m, AGR %)
Table 4.11 Thales SA Sales by Segment of Business 2013-2017 (US$m, AGR %)
Table 4.12 Thales SA Sales by Geographical Location 2014-2017 (US$m, AGR %)
Table 4.13 Thales SA Select Subsidiaries 2017 (Subsidiary, Location)
Table 4.14 Thales SA Number of Employees 2013-2017 (No. of Employees, AGR %)
Table 4.15 Thales SA Connected Aircraft Market Products / Services (Segment of Business, Product, Specification / Features)
Table 4.16 Thales SA Mergers and Acquisitions 2017 (Date, Company Involved, Value US$m, Details)
Table 4.17 Thales SA SWOT Analysis 2017
Table 4.18 Global Eagle Entertainment Inc Profile 2017 ( FY 2016 Financial Information) (Connected Aircraft Market Ranking, Connected Aircraft Market Share %, CEO, Total Company Sales US$m, Sales in the Connected Aircraft Market US$m, Share of Company Sales from the Connected Aircraft Market %, Net Loss US$m, Strongest Business Region, Business Segment in the Market, HQ, Founded, No. of Employees, IR Contact, Ticker, Website)
Table 4.19 Selected Recent Global Eagle Entertainment Connected Aircraft Market Contracts / Projects / Programmes 2013-2017 (Date, Country / Region, Subcontractor, Product, Details)
Table 4.20 Global Eagle Entertainment Inc Total Company Sales 2012-2016 (US$m, AGR %)
Table 4.21 Global Eagle Entertainment Inc Sales in the Connectivity Market 2013-2016 (US$m, AGR %)
Table 4.22 Global Eagle Entertainment Inc Net Loss 2012-2016 (US$m)
Table 4.23 Global Eagle Entertainment Inc Sales by Segment of Business 2013-2016 (US$m, AGR %)
Table 4.24 Global Eagle Entertainment Inc Sales by Geographical Location 2012-2016 (US$m, AGR %)
Table 4.25 Global Eagle Entertainment Inc Subsidiaries 2017 (Subsidiary, Location)
Table 4.26 Global Eagle Entertainment Inc Connected Aircraft Market Products / Services (Segment of Business, Product, Specification / Features)
Table 4.27 Global Eagle Entertainment Inc Mergers and Acquisitions 2015-2016 (Date, Company Involved, Value US$m, Details)
Table 4.28 Global Eagle Entertainment Inc SWOT Analysis 2018
Table 4.29 Cobham plc Profile 2017 (Connected Aircraft Market Ranking, Connected Aircraft Market Share, CEO, Total Company Sales US$m, Sales in the Connected Aircraft Market US$m, Share of Company Sales from the Connected Aircraft Market %, Net Loss FY2016 US$m, Net Capital Expenditure FY2014US$m, Strongest Business Region, Business Segment in the Market, HQ, Founded, No. of Employees, IR Contact, Ticker, Website)
Table 4.30 Selected Recent Cobham plc Connected Aircraft Contracts / Projects / Programmes 2013-2017 (Date, Country / Region, Subcontractor, Value US$m, Product, Details)
Table 4.31 Cobham plc Total Company Sales 2013-2017 (US$m, AGR %)
Table 4.32 Cobham plc Net Income 2013-2017 (US$m, AGR %)
Table 4.33 Cobham plc Net Capital Expenditure 2013-2017 (US$m, AGR %)
Table 4.34 Cobham plc Sales by Segment of Business 2013-2017 (US$m, AGR %)
Table 4.35 Cobham plc Sales by Geographical Location 2013-2017 (US$m, AGR %)
Table 4.36 Cobham plc Organisational Structure 2017
Table 4.37 Cobham plc Select Subsidiaries 2017 (Subsidiary, Location)
Table 4.38 Cobham plc Number of Employees 2013-2017 (No. of Employees, AGR %)
Table 4.39 Cobham plc Connected Aircraft Market Products / Services (Segment of Business, Product, Specification / Features)
Table 4.40 Cobham plc Mergers and Acquisitions 2014 (Date, Company Involved, Value US$m, Details)
Table 4.41 Cobham plc Divestitures 2014 - 2017 (Date, Company Involved, Value US$m, Details)
Table 4.42 Cobham plc SWOT Analysis 2018
Table 4.43 Panasonic Corporation Profile 2017 (Connected Aircraft Market Ranking, Connected Aircraft Market Share %,President, Total Company Sales US$m, Sales in the Connected Aircraft Market US$m, Share of Company Sales from the Connected Aircraft Market %, Net Income US$m, Net Capital Expenditure US$m, Strongest Business Region, Business Segment in the Market, HQ, Founded, No. of Employees, IR Contact, Ticker, Website)
Table 4.44 Selected Recent Panasonic Corporation Connected Aircraft Market Contracts / Projects / Programmes 2011-2015 (Date, Country / Region, Subcontractor, Value US$m, Product, Details)
Table 4.45 Selected Recent Aeromobile Communications Ltd Connected Aircraft Market Contracts / Projects / Programmes 2012-2016 (Date, Country / Region, Subcontractor, Value US$m, Product, Details)
Table 4.46 Panasonic Corporation Total Company Sales 2013-2017 (US$m, AGR %)
Table 4.47 Panasonic Corporation Net Income / Loss 2013-2017 (US$m)
Table 4.48 Panasonic Corporation Net Capital Expenditure 2013-2017 (US$m, AGR %)
Table 4.49 Panasonic Corporation Sales by Segment of Business 2013-2017 (US$m, AGR %)
Table 4.50 Panasonic Corporation Sales by Geographical Location 2013-2017 (US$m, AGR%)
Table 4.51 Panasonic Corporation Select Subsidiaries 2017 (Subsidiary, Location)
Table 4.52 Panasonic Corporation Number of Employees 2013-2017 (No. of Employees, AGR %)
Table 4.53 Panasonic Avionics Connected Aircraft Market Products / Services (Segment of Business, Product, Specification / Features)
Table 4.54 Panasonic Corporation Mergers and Acquisitions 2015-2017 (Date, Company Involved, Value US$m, Details)
Table 4.55 Honeywell International Inc Profile 2017 (Connected Aircraft Market Ranking, Connected Aircraft Market Share %, CEO, Total Company Sales US$m, Sales in the Connected Aircraft Market US$m, Share of Company Sales from the Connected Aircraft Market %, Net Income US$m, Net Capital Expenditure US$m, Strongest Business Region, Business Segment in the Market, HQ, Founded, No. of Employees, IR Contact, Ticker, Website)
Table 4.56 Selected Recent Honeywell International Inc Connected Aircraft Market Contracts / Projects / Programmes 2010-2017 (Date, Country / Region, Subcontractor, Value US$m, Product, Details)
Table 4.57 Honeywell International Inc Total Company Sales 2013-2017 (US$m, AGR %)
Table 4.58 Honeywell International Inc Net Income 2013-2017 (US$m, AGR %)
Table 4.59 Honeywell International Inc Net Capital Expenditure 2013-2017 (US$m, AGR %)
Table 4.60 Honeywell International Inc Sales by Segment of Business 2013-2017 (US$m, AGR %)
Table 4.61 Honeywell International Inc Sales by Geographical Location 2013-2017 (US$m, AGR%)
Table 4.62 Honeywell International Inc Select Subsidiaries 2017 (Subsidiary, Location)
Table 4.63 Honeywell International Inc Number of Employees 2013-2017 (No. of Employees, AGR %)
Table 4.64 Honeywell International Inc Connected Aircraft Market Products / Services (Segment of Business, Product, Specification / Features)
Table 4.65 Honeywell International Inc Mergers and Acquisitions 2015 (Date, Company Involved, Value US$m, Details)
Table 4.66 Honeywell International Inc Divestitures (Date, Company Involved, Value US$m, Details)
Table 4.67 Honeywell International Inc SWOT Analysis 2018
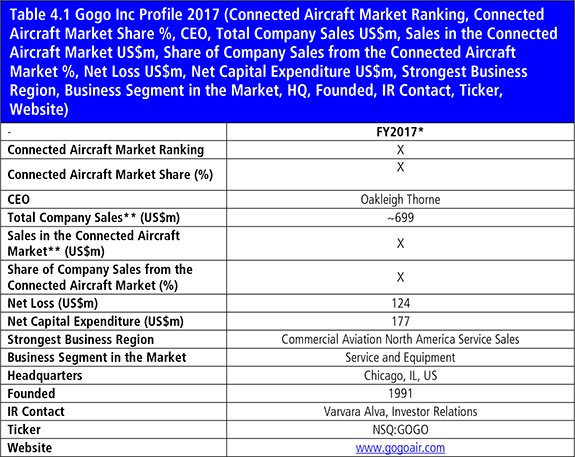
Table 4.68 Gogo Inc Profile 2017 (Connected Aircraft Market Ranking, Connected Aircraft Market Share %, CEO, Total Company Sales US$m, Sales in the Connected Aircraft Market US$m, Share of Company Sales from the Connected Aircraft Market %, Net Loss US$m, Net Capital Expenditure US$m, Strongest Business Region, Business Segment in the Market, HQ, Founded, IR Contact, Ticker, Website)
Table 4.69 Selected Recent Gogo Inc Connected Aircraft Market Contracts / Projects / Programmes 2012-2017 (Date, Country / Region, Subcontractor, Value US$m, Product, Details)
Table 4.70 Gogo Inc Total Company Sales 2013-2017 (US$m, AGR %)
Table 4.71 Gogo Inc Net Income / Loss 2013-2017 (US$m)
Table 4.72 Gogo Inc Net Capital Expenditure 2013-2017 (US$m, AGR %)
Table 4.73 Gogo Inc Sales by Segment of Business 2013-2017 (US$m, AGR %)
Table 4.74 Gogo Inc Sales by Geographical Location 2015-2017 (US$m, AGR %)
Table 4.75 Gogo Inc Subsidiaries 2017 (Subsidiary, Location)
Table 4.76 Gogo Inc Number of Employees 2015-2017 (No. of Employees)
Table 4.77 Gogo Inc Connected Aircraft Market Products / Services (Segment of Business, Product, Specification / Features)
Table 4.78 Gogo Inc SWOT Analysis 2018
Table 4.79 Inmarsat plc Profile 2017 (Connected Aircraft Market Ranking, Connected Aircraft Market Share %, CEO, Total Company Sales US$m, Sales in the Connected Aircraft Market US$m, Share of Total Company Sales from the Connected Aircraft Market %, Net Income US$m, Net Capital Expenditure US$m, Strongest Business Region, Business Segment in the Market, HQ, Founded, No. of Employees, IR Contact, Ticker, Website)
Table 4.80 Selected Recent Inmarsat plc Connected Aircraft Market Contracts / Projects / Programmes 2012-2017 (Date, Country / Region, Subcontractor, Value US$m, Product, Details)
Table 4.81 Inmarsat plc Total Company Sales 2013-2017 (US$m, AGR %)
Table 4.82 Inmarsat plc Net Income 2013-2017 (US$m, AGR %)
Table 4.83 Inmarsat plc Net Capital Expenditure 2013-2017 (US$m, AGR %)
Table 4.84 Inmarsat plc Sales by Segment of Business 2014-2017 (US$m, AGR %)
Table 4.85 Inmarsat plc Sales by Geographical Location 2012-2016 (US$m, AGR %)
Table 4.86 Inmarsat plc Subsidiaries 2017 (Subsidiary, Location)
Table 4.87 Inmarsat plc Number of Employees 2013-2017 (No. of Employees, AGR %)
Table 4.88 Inmarsat plc Connected Aircraft Market Products / Services (Segment of Business, Product, Specification / Features)
Table 4.89 Inmarsat plc Mergers and Acquisitions 2014 (Date, Company Involved, Value US$m, Details)
Table 4.90 Inmarsat plc SWOT Analysis 2018
Table 4.91 Rockwell Collins Inc Profile 2016 (Connected Aircraft Market Ranking, Connected Aircraft Market Share %, CEO, Total Company Sales US$m, Sales in the Connected Aircraft Market US$m, Share of Company Sales from the Connected Aircraft Market %, Net Income US$m, Net Capital Expenditure US$m, Strongest Business Region, Business Segment in the Market, HQ, Founded, No. of Employees, IR Contact, Ticker, Website)
Table 4.92 Selected Recent Rockwell Collins Connected Aircraft Market Contracts / Projects / Programmes 2012-2018 (Date, Country / Region, Subcontractor, Product, Details)
Table 4.93 Rockwell Collins Inc Total Company Sales 2013-2017 (US$m, AGR %)
Table 4.94 Rockwell Collins Inc Sales in the Connected Aircraft Market 2013-2017 (US$m, AGR %)
Table 4.95 Rockwell Collins Inc Net Income 2013-2017 (US$m, AGR %)
Table 4.96 Rockwell Collins Inc Net Capital Expenditure 2013-2017 (US$m, AGR %)
Table 4.97 Rockwell Collins Inc Sales by Segment of Business 2013-2017 (US$m, AGR %)
Table 4.98 Rockwell Collins Inc Subsidiaries 2017 (Subsidiary, Location)
Table 4.99 Rockwell Collins Inc Number of Employees 2013-2017 (No. of Employees, AGR %)
Table 4.100 Rockwell Collins Inc Connected Aircraft Market Products / Services (Segment of Business, Product, Specification / Features)
Table 4.101 Rockwell Collins Inc Mergers and Acquisitions 2015 (Date, Company Involved, Value US$m, Details)
Table 4.102 Rockwell Collins Inc SWOT Analysis 2018
Table 4.103 Kontron AG Profile 2017 (Connected Aircraft Market Ranking, Connected Aircraft Market Share %,CEO, Total Company Sales US$m, Sales in the Connected Aircraft Market US$m, Share of Company Sales from the Connected Aircraft Market %, Net Loss US$m, Strongest Business Region, Business Segment in the Market, HQ, Founded, No. of Employees, IR Contact, Ticker, Website)
Table 4.104 Selected Recent Kontron AG Connected Aircraft Market Contracts / Projects / Programmes 2011-2017 (Date, Country / Region, Subcontractor, Product, Details)
Table 4.105 Kontron AG Total Company Sales 2012-2016 (US$m, AGR %)
Table 4.106 Kontron AG Net Income / Loss 2012-2016 (US$m)
Table 4.107 Kontron Sales by Segment of Business 2016 (Business Division, Sales US$m)
Table 4.108 Kontron AG Sales by Geographical Location 2014-2016 (US$m, AGR%)
Table 4.109 Kontron AG Subsidiaries 2017 (Subsidiary, Location)
Table 4.110 Kontron AG Number of Employees 2010-2014 (No. of Employees, AGR %)
Table 4.111 Kontron AG Connected Aircraft Market Products / Services (Segment of Business, Product, Specification / Features)
Table 4.112 Kontron AG Divestitures 2014 (Date, Company Involved, Value US$m, Details
Table 4.113 Kontron AG SWOT Analysis 2018
Table 4.114 Zodiac Aerospace SA Profile 2017 (Connected Aircraft Market Ranking, Connected Aircraft Market Share %, CEO, Total Company Sales US$m, Sales in the Connected Aircraft Market US$m, Share of Company Sales from the Connected Aircraft Market %, Net Income US$m, Strongest Business Region, Business Segment in the Market, HQ, Founded, No. of Employees, IR Contact, Ticker, Website)
Table 4.115 Zodiac Aerospace SA Number of Employees 2013-2017 (No. of Employees, AGR %)
Table 4.116 Zodiac Aerospace SA Connected Aircraft Market Products / Services (Segment of Business, Product, Specification / Features)
Table 4.117 Zodiac Aerospace SA Mergers and Acquisitions 2013-2017 (Date, Company Involved, Value US$m, Details)
Table 4.118 Zodiac Aerospace SA SWOT Analysis 2018
Table 4.119 ViaSat Inc Profile 2017 (Connected Aircraft Market Ranking, Connected Aircraft Market Share %, CEO, Total Company Sales US$m, Sales in the Connected Aircraft Market US$m, Share of Company Sales from the Market %, Net Income US$m, Net Capital Expenditure US$m, Strongest Business Region, Business Segment in the Market, Submarket Involvement, HQ, Founded, No. of Employees, IR Contact, Ticker, Website)
Table 4.120 Selected Recent ViaSat Inc Connected Aircraft Market Contracts / Projects / Programmes 2010-2017 (Date, Country / Region, Subcontractor, Value US$m, Product, Details)
Table 4.121 ViaSat Inc Total Company Sales 2013-2017 (US$m, AGR %)
Table 4.122 ViaSat Inc Net Income / Loss 2013-2017 (US$m)
Table 4.123 ViaSat Inc Net Capital Expenditure 2013-2017 (US$m, AGR %)
Table 4.124 ViaSat Inc Sales by Segment of Business 2013-2017 (US$m, AGR %)
Table 4.125 ViaSat Inc Select Subsidiaries 2017 (Subsidiary, Location)
Table 4.126 ViaSat Inc Connected Aircraft Market Products / Services (Segment of Business, Product, Specification / Features)
Table 4.127 ViaSat Inc Mergers and Acquisitions 2015-2016 (Date, Company Involved, Details)
Table 4.128 Eutelsat Communications SA Profile 2017 (Connected Aircraft Market Ranking, Connected Aircraft Market Share %, CEO, Total Company Sales US$m, Sales in the Connected Aircraft Market US$m, Share of Company Sales from the Connected Aircraft Market %, Net Income US$m, Strongest Business Region, Business Segment in the Market, HQ, Founded, No. of Employees, IR Contact, Ticker, Website)
Table 4.129 Selected Recent Eutelsat Communications SA Connected Aircraft Market Contracts / Projects / Programmes 2013-2017 (Date, Country / Region, Subcontractor, Product, Details)
Table 4.130 Eutelsat Communications SA Total Company Sales 2012-2017 (US$m, AGR %)
Table 4.131 Eutelsat Communications SA Net Income 2012-2017 (US$m, AGR %)
Table 4.132 Eutelsat Communications SA Sales by Geographical Location 2012-2017 (US$m, AGR %)
Table 4.133 Eutelsat Communications SA Subsidiaries 2017 (Subsidiary, Location)
Table 4.134 Eutelsat Communications SA Number of Employees 2012-2017 (No. of Employees, AGR %)
Table 4.135 Eutelsat Communications SA Connected Aircraft Market Products / Services (Segment of Business, Product, Specification / Features)
Table 4.136 Eutelsat Communications SA Mergers and Acquisitions 2014-17 (Date, Company Involved, Value US$m, Details)
Table 4.137 Eutelsat Communications SA Divestitures 2014-2017 (Date, Company Involved, Value US$m, Details)
Table 4.138 Eutelsat Communications SASWOT Analysis 2018
Table 4.139 Iridium Communications Inc Profile 2017 (Connected Aircraft Market Ranking, Connected Aircraft Market Share %, CEO, Total Company Sales US$m, Sales in the Connected Aircraft Market US$m, Share of Company Sales from the Connected Aircraft Market %, Net Income US$m, Net Capital Expenditure US$m, Strongest Business Region, Business Segment in the Market, HQ, Founded, No. of Employees, IR Contact, Ticker, Website)
Table 4.140 Selected Recent Iridium Communications Inc Connected Aircraft Market Contracts / Projects / Programmes 2013-2017 (Date, Country / Region, Subcontractor, Value US$m, Product, Details)
Table 4.141 Iridium Communications Inc Total Company Sales 2013-2017 (US$m, AGR %)
Table 4.142 Iridium Communications Inc Net Income 2013-2017 (US$m, AGR %) 433
Table 4.143 Iridium Communications Inc Net Capital Expenditure 2013-2017 (US$m, AGR %)
Table 4.144 Iridium Communications Inc Sales by Segment of Business 2013-2017 (US$m, AGR %)
Table 4.145 Iridium Communications Inc Sales by Geographical Location 2013-2017 (US$m, AGR %)
Table 4.146 Iridium Communications Inc Subsidiaries 2017 (Subsidiary, Location)
Table 4.147 Iridium Communications Inc Connected Aircraft Market Products / Services (Segment of Business, Product, Specification / Features)
Table 4.148 Iridium Communications Inc SWOT Analysis 2018
Table 4.149 BAE Systems plc Profile 2017 (Connected Aircraft Market Ranking, Connected Aircraft Market Share %, CEO, Total Company Sales US$m, Sales in the Connected Aircraft Market US$m, Share of Company Sales from the Connected Aircraft Market %, Net Income US$m, Net Capital Expenditure US$m, Strongest Business Region, Business Segment in the Market, HQ, Founded, No. of Employees, IR Contact, Ticker, Website)
Table 4.150 Selected Recent BAE Systems plc Connected Aircraft Market Contracts / Projects / Programmes 2013-2016 (Date, Country / Region, Subcontractor, Product, Details)
Table 4.151 BAE Systems plc Total Company Sales 2013-2017 (US$m, AGR %)
Table 4.152 BAE Systems plc Net Income 2013-2017 (US$m, AGR %)
Table 4.153 BAE Systems plc Net Capital Expenditure 2013-2017 (US$m, AGR %)
Table 4.154 BAE Systems plc Sales by Segment of Business 2013-2017 (US$m, AGR %)
Table 4.155 BAE Systems plc Sales by Geographical Location 2013-2017 (US$m, AGR %)
Table 4.156 BAE Systems plc Subsidiaries 2017 (Subsidiary, Location)
Table 4.157 BAE Systems plc Number of Employees 2013-2017 (No. of Employees, AGR %)
Table 4.158 BAE Systems plc Connected Aircraft Market Products / Services (Segment of Business, Product, Specification / Features)
Table 4.159 BAE Systems plc Mergers and Acquisitions 2014 – 2017 (Date, Company Involved, Value US$m, Details)
Table 4.160 BAE Systems plc Divestitures 2015 (Date, Company Involved, Details)
Table 4.161 BAE Systems plc SWOT Analysis 2018
Table 5.1 Global Connected Aircraft Market Drivers and Challenges
Table 5.2 Ranking of the Leading 15 Connected Aircraft Companies 2017 (%)
Table of Figures
Figure 1.1 Sample Map of Company Regional Focus 2018
Figure 1.2 Sample of Company Sales by Business Sector (Sales US$m, Total Company Sales AGR %)
Figure 2.1 Leading 15 Connected Aircraft Market Companies 2018
Figure 3.1 Top 15 Companies in the Connected Aircraft Market 2017 (% Share)
Figure 3.2 Top 15 Companies in the Connected Aircraft Market 2017 (Company, Sales US$m)
Figure 3.3 Top 15 Companies in the Connected Aircraft Market 2017 (Company, Market Share %
Figure 3.4 Share of the Top 15 Connected Aircraft Market Companies by the Top 1-3 Vs. Top 4-15 vs. Other Companies
Figure 3.5 Sales of the Leading 6 Vs. the Next 9 Companies in the Connected Aircraft Market (Company Ranking, Sales US$m)
Figure 3.6 Leading 15 Companies in the Connected Aircraft Market 2017 by Headquarter Location (Number of Companies)
Figure 4.1 SITA OnAir Primary International Operations 2017
Figure 4.2 SITA OnAir Organisational Structure 2017
Figure 4.3 SITA OnAir Primary Market Competitors 2018
Figure 4.4 Thales SA Total Company Sales 2013-2017 (US$m, AGR %)
Figure 4.5 Thales SA Net Income / Loss 2013-2017 (US$m)
Figure 4.6 Thales SA Net Capital Expenditure 2013-2017 (US$m, AGR %)
Figure 4.7 Thales SA Sales by Segment of Business 2013-2017 (US$m, Total Company Sales AGR %)
Figure 4.8 Thales SA Primary International Operations 2018
Figure 4.9 Thales SA Sales AGR by Geographical Location 2014-2017 (AGR %)
Figure 4.10 Thales SA Sales by Geographical Location 2013-2017 (US$m, Total Company Sales AGR %)
Figure 4.11 Thales SA Organisational Structure 2017
Figure 4.12 Thales SA Number of Employees 2010-2014 (No. of Employees, AGR %)
Figure 4.13 Thales SA Primary Market Competitors 201
Figure 4.14 Global Eagle Entertainment Inc Total Company Sales 2012-2016 (US$m, AGR %)
Figure 4.15 Global Eagle Entertainment Inc Sales in the Connectivity Market 2013-2016 (US$m, AGR %)
Figure 4.16 Global Eagle Entertainment Inc Net Loss 2012-2016 (US$m)
Figure 4.17 Global Eagle Entertainment Inc Sales by Segment of Business 2013-2016 (US$m, Total Company Sales AGR %)
Figure 4.18 Global Eagle Entertainment Inc Sales AGR by Segment of Business 2014-2016 (AGR %)
Figure 4.19 Global Eagle Entertainment Inc Primary International Operations 2017
Figure 4.20 Global Eagle Entertainment Inc Sales by Geographical Location 2013-2016 (US$m, Total Company Sales AGR %)
Figure 4.21 Global Eagle Entertainment Inc Organisational Structure 2017
Figure 4.22 Global Eagle Entertainment Inc Primary Market Competitors 2018
Figure 4.23 Cobham plc Total Company Sales 2013-2017 (US$m, AGR %)
Figure 4.24 Cobham plc Net Income 2013-2017 (US$m)
Figure 4.25 Cobham plc Net Capital Expenditure 2013-2017 (US$m, AGR %)
Figure 4.26 Cobham plc Sales by Segment of Business 2013-2017 (US$m, Total Company Sales AGR %)
Figure 4.27 Cobham plc Sales AGR by Segment of Business 2014-2017 (AGR %)
Figure 4.28 Cobham plc Primary International Operations 2018
Figure 4.29 Cobham plc sales AGR by Geographical Location 2014-2017 (AGR %)
Figure 4.30 Cobham plc Sales by Geographical Location 2013-2017 (US$m, Total Company Sales AGR %)
Figure 4.31 Cobham plc Number of Employees 2013-2017 (No. of Employees, AGR %)
Figure 4.32 Cobham plc Primary Market Competitors 2018
Figure 4.33 Panasonic Corporation Total Company Sales 2013-2017 (US$m, AGR %)
Figure 4.34 Panasonic Corporation Net Income / Loss 2013-2017 (US$m, AGR %)
Figure 4.35 Panasonic Corporation Net Capital Expenditure 2013-2017 (US$m, AGR %)
Figure 4.36 Panasonic Corporation Sales by Segment of Business 2013-2017 (US$m, Total Company Sales AGR %)
Figure 4.37 Panasonic Corporation Sales AGR by Segment of Business 2013-2017 (AGR %)
Figure 4.38 Panasonic Corporation Primary International Operations 2018
Figure 4.39 Panasonic Corporation Sales by Geographical Location 2013-2017 (US$m)
Figure 4.40 Panasonic Corporation Sales AGR by Geographical Location 2014-2017 (AGR %)
Figure 4.41 Panasonic Corporation Organisational Structure 2017
Figure 4.42 Panasonic Corporation Number of Employees 2013-2017 (No. of Employees, AGR %)
Figure 4.43 Panasonic Corporation Primary Market Competitors 2017
Figure 4.44 Honeywell International Inc Total Company Sales 2013-2017 (US$m, AGR %)
Figure 4.45 Honeywell International Inc Net Income 2013-2017 (US$m, AGR %)
Figure 4.46 Honeywell International Inc Net Capital Expenditure 2013-2017 (US$m, AGR %)
Figure 4.47 Honeywell International Inc Sales by Segment of Business 2013-2017 (US$m, Total Company Sales AGR %)
Figure 4.48 Honeywell International Inc Sales AGR by Segment of Business 2014-2017 (AGR %)
Figure 4.49 Honeywell International Inc Primary International Operations 2017
Figure 4.50 Honeywell International Inc Sales AGR by Geographical Location 2014-2017 (AGR %)
Figure 4.51 Honeywell International Inc Sales by Geographical Location 2013-2017 (US$m, Total Company Sales AGR %)
Figure 4.52 Honeywell International Inc Organisational Structure 2017
Figure 4.53 Honeywell International Inc Number of Employees 2013-2017 (No. of Employees, AGR %)
Figure 4.54 Honeywell International Inc Primary Market Competitors 2017
Figure 4.55 Gogo Inc Total Company Sales 2013-2017 (US$m, AGR %)
Figure 4.56 Gogo Inc Net Income / Loss 2013-2017 (US$m)
Figure 4.57 Gogo Inc Net Capital Expenditure 2013-2017 (US$m, AGR %)
Figure 4.58 Gogo Inc Sales by Segment of Business 2013-2017(US$m, Total Company Sales AGR %)
Figure 4.59 Gogo Inc Sales AGR by Segment of Business 2014-2017 (AGR %)
Figure 4.60 Gogo Inc Primary International Operations 2018
Figure 4.61 Gogo Inc Sales by Geographical Location 2015-2017 (US$m, Total Company Sales AGR %)
Figure 4.62 Gogo Inc Organisational Structure 2017
Figure 4.63 Gogo Inc Number of Employees 2015-2017 (No. of Employees)
Figure 4.64 Gogo Inc Primary Market Competitors 2017
Figure 4.65 Inmarsat plc Total Company Sales 2013-2017 (US$m, AGR %
Figure 4.66 Inmarsat plc Net Income 2013-2017 (US$m, AGR %)
Figure 4.67 Inmarsat plc Net Capital Expenditure 2013-2017 (US$m, AGR %)
Figure 4.68 Inmarsat plc Sales by Segment of Business 2014-2017 (US$m, Total Company Sales AGR %
Figure 4.69 Inmarsat plc Primary International Operations 2018
Figure 4.70 Inmarsat plc Sales AGR by Geographical Location 2013-2016 (AGR %)
Figure 4.71 Inmarsat plc Sales by Geographical Location 2012-2016 (US$m, Total Company Sales AGR %)
Figure 4.72 Inmarsat plc Organisational Structure 2017
Figure 4.73 Inmarsat plc Number of Employees 2013-2017 (No. of Employees, AGR %)
Figure 4.74 Inmarsat plc Primary Market Competitors 2017
Figure 4.75 Rockwell Collins Inc Total Company Sales 2013-2017 (US$m, AGR %)
Figure 4.76 Rockwell Collins Inc Sales in the Connected Aircraft Market 2013-2017 (US$m, AGR %)
Figure 4.77 Rockwell Collins Inc Net Income 2013-2017 (US$m, AGR %) 333
Figure 4.78 Rockwell Collins Inc Net Capital Expenditure 2013-2017 (US$m, AGR %)
Figure 4.79 Rockwell Collins Inc Sales by Segment of Business 2013-2017 (US$m, Total Company Sales AGR %)
Figure 4.80 Rockwell Collins Inc Sales AGR by Segment of Business 2013-2017 (AGR %)
Figure 4.81 Rockwell Collins Inc Primary International Operations 2018
Figure 4.82 Rockwell Collins Inc Organisational Structure 2017
Figure 4.83 Rockwell Collins Inc Number of Employees 2013-2017 (No. of Employees, AGR %)
Figure 4.84 Rockwell Collins Inc Primary Market Competitors 2017
Figure 4.85 Kontron AG Total Company Sales 2012-2016 (US$m, AGR %)
Figure 4.86 Kontron AG Net Income / Loss 2012-2016 (US$m)
Figure 4.87 Kontron AG Sales by Segment of Business 2016 (% Share)
Figure 4.88 Kontron AG Primary International Operations 2018
Figure 4.89 Kontron AG Sales AGR by Geographical Location 2015-2016 (AGR %)
Figure 4.90 Kontron AG Sales by Geographical Location 2014-2016 (US$m, Total Company Sales AGR%)
Figure 4.91 Kontron AG Organisational Structure 2017
Figure 4.92 Kontron AG Number of Employees 2010-2014 (No. of Employees, AGR %)
Figure 4.93 Kontron AG Primary Market Competitors 2018
Figure 4.94 Zodiac Aerospace SA Total Company Sales 2013-2017 (US$m, AGR %)
Figure 4.95 Zodiac Aerospace SA Sales by Segment of Business 2013-2017 (US$m, Total Company Sales AGR %)
Figure 4.96 Zodiac Aerospace SA Sales AGR by Segment of Business 2013-2017 (AGR %)
Figure 4.97 Zodiac Aerospace SA Primary International Operations 2018
Figure 4.98 Zodiac Aerospace SA Organisational Structure 2017
Figure 4.99 Zodiac Aerospace Select Subsidiaries 2017 (Subsidiary, Location)
Figure 4.100 Zodiac Aerospace SA Number of Employees 2013-2017 (No. of Employees, AGR %)
Figure 4.101 Zodiac Aerospace SA Primary Market Competitors 2017
Figure 4.102 ViaSat Inc Total Company Sales 2013-2017 (US$m, AGR %)
Figure 4.103 ViaSat Inc Net Income / Loss 2013-2017 (US$m)
Figure 4.104 ViaSat Inc Net Capital Expenditure 2013-2017 (US$m, AGR %)
Figure 4.105 ViaSat Inc Sales by Segment of Business 2013-2017 (US$m, Total Company Sales AGR %)
Figure 4.106 ViaSat Inc Sales AGR by Segment of Business 2013-2017 (AGR %)
Figure 4.107 ViaSat Inc Primary International Operations 2018
Figure 4.108 ViaSat Inc Sales AGR by Geographical Location 2013-2017(AGR %)
Figure 4.109 ViaSat Inc Sales by Geographical Location 2013-2017 (US$m, Total Company Sales AGR %)
Figure 4.110 ViaSat Inc Organisational Structure 2017
Figure 4.111 ViaSat Inc Primary Market Competitors 2017
Figure 4.112 Eutelsat Communications SA Total Company Sales 2012-2017 (US$m, AGR %)
Figure 4.113 Eutelsat Communications SA Net Income 2012-2017 (US$m, AGR %)
Figure 4.114 Eutelsat Communications SA Primary International Operations 2018
Figure 4.115 Eutelsat Communications SA Sales AGR by Geographical Location 2013-2017 (AGR %)
Figure 4.116 Eutelsat Communications SA Sales by Geographical Location 2012-2017 (US$m, Total Company Sales AGR %
Figure 4.117 Eutelsat Communications SA Organisational Structure 2017
Figure 4.118 Eutelsat Communications SA Number of Employees 2012-2017 (No. of Employees, AGR %)
Figure 4.119 Eutelsat Communications SA Primary Market Competitors 2017
Figure 4.120 Iridium Communications Inc Total Company Sales 2013-2017 (US$m, AGR %)
Figure 4.121 Iridium Communications Inc Net Income 2013-2017 (US$m, AGR %)
Figure 4.122 Iridium Communications Inc Net Capital Expenditure 2013-2017 (US$m, AGR %)
Figure 4.123 Iridium Communications Inc Sales by Segment of Business 2013-2017 (US$m, Total Company Sales AGR %)
Figure 4.124 Iridium Communications Inc Sales AGR by Segment of Business 2014-2017 (AGR %)
Figure 4.125 Iridium Communications Inc Primary International Operations 2018
Figure 4.126 Iridium Communications Inc Sales AGR by Geographical Location 2014-2017 (AGR %)
Figure 4.127 Iridium Communications Inc Sales by Geographical Location 2013-2017 (US$m, Total Company Sales AGR %)
Figure 4.128 Iridium Communications Inc Organisational Structure 2017
Figure 4.129 Iridium Communications Inc Primary Market Competitors 2017
Figure 4.130 BAE Systems plc Total Company Sales 2013-2017 (US$m, AGR %)
Figure 4.131 BAE Systems plc Net Income 2013-2017 (US$m, AGR %)
Figure 4.132 BAE Systems plc Net Capital Expenditure 2013-2017 (US$m, AGR %)
Figure 4.133 BAE Systems plc Sales by Segment of Business 2013-2017 (US$m, Total Company Sales AGR %)
Figure 4.134 BAE Systems plc Sales AGR by Segment of Business 2014-2017 (AGR %)
Figure 4.135 BAE Systems plc Primary International Operations 2018
Figure 4.136 BAE Systems plc Sales AGR by Geographical Location 2013-2017 (AGR %)
Figure 4.137 BAE Systems plc Sales by Geographical Location 2013-2017 (US$m, Total Company Sales AGR %)
Figure 4.138 BAE Systems plc Organisational Structure 2017
Figure 4.139 BAE Systems plc Number of Employees 2013-2017 (No. of Employees, AGR %)
Figure 4.140 BAE Systems plc Primary Market Competitors 2017
A.M.P. Air Conditioning Limited
Abertis
AC BidCo LLC
ACCEL (Tianjin) Flight Simulation Co. Ltd
AccuWeather
Advanced Film GmbH
Advanced Inflight Alliance AG
Advanced Inflight Alliance Ltd
AdvanSix Inc
Aerodocs Limited (Arconics)
Aeroflex Ltd
Aeroflex Test Equipment Services Limited
Aeroflex Wichita Inc
AeroMobile Communications Ltd
AEROMOD
Affair 000
AFP
Air Esurfing
Air Précision SAS
AirBerlin Group
Airbus
Airbus and KID-Systeme GmbH
Aircel
Aircraft Cabins Greenpoint Aerospace, Inc.,
Aireon LLC
Airfone
Airservices Australia
Airtanker Holdings Ltd
Al Jazeera
Alcatel-Lucent
Allied Signal Aerospace Service Corporation
AltegroSky
Amazon
Amjet Executive SA
ANA
Anchor Electrical Pvt Ltd
Andesat SA
API technologies Inc
Appareo Systems LLC
Apple
APT Satellite Company Limited (APT)
Arconics
Arimo, inc.
ARINC Direct
ARINC Inc
ASAVIE
Asia Satellite Telecommunications Co. Ltd
Associated Air Center’s (AAC)
AT&T Inc
Aures Technologies SA
Australian Satellite Communications
Aveillant Ltd
Aviaso AG
Aviation Clean Air (ACA)
Aviation Communications & Surveillance Systems
Aviation Data Communication Corporation (ADCC)
Avitek
Axell Wireless Ltd
B/E Aerospac
BAE Intelligence and Security
BAE Systems
BAE Systems (Operations) Ltd
BAE Systems Controls Inc
BAE Systems Information and Electronic Systems Integration Inc
BAE Systems Information Solutions Inc
BAE Systems Land & Armaments LP
BAE Systems plc
BAE Systems Surface Ships Ltd
Barclays
Beijing Blue Sky Aviation Technology
Beijing Marine Communication & Navigation Company (MCN)
Bendix/King
Berkshire Hathaway
BlackBerry
Boeing Business Jet
Boeing Commercial Airplanes
Bombardier
Bombardier Business Aircraft
Borg-Warner
Bristow Helicopters Ltd
BT Group plc
Cantwell Cullen & Company Inc
Cessna
Chelton Avionics Inc
Chelton Ltd
Chelton Telecom and Microwave SAS
CheltonInc
China Satellite Communications Co. Ltd
China Telecom
China Telecom Satellite Communications Ltd
Christie Digital Systems
Clay Lacy Aviation
CNBC
CNN International
Cobham Aerospace Communications
Cobham CTS Ltd
Cobham Inmet
Cobham plc
Cobham SATCOM
Cobham TCS Ltd
Cobham Defence Communications Ltd
Comlux Aviation
Corsair (TUI Group)
Cupcake Digital
Cypress Semiconductor
Dai Nippon Printing
Dassault
Dassault Falcon Services Le Bourget
Datacolor AG
DATALOGIC SpA
Delta Connection
Deutsche Telekom Group
Diehl Aerospace GmbH
DISH Network L.L.C. (DISH)
Domo Tactical Communications (DTC) Limited
DTC Communications Inc
DTI Software FZ-LLC
DTI Solutions Inc
EAD Aerospace
easyJet
eBay Inc.
Eclipse
Eclipse Electronic Systems
Elster Group GmbH
Embraer
Emerging Markets Communications (EMC)
Emphasis Video Entertainment Ltd
EMS Aviation Inc
ENAV
Engreen Inc
Entertainment in Motion Inc
Euro Broadband Infrastructure Sàrl (Euro Infrastructure Co.)
Eutelsat
Eutelsat America Corporation
Eutelsat Americas
Eutelsat Asia Pte Ltd
Eutelsat Beijing
Eutelsat Communications SA
Eutelsat do Brasil
Eutelsat GmbH
Eutelsat Italia
Eutelsat Madeira
Eutelsat Middle East
Eutelsat Polska
Eutelsat South Africa
Eutelsat UK Ltd
Evac GmbH
Evac Train Vacuum System Trading
Evolis SA
FADEC Alliance
Fairdeal Multimedia Pvt Ltd
Fairdeal Studios Pvt Ltd
Federal Mogul Corporation
Flight Level Media
FlightAware
GEE
General Dynamics Corporation
General Electric Company
Global Eagle Entertainment GmbH
Global Eagle Entertainment Inc
Global Eagle Entertainment Luxembourg sarl
Global Wireless
Globalstar Inc
Glympse Inc.
Gogo
Gogo Air International Sarl
Gogo Air Mexico S de RL de CV
Gogo Business Aviation LLC
Gogo Connectivity Ltd
Gogo GK
Gogo Inc
Gogo Intermediate Holdings LLC
Gogo LLC
Gogo Singapore Pte Ltd
Google
Greenpoint Technologies
Grimes Aerospace Company
Grupo Aeroportuario del Centro Norte (OMA)
Guavus
GuestLogix,
Gulfstream Aerospace Corporation
GX Aviation
Havelsan
HNA Group
HNA Technik Co. Ltd
Honeywell
Honeywell (China) Co. Ltd
Honeywell Aerospace Avionics Malaysia Sdn Bhd
Honeywell Aerospace de Mexico S de RL de CV
Honeywell Aerospace UK
Honeywell International Inc.
Huawei Technologies
Hubei Ali Jiatai
Hughes
Hughes Network Systems
Hunter Communications Canada
Hussman Parent Inc
IAP Research
IBM
ICG (International Communications Group)
IFE Alliance Licensing GmbH
IFP
IMG
Immfly
Immobiliere Galli
IMS
IN Services Asia
Inflight Management Development Centre Ltd
Inflight Productions BV
Inflight Productions FZ-LLC
Inflight Productions Germany GmbH
Inflight Productions Ltd
Inflight Productions Pte Ltd
Inflight Productions USA Inc
Inmarsat Australia Pty Ltd
Inmarsat Canada Holdings Inc
Inmarsat Employment Company Ltd
Inmarsat Finance plc
Inmarsat Global Ltd
Inmarsat Hellas Satellite Services SA
Inmarsat Investments Ltd
Inmarsat Leasing (Two) Ltd
Inmarsat Mobile Networks Inc
Inmarsat Navigation Ventures Ltd
Inmarsat New Zealand Ltd
Inmarsat plc
Inmarsat Solutions (Canada) Inc
Inmarsat Solutions (US) Inc
Inmarsat Solutions AS
Inmarsat Solutions BV
Inmarsat Solutions Global Ltd
Inmarsat Solutions Pte Ltd
Intellicabin
Intelligrated, Inc.
International Communications Group Inc
International Lease Finance Corporation (ILFC)
Intertrust
IOM Licensing Holding Company Ltd
Iridium Blocker-B Inc
Iridium Carrier Holdings LLC
Iridium Carrier Services LLC
Iridium Communications Inc
Iridium Constellation LLC
Iridium Government Services LLC
Iridium Holdings LLC
Iridium Norway A/S
Iridium Satellite LLC
ITAONAIR
ITC Global Inc
JAST SA
Jet Aviation Geneva
Jet Aviation St. Louis
JetTech Aerospace
JRC
K5-Aviation
KID-Systeme
Kontron (Beijing) Technology Co Ltd
Kontron AG
Kontron America Inc
Kontron Asia Pacific Design Sdn Bhd
Kontron Australia Pty Ltd
Kontron Canada Inc
Kontron Compact Computers AG iL
Kontron East Europe Sp zoo
Kontron ECT Designs sro
Kontron Europe GmbH
Kontron Hongkong Technology Co Ltd
Kontron Management GmbH
Kontron Modular Computers SAS
Kontron Technology A/S
Kontron Technology India Pvt Ltd
Kontron UK Ltd
Korean Aerospace Industries Ltd (KAI)
Kymeta
L-3 Platform Integration
LeoSat
LiveTV, LLC,
Lonely Planet
Lufthansa Systems
Lufthansa Technik
M/A-COM Technology Solutions Holdings, Inc
MagicInk Interactive LLC
Magnolia Pictures
Magzter
Martinair
masFlight
Matsumura-Gumi Corporation
Melrose Industries plc
MGI SA
N44HQ LLC
National Airports Corporation (NAC)
NAV CANADA
navAero
Naviair
Navicom Aviation
Netflix
NetJets
New York Times
NextNine Inc
NHK World Premium
Noorsat
Northrop Grumman Corporation
N-TechLab
Oi
OneWeb Ltd
OOO Iridium Communications
OOO Iridium Services
OpenSynergy GmbH
Orange Business Services
ORBCOMM Inc
OSN
OTE
Pacific Avionics Pty. Ltd
Panasonic Asia Pacific Pte Ltd
Panasonic Avionics Corporation
Panasonic Avionics Corporation Services Singapore (PACSS)
Panasonic Corporation
Panasonic Corporation of China
Panasonic Corporation of North America
Panasonic do Brasil Ltda
Panasonic Europe Ltd
Panasonic Factory Solutions Co. Ltd
Panasonic Healthcare Holdings Co. Ltd
Panasonic India Pvt Ltd
Panasonic Information Systems Co. Ltd
Panasonic North America Corporation
Panasonic Semiconductor Solutions Co. Ltd
Panasonic Taiwan Co Ltd
Parachutes Industries of South Africa
PATS Aircraft Systems
Perimeter Internetworking Corporation
Pinnacle
Pratt & Whitney
PT Telekomunikasi Indonesia Tbk (Telkom Indonesia),
Qantas
QEST
Quantenelektronische Systeme GmbH (“QEST”)
Quick Service Software Inc
Radio Holdings Inc
Raytheon Company
RMG Networks Holding Corp
Rockwell Collins EUMEA Holdings SAS
Rockwell Collins European Holdings Sarl
Rockwell Collins Inc
Rockwell Collins International Financing Sarl
Rockwell Collins International Holdings Sarl
roKKi
Rolls-Royce
Rovi Corporation
Row 44 Inc
RTSoft ZAO
RuSat
SES Networks
S&T Deutschland Holding AG
S.C.A.M.E. Sistemi S.R.L.
Sabena Technics
Safran SA
Safran Morpho
Samsung
Samsung Thales Co. Ltd
SANYO Electric Co. Ltd
Satcom Direct
Satcom1
Satélites Mexicanos SA de CV
Scandinavian Avionics
Sea Tel Inc
Segovia Inc
SES SA
Seven Dreamers Laboratories, Inc.
Shareco Technologies
SIA Engineering Company Ltd (SIAEC)
SingTel
SITA
SITA OnAir
SKY Perfect JSAT
Smiths Microwave
Softswitch LLC
Sony Music Entertainment
Spafax
Speedcast International Ltd
Sport 24
Spotify
StandardAero
Syncom-Iridium Holdings Corporation
Tactel AB
TEAM SA
TECOM
Teledyne Controls
TeraDiode, Inc.
Thaicom plc.
Thales
Thales Air Systems & Electron Devices GmbH
Thales Air Systems SAS
Thales Alenia Space Italia SpA
Thales Alenia Space SAS
Thales Avionics Electrical Systems SAS
Thales Avionics Inc
Thales Avionics Ltd
Thales Avionics SAS
Thales Canada
Thales InFlyt Experience
Thales SA
Thales Systèmes Aéroportés SAS
The Lab Aero Inc
The Weather Channel
ThinKom Solutions
Thrane &Thrane A/S
Thuraya Telecommunications Company
TIMES (Telecommunication, Information, Media, Edutainment & Services).
T-Mobile
Travel Management Company (TMC)
TriaGnoSys GmbH
Trivec-Avant Corporation
TRJet Havacilik Teknolojileri Anonim Şirketi (TRJet)
Turkish Technic
ubitronix solutions GmbH
Unicomairnet
Union Rhac Tecnologia Em Eficiencia Energetica
United Continental Holdings
United Technologies Corporation
ViaSat Australia Pty Ltd
ViaSat Canada Company
ViaSat China Services Inc
ViaSat Communications Inc
ViaSat Credit Corp
ViaSat Europe Srl
ViaSat Inc
ViaSat Inc Limitada
ViaSat India Pvt Ltd
ViaSat Peru Srl
ViaSat Satellite Holdings Ltd
ViaSat Satellite Ventures Holdings Luxembourg Sarl
ViaSat Satellite Ventures LLC
ViaSat UK Ltd
ViaSat Worldwide Ltd
Viavi Solutions
Vizocom
Vormetric Inc
Western Outdoor Interactive Pvt Ltd
WildBlue Communications LLC
WINS
XOJET
Yahsat
Zinio
Zodiac Aero Duct Systems
Zodiac Aerosafety Systems
Zodiac Aerospace (Jiangsu) Co Ltd
Zodiac Aerospace Germany Investment GmbH
Zodiac Aerospace Holding Australia Pty Ltd
Zodiac Aerospace Maroc
Zodiac Aerospace Netherlands Investment NV
Zodiac Aerospace SA
Zodiac Aerospace Services
Zodiac Aerospace Services Europe
Zodiac Aerospace Services Middle East
Zodiac Aerospace Services UK Ltd
Zodiac Aerospace UK Investment Ltd
Zodiac Aerotechnics
Zodiac Cabin Interiors Europe
Zodiac Composite Monuments Tunisie
Zodiac Data Systems (ZDS)
Zodiac Engineering
Zodiac Seats France
Zodiac Seats Tunisie Sarl
Zodiac Seats UK
Zodiac Seats US
Zodian Aerospace Service
Airlines Mentioned
Aegean Airlines
Aer Lingus
Aerolineas Argentinas
Aeromexico
Air Astana
Air Astana
Air Austral
Air Canada
Air Caraibes
Air China
Air Costa
Air Cote d’lvoire
Air Europa
Air France
Air France-KLM
Air India
Air Mauritius
Air New Zealand
Air Serbia
Air Seychelles
AirAsia
AirAsia India
AIRMARK Aviation
Alaska Airlines
All Nippon Airways (ANA)
American Airlines
Asiana Airlines
Austrian Airlines
Avianca
Avianca Brasil Airlines
Azerbaijan Airlines
Azerfon
Beijing Capital Airlines.
British Airways
Cathay Pacific
Cebu Pacific Air
China Eastern Airlines
China Southern Airlines
Continental Airlines
Delta Air Lines
Éclair
EL AL Israel Airlines
Emirates
Etihad Airways
Fiji Airways
Finnair
Flydubai
French Blue
Garuda Indonesia
GOL
Hainan Airlines
Hawaiian Airlines (HAL)
Hong Kong Airlines
Iberia
Iberia Express Airlines
Icelandair
Interjet
Japan Airlines
Japan Transocean Air (JTA)
Jazeera Airways
JetBlue Airways
Jordanian Airlines
Juneyao Airlines
KLM Royal Dutch Airlines
Kuwait Airways
LAN Airlines
Libyan Airlines
LOT Polish Airlines
Lufthansa
Malaysia Airlines
Mango Airlines
Myanmar International Airlines
Netjets
Nok Air
Norwegian Air Shuttle
Oman Air
Philippines Airlines
Qantas
Qatar Airways
Royal Air Maroc
Royal Brunei Airlines
Saudia Airlines
SaudiGulf Airlines
Shenzhen Airlines
Sichuan Airlines
Singapore Airlines
Skymark Airlines
South African Airways
Southwest Airlines
Spring Airlines
SriLankan Airlines
Swiss International Airlines (SWISS)
TAAG Angola Airlines
TAM Airlines
TAP Portugal
Thai Airways International
Transasia Airways
Turkish Airlines
TWIN JET
United Airlines
UTair
Vietnam Airlines
Virgin America
Virgin Atlantic
Virgin Australia
Vistara
Vueling
WestJet
Xiamen Airlines
Airports Mentioned
Amsterdam Airport Schiphol
Chhatrapati Shivaji International Airport (CSIA)
Dubai International Airport (UAE)
Dublin Airport
Heathrow Airport
Hong Kong International Airport (Hong Kong)
Las Vegas McCarran International Airport
London City airport
London Heathrow Airport (Hillingdon, UK)
Los Angeles International Airport
McCarran International Airport (Nevada, US).
New York JFK Airport
San Francisco International Airport (California, US )
Singapore Changi Airport (Singapore)
Toronto Pearson International Airport (Ontario, Canada)
Zürich Airport
Organisations Mentioned
Administración Nacional de Avianción Civil (ANAC)
Airline Passenger Experience Association (APEX)
Airports Council International
American Institute of Physics
APEX
Army Research Laboratory
BBC
Bundesliga
CAAC (Civil Aviation Authority of China)
China Transport Telecommunication & Information Centre (CTTIC)
Civil Aviation Safety Authority
Department of Computer Science at Texas Tech University
Digital Lifestyle Network Alliance (DLNA)
EUROCONTROL
European Aviation Safety Agency (EASA)
European Commission (EC)
European Union
FAA
Federal Aviation Administration (FAA)
Federal Aviation Administration’s (FAA) Performance-Based Operations Aviation Rulemaking Committee (PARC) Communications Working Group (CWG)
Federal Communications Commission (FCC)
Formula 1
IATA
Indian Institute of Technology Madras
Industry Canada
International Air Transport Association (IATA)
International Civil Aviation Organization (ICAO)
Irish Aviation Authority (IAA)
Japanese Civil Aviation Bureau (JCAB)
Lawrence Livermore National Laboratory
Los Alamos National Laboratory
National Aeronautics and Space Administration (NASA)
National Business Aviation Association (NBAA)
National Energy Technology Lab or the US Department of Energy
NBA
Northwestern University's Center for Quantum Devices
Norwegian University of Science and Technology (NTNU) Biometrics Laboratory in Gjøvik, Norway,
Oregon State University
Polish Air Navigation Services Agency (PANSA)
Skytrax
Tel Aviv University's School of Chemistry and Center for Nanoscience and Nanotechnology
Texas Tech University
The National Science Foundation
Thomas J. Watson School of Engineering and Applied Science at Binghamton University
University of California San Diego School of Medicine and Skagg School of Pharmacy and Pharmaceutical Sciences
University of Southern Denmark
University of Washington
US Department of Defense (DoD)
Wayfindr
Wolfson School of Mechanical, Electrical and Manufacturing Engineering at Loughborough University, UK
Download sample pages
Complete the form below to download your free sample pages for Top 15 Connected Aircraft Companies 2018Related reports
-
Air Traffic Control Equipment Market Report 2017-2027
Are you interested or involved in air traffic control equipment? Visiongain has produced an in Depth market research report on...
Full DetailsPublished: 16 October 2017 -
Civil Helicopter Market Report 2018-2028
The latest report from business intelligence provider company name offers comprehensive analysis of the global civil helicopter market. Visiongain assesses...
Full DetailsPublished: 07 June 2018 -
Commercial Aircraft Modernization, Upgrade and Retrofit Market Report 2018-2028
This brand new report on the commercial aircraft Modernisation upgrade and retrofit market features market sizing, forecasts and detailed contract...
Full DetailsPublished: 12 April 2018 -

Aviation Cyber Security Market Report 2018-2028
The global aviation cyber security market will reach $2,691m in 2018.
...Full DetailsPublished: 25 September 2018 -
Commercial Aircraft Cabin Seating & Interiors Market Forecast 2018-2028
Visiongain assessed that the world market for commercial aircraft cabin seating & interiors will reach $16.4 billion in 2018....Full DetailsPublished: 11 September 2018 -
Connected Aircraft Market Report 2018-2028
Industry professionals: cut through media hype and exaggeration by reading an objective dispassionate Visiongain report on the connected aircraft market....
Full DetailsPublished: 22 May 2018 -

Commercial Aircraft NextGen Avionics Market Report 2018-2028
Are you interested or involved in the $5.6bn Commercial Aircraft NextGen Avionics market? Visiongain has produced an in depth market...
Full DetailsPublished: 06 August 2018 -
Connected Trucks Market Outlook Report 2018-2028
The connected trucks market is on a strong growth trajectory right now. The connected solutions market in particular is booming...
Full DetailsPublished: 15 May 2018 -
Commercial Aviation Sensors & Switches Market Report 2018-2028
The introduction of connected aircraft in the aerospace industry has led Visiongain to publish this timely report. The $685m commercial...
Full DetailsPublished: 01 June 2018 -
Aerospace & Defence Telemetry Market 2017-2027
Interested or involved in Aerospace and Defence Telemetry? Visiongain has produced an in Depth market research report on Aerospace and...Full DetailsPublished: 29 March 2017
Download sample pages
Complete the form below to download your free sample pages for Top 15 Connected Aircraft Companies 2018Do you have any custom requirements we can help you with?
Any specific country, geo region, market segment or specific company information?
Email us today, we can discuss your needs and see how we can help: jamie.roberts@visiongain.com
Visiongain aviation reports are compiled using a broad and rich mixture of both primary and secondary information to produce an overall industry outlook. In order to provide our clients with the best product possible product, we do not rely on any one single source of information. Visiongain analysts reach out to market-leading vendors and automotive industry experts but also review a wealth of financial data and product information from a vast range of sources. To find out more about our reports methodology please email jamie.roberts@visiongain.com
Would you like a free report overview of the report of your choice?
If so, please drop an email to Jamie Roberts stating your chosen report title to jamie.roberts@visiongain.com
Would you like to get the latest Visiongain aviation reports catalogue?
What are the dynamic growth sectors? where are the regional business opportunities?
Which technologies will prevail and who are the leading companies succeeding in these sectors and why?
If you want definitive answers to business critical questions, discover Visiongain’s full range of business intelligence reports.
If so, please email Jamie Roberts on jamie.roberts@visiongain.com or call her today on +44 207 336 6100
Airline Passenger Experience Association (APEX)
Airlines for America
Airport Consultants Council (ACC)
Airports Council International (ACI)
Airports Council International-North America
American Association of Airport Executives
Arab Air Carriers Organization (AACO)
European Aerospace Cluster Partnership
Global Business Travel Association (GBTA)
International Air Transport Association (IATA)
Security Industry Association (SIA)
Security Manufacturers Coalition
Women in Aviation
World Aviation Services
Don’t Miss Out!
Latest Aviation news
Aircraft Computers Market
The global Aircraft Computers market is projected to grow at a CAGR of 5.7% by 2034
24 June 2024
Space Mining Market
The global Space Mining market is projected to grow at a CAGR of 20.7% by 2034
07 June 2024
Connected Aircraft Market
The global Connected Aircraft market is projected to grow at a CAGR of 17.2% by 2034
05 June 2024
Satellite Ground Station Market
The global Satellite Ground Station market was valued at US$65.69 billion in 2023 and is projected to grow at a CAGR of 13.3% during the forecast period 2024-2034.
21 May 2024


