Numerous technological developments and innovations in the automotive sector have led Visiongain to publish this unique connected car report, which may be crucial to your company’s improved success. I thought it would be of interest to you.
Visiongain calculates that the connected car market will reach $42.99bn in 2019.
Do you know?
• Who are the leading automotive OEM and non-OEM companies in the connected car market?
• What are the different types of products and services offered by the various companies in the connected car market?
• What percentage of the market is being taken by each of the leading companies?
• Who are the leading companies dominating the connected car market?
• What are the strategies being used by the companies to sustain their competitive position within the connected car market?
• What are the recent developments of the leading companies in the connected car market?
Reasons To Buy
Global Connected Car Market Forecast 2019-2029
SWOT Analysis Of The Connected Car Market
Value Chain Analysis Of The Connected Car Market
The report provides market share %, revenue and ranking of the 20 leading companies operating within the connected car market space
• Apple Inc.
• AT&T Inc.
• BMW AG
• Broadcom Corporation
• Daimler AG
• Fiat Chrysler Automobiles
• Ford Motor Company
• General Motors Co.
• Google Inc.
• Honda Motor Co.
• Qualcomm Inc.
• Samsung
• Sierra Wireless
• Tech Mahindra Ltd.
• Tesla
• Toyota Motor Corporation
• Verizon Communications
• Visteon Corporation
• Volkswagen Group
• Volvo
Reasons why you must order and read this report today:
• This report will help you in understanding the connected car ecosystem.
• This report will help you in understanding the market strategies used by the top 20 connected car companies.
• This report will help you in understanding where should you target your business strategy
• Which applications should you focus upon?
• Which disruptive technologies should you invest in?
• Which companies should you form strategic alliances with?
• Which company is likely to succeed and why?
• What business models should you adopt?
• What industry trends should you be aware of?
This independent, 180 page report guarantees you will remain better informed than your competition. With over 70 tables and figures examining the top 20 connected car companies, the report gives you a visual, one-stop breakdown of your market., as well as analysis, from 2019-2029 keeping your knowledge that one step ahead allowing you to succeed.
This report is essential reading for you or anyone in the automotive, telematics, electronics or telecommunications sectors with an interest in connected cars. Purchasing this report today will help you to recognise those important market opportunities and understand the possibilities there.
Target audience
• Automotive OEMs
• Electronics companies
• Telecommunications companies
• Telematics specialists
• Software developers
• Automobile organizations
• Technology investors
• Automobile investors
• Market analysts
• Consultants
• Investors
• National and international automobile authorities
• Business, marketing or competitive intelligence manager
• Business intelligence consultant
• Marketing manager
• Business development manager
• Product development manager
• Chief executive officer (CEO)
• Commercial director
• Sales manager
• R&D manager
• Banks
• Regulators
• Associations
• Automobile industry bodies
• Automobile regulators and other policy makers
Visiongain is a trading partner with the US Federal Government
CCR Ref number: KD4R6
1 Report Overview
1.1 Global Connected Car Market Overview
1.2 Why you should read this report
1.3 Benefits of this report
1.4 Report Structure
1.5 Who is This Report For?
1.6 Methodology
1.6.1 Secondary Research
1.7 Frequently Asked Questions (FAQs)
1.8 Associated Visiongain Reports
1.9 About Visiongain
2 Introduction to the Connected Car Market
2.1 Connected Car Definition
2.2 Connected Car Market Definition
2.3 Connected Car Market Size and Forecast 2019-2029
2.4 Connected Car Market Segmentation- By Connectivity
2.4.1 Embedded Solutions Submarket
2.4.1.1 Embedded Solutions Analysis
2.4.1.2 Benefits of Embedded Solutions for OEMs
2.4.1.3 Why the Level of Penetration of Embedded Solutions is Low
2.4.2 Integrated Solutions Submarket
2.4.2.1 Integrated Solutions Analysis
2.4.3 Tethered Solutions Submarket
2.4.3.1 Tethered Solutions Analysis
2.4.3.2 Why tethered solutions will decrease in the future
3 Connected Car Market Segmentation Overview-By Application
3.1.1 Infotainment Systems
3.1.1.1 Infotainment Systems Analysis
3.1.1.2 Connected Car Market, by Application
3.1.1.3 Navigation Systems Analysis
3.1.1.4 Telematics Systems
3.1.1.5 Telematics System Analysis
4 Overview of Connected Car Services and Applications
4.1 Safety and Security Services
5 Connected Car Devices
5.1 OEM Connected Car Solutions-Applications Overview
5.2 Global Connected Car Market 2019
6 Drivers, Restraints and Challenges for the Global Connected Car Market
6.1.1 Drivers
6.1.2 Restraints and Challenges
7 Global Connected Car Market Trends 2017
7.1 Shared Data Plans To Reduce The Number Of Data Subscriptions Per User
7.2 Growing Popularity Of LTE Data Connections In Cars Will Pave The Way For Ethernet Adoption
7.3 Increase In Popularity Of Predictive Driving Through Contextual Help Function
7.4 Big Data Platform Provided By Connected Cars To Push Further Developments
7.5 Adoption Of Android OS In The Automotive Infotainment Market
8 Five Force Analysis of the Connected Car Market 2019
8.1 Opportunities for Service Providers
9 Value Chain For The Connected Car Market
10 Leading 20 Connected Car Companies
10.1 Leading 20 Companies Ranking in the Connected Car Market
10.2 Composition of the Connected Car Market in 2017
10.3 Leading 10 OEM Ranking in the Connected Car Market 2018
10.4 Leading 10 Non-OEM Ranking in the Connected Car Market 2018
11 Top 20 Connected Car Company Profiles
11.1 Samsung
11.1.1 Samsung Revenue, by Geographic Region, 2017 and Revenue & Y-o-Y Growth, 2015-2017
11.1.2 Samsung Revenue, by Business Segment, 2017 and Research & Development, 2015-2017
11.1.3 Samsung Connected Car Offerings
11.1.4 Samsung Developments
11.1.5 Samsung Analysis
11.2 Apple
11.2.1 Apple Revenue, by Geographic Region, 2017 and Revenue & Y-o-Y Growth, 2015-2017
11.2.2 Apple Revenue, by Business Segment, 2017 and Research & Development, 2015-2017
11.2.3 Apple Developments
11.2.4 Apple Analysis
11.3 AT&T
11.3.1 AT&T revenue, by Geographic Region, 2017 and Revenue & Y-o-Y Growth, 2015-2017
11.3.2 AT&T Revenue, by Business Segment, 2017
11.3.3 AT&T Offering & Recent Development
11.3.4 AT&T Analysis
11.4 BMW AG
11.4.1 BMW AG Revenue, by Geographic Region, 2017 and Revenue & Y-o-Y Growth, 2015-2017
11.4.2 BMW AG Revenue, by Business Segment, 2017 and Research & Development, 2015-2017
11.4.3 BMW AG Developments
11.4.4 BMW AG Analysis
11.5 Broadcom Limited
11.5.1 Broadcom Limited Revenue, by Geographic Region, 2017 and Revenue & Y-o-Y Growth, 2015-2017
11.5.2 Broadcom Limited Revenue, by Business Segment, 2017 and Research & Development, 2015-2017
11.5.3 Broadcom Limited Analysis
11.6 Daimler
11.6.1 Daimler Revenue, by Geographic Region, 2017 and Revenue & Y-o-Y Growth, 2015-2017
11.6.2 Daimler Revenue, by Business Segment, 2017 and Research & Development, 2015-2017
11.6.3 Daimler Developments-
11.6.4 Daimler Analysis
11.7 Fiat Chrysler Automobiles Group
11.7.1 Fiat Chrysler Automobiles Revenue, by Geographic Region, 2017 and Revenue & Y-o-Y Growth, 2015-2017
11.7.2 Fiat Chrysler Automobiles Revenue, by Business Segment, 2017 and Research & Development, 2015-2017
11.7.3 Fiat Chrysler Automobiles Recent Developments
11.7.4 Fiat Chrysler Automobiles group Analysis
11.8 Ford Motor Company
11.8.1 Ford Motor Revenue, by Geographic Region, 2017 and Revenue & Y-o-Y Growth, 2015-2017
11.8.2 Ford Motor Revenue, by Business Segment, 2017 and Research & Development, 2015-2017
11.8.3 Ford Motor Recent Developments
11.8.4 Ford Motor Company Analysis
11.9 General Motors
11.9.1 General Motors Revenue, by Geographic Region, 2017 and Revenue & Y-o-Y Growth, 2015-2017
11.9.2 General Motors Research & Development, 2015-2017
11.9.3 General Motors Recent Developments
11.9.4 General Motors Analysis
11.10 Honda Motor
11.10.1 Honda Motors Revenue, by Geographic Region, and Revenue & Y-o-Y Growth, 2015-20172017and Revenue & Y-o-Y Growth, 2015-2017
11.10.2 Honda Motors Revenue, by Business Segment, 2017and Research & Development, 2015-2017
11.10.3 Honda Motors Recent Developments
11.10.4 Honda Motors Analysis
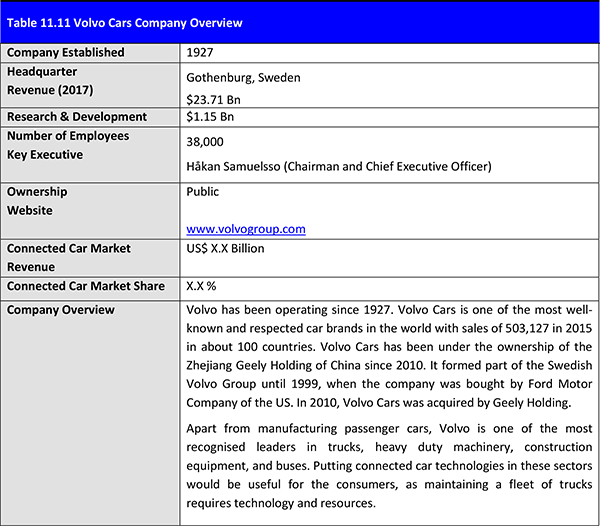
11.11 Volvo Cars
11.11.1 Volvo Cars Revenue, by Geographic Region, 2017 and Revenue & Y-o-Y Growth, 2015-2017
11.11.2 Volvo Cars Revenue, by Business Segment, 2017 and Research & Development, 2015-2017
11.11.3 Volvo Cars Recent Developments
11.11.4 Volvo Cars Corporation Analysis
11.12 Tech Mahindra.
11.12.1 Tech Mahindra. Revenue, by Geographic Region, 2017 and Revenue & Y-o-Y Growth, 2015-2017
11.12.2 Tech Mahindra Revenue, by Business Segment, 2017 and Research & Development, 2015-2017
11.12.3 Tech Mahindra Recent Developments
11.12.4 Tech Mahindra Analysis
11.13 Tesla Motors.
11.13.1 Tesla Motors Revenue, by Geographic Region, 2018 and Revenue & Y-o-Y Growth, 2015-2017
11.13.2 Tesla Motor Revenue, by segment, 2018 and Research & Development, 2015-2017
11.13.3 Tesla Motors Recent Developments
11.13.4 Tesla Motors Analysis
11.14 Qualcomm Incorporated
11.14.1 Qualcomm Inc. Revenue, by Geographic Region, 2017, and Revenue & Y-o-Y Growth, 2015-2017
11.14.2 Qualcomm Inc. Revenue, by Business Segment 2017, and Research & Development, 2015-2017
11.14.3 Qualcomm Inc. Recent Developments
11.14.4 Qualcomm Analysis
11.15 Sierra Wireless
11.15.1 Sierra Wireless Revenue, by Geographic Region, 2017 and Revenue & Y-o-Y Growth, 2015-2017
11.15.2 Sierra Wireless Revenue, by Business Segment, 2017 and Research & Development, 2015-2017
11.15.3 Sierra Wireless Recent Developments
11.15.4 Sierra Wireless Analysis
11.16 Toyota
11.16.1 Toyota Revenue, by Geographic Region, 2017 and Revenue & Y-o-Y Growth, 2015-2017
11.16.2 Toyota Revenue, by End Application, 2017 and Research & Development, 2015-2017
11.16.3 Toyota Recent Developments
11.16.4 Toyota Analysis
11.17 Verizon Communications
11.17.1 Verizon Communications Revenue & Y-o-Y Growth, 2015-2017
11.17.2 Verizon Communications Revenue, by Business Segment, 2017
11.17.3 Verizon Communications Recent Developments
11.17.4 Verizon Communications Analysis
11.18 Visteon Corporation
11.18.1 Visteon Corporation Revenue, by Geographic Region, 2017 and Revenue & Y-o-Y Growth, 2015-2017
11.18.2 Visteon Corporation Revenue, by Business Segment, 2017 and Research & Development, 2015-2017
11.18.3 Visteon Corporation Recent Developments
11.18.4 Visteon Corporation Analysis
11.19 Volkswagen
11.19.1 Volkswagen Revenue, by Business Segment, 2017 and Research & Development, 2015-2017
11.19.2 Volkswagen Revenue, by Business Segment, 2017 and Research & Development, 2015-2017
11.19.3 Volkswagen Recent Developments
11.19.4 Volkswagen Analysis
11.20 Google
11.20.1 Google Revenue, by Geographic Region, 2017 and Revenue & Y-o-Y Growth, 2015-2017
11.20.2 Google Revenue, by Business Segment, 2017 and Research & Development, 2015-2017
11.20.3 Google Recent Developments
12 SWOT Analysis of the Connected Car Market- By Type of Connectivity
12.1 SWOT Analysis of the Embedded Solutions Submarket 2019
12.2 SWOT Analysis of the Integrated Solutions Submarket 2019
12.3 SWOT Analysis of the Tethered Solutions Submarket 2019
13 Conclusion
13.1 Global Connected Car Market 2018
13.2 Opportunities in the Connected Car Market 2018
13.3 Leading 10 Non-OEM Ranking in the Connected Car Market 2017
14 Glossary
Appendix A
Appendix B
List of Tables
Table 1.1 Companies Profiled in this Report and Country HQ
Table 2.1 Connected Car Market Size Overview 2019-2029 (US$ Bn)
Table 2.2 Embedded Solutions Submarket Drivers & Restraints
Table 2.3 Integrated Solutions Submarket Drivers & Restraints
Table 2.4 Tethered Solutions Submarket Drivers & Restraints
Table 4.1 Connected Car Services and Applications Overview 2019
Table 5.1 Connected Car Devices Overview 2019
Table 5.2 OEM Connected Car Telematics Solutions by Application (Feature, OnStar, mbrace2, BMW Assist, Lexus Enform, Toyota Entune, Ford Sync3, Infinity Connection)
Table 6.1 Global Connected Car Market Drivers, Restraints and Challenges
Table 6.2 Global Connected Car – BRIC Countries Connectivity Solutions Brief
Table 6.3 Global Connected Car – Automotive Infotainment Software Platforms
Table 8.1 Five Forces Analysis of the Connected Car Market 2019
Table 9.1 Value chain For The Connected Car Market
Table 10.1 Ranking of the Leading 20 Connected Car Companies 2018 ($bn, %)
Table 10.2 Ranking of the Leading 10 Connected Car OEMs 2018 ($bn, %)
Table 10.3 Ranking of the Leading 10 Connected Car Non-OEMs 2018 ($bn, %)
Table 11.1 Samsung Electronics Co., Ltd. Overview
Table 11.2 Apple Inc. Overview2015-2017
Table 11.3 AT&T Overview11.6 AT&T Revenue, by Business Segment, 2017 (%
Table 11.4 BMW AG Overview, 2015-2017 (US$ Bn), 2015-2017
Table 11.5 Broadcom Limited Overview& Development, 2015-2017 (US$ Mn), 2015-
Table 11.6 Daimler Overview, 2015-2017 (US$ Bn), 2015-2017
Table 11.7 Fiat Chrysler Automobiles Overview, 2015-2017
Table 11.8 Ford Motor Company Overview, 2015-2017
Table 11.9 General Motors Company Overview (US$ Bn), 2015-2017
Table 11.10 Honda Motor Company Overview, 2015-2017
Table 11.11 Volvo Cars Company Overview
Table 11.12 Tech Mahindra Company Overview, 2015-2017
Table 11.13 Tesla Motors Company Overview
Table 11.14 Qualcomm Inc. Overview, 2015-2017
Table 11.15 Sierra Wireless Overview, 2015-2017
Table 11.16 Toyota Overview11.32 Revenue, by End Application, 2017 and
Table 11.17 Verizon Communication Overview, 2015-2017
Table 11.18 Visteon Corporation Overview, 2015-2017
Table 11.19 Volkswagen Overview, 2015-2017
Table 11.20 Google Company Overview201
Table 12.1 SWOT Analysis of the Embedded Solutions Submarket 2019
Table 12.2 SWOT Analysis of the Integrated Solutions Submarket 2019
Table 12.3 SWOT Analysis of the Tethered Solutions Submarket 2019
Table 13.1 Global Connected Car Market Challenges
Table 13.2 Ranking of the Leading 10 Connected Car Non-OEMs 2018 ($bn, %)
List of Figures
Figure 2.1 Connected Car Definition and Applications
Figure 2.2 Connected Car Ecosystem
Figure 2.3 Connected Car Market Breakdown
Figure 2.4 Connected Car Market Structure by Type of Connectivity
Figure 3.1 Connected Car Market Structure by Application
Figure 5.1 Global Passenger Car Shipped with Connectivity 2019-2029 (Millions of Units)
Figure 10.1 Market Share Ranking of the Leading 20 Connected Car Companies 2018 (%)
Figure 11.1 Samsung Revenue, by Geographic Region, 2017 (% Share) and Revenue & Y-o-Y Growth, 2015-2017 (US$ Bn, Y-o-Y %)
Figure 11.2 Samsung Revenue, by Business Segment, 2017 (% Share) and Research & Development, 2015-2017 (US$ Bn), 2015-2017
Figure 11.3 Apple Revenue, by Geographic Region, 2017 (% Share) and Revenue & Y-o-Y Growth, 2015-2017 (US$ Bn, Y-o-Y %)
Figure 11.4 Apple, by Business Segment, 2017 (% Share) and Research & Development, 2015-2017 (US$ Mn), 2015-2017
Figure 11.5 AT&T Revenue, by Geographic Region, 2017 (% Share) and Revenue & Y-o-Y Growth, 2015-2017 (US$ Bn, Y-o-Y %)
Figure 11.6 AT&T Revenue, by Business Segment, 2017 (% Share)
Figure 11.7 BMW AG, by Geographic Region, 2017 (% Share) and Revenue & Y-o-Y Growth, 2015-2017 (US$ Bn, Y-o-Y %)
Figure 11.8 BMW AG Revenue, by Business Segment, 2017 (% Share) and Research & Development, 2015-2017 (US$ Bn), 2015-2017
Figure 11.9 Broadcom Limited Revenue, by Geographic Region, 2017 (% Share) and Revenue & Y-o-Y Growth, 2015-2017 (US$ Bn, Y-o-Y %)
Figure 11.10 Broadcom Limited Revenue, by Business Segment, 2017 (% Share) and Research & Development, 2015-2017 (US$ Mn), 2015-2017
Figure 11.11 Daimler Revenue, by Geographic Region, 2017 (% Share) and Revenue & Y-o-Y Growth, 2015-2017 (US$ Bn, Y-o-Y %)
Figure 11.12 Daimler Revenue, by Business Segment, 2017 (% Share) and Research & Development, 2015-2017 (US$ Bn), 2015-2017
Figure 11.13 Fiat Chrysler Automobiles Revenue, by Geographic Region, 2017 (% Share) and Revenue & Y-o-Y Growth, 2015-2017 (US$ Bn, Y-o-Y %)
Figure 11.14 Fiat Chrysler Automobiles Revenue, by Business Segment, 2017 and Research & Development, 2015-2017
Figure 11.15 Ford Motor Revenue, by Geographic Region, 2017 (% Share) and Revenue & Y-o-Y Growth, 2015-2017 (US$ Bn, Y-o-Y %)
Figure 11.16 Ford Motor Revenue, by Business Segment, 2017 and Research & Development, 2015-2017
Figure 11.17 General Motors Revenue, by Geographic Region, 2017 (% Share) and Revenue & Y-o-Y Growth, 2015-2017 (US$ Bn, Y-o-Y %)
Figure 11.18 General Motors Revenue, by Business Segment, 2017 (% Share) and Research & Development, 2017 (US$ Bn), 2015-2017
Figure 11.19 Honda Motors Revenue, by Geographic Region, 2017 and Revenue & Y-o-Y Growth, 2015-2017
Figure 11.20 Honda Motors Revenue, by Business Segment, 2017 and Research & Development, 2015-2017
Figure 11.21 Volvo Cars Revenue, by Geographic Region, 2017 and Revenue & Y-o-Y Growth, 2015-2017
Figure 11.22 Volvo Cars Revenue, by Business Segment, 2017 and Research & Development, 2015-2017
Figure 11.23 Tech Mahindra. Revenue, by Geographic Region, 2017 and Revenue & Y-o-Y Growth, 2015-2017
Figure 11.24 Tech Mahindra Revenue, by Business Segment, 2017 and Research & Development, 2015-2017
Figure 11.25 Tesla Motors Revenue, by Geographic Region, 2018 and Revenue & Y-o-Y Growth, 2015-2017
Figure 11.26 Tesla Motor Revenue, by product, 2018 and Research & Development, 2015-2017
Figure 11.27 Qualcomm Inc. Revenue, by Geographic Region, 2017, and Revenue & Y-o-Y Growth, 2015-2017
Figure 11.28 Qualcomm Inc. Revenue, by Business Segment, 2017 and Research & Development, 2015-2017
Figure 11.29 Sierra Wireless Revenue, by Geographic Region 2017, and Revenue & Y-o-Y Growth, 2015-2017
Figure 11.30 Sierra Wireless Revenue, by Business Segment 2017, and Research & Development, 2015-2017
Figure 11.31 Revenue, by Geographic Region, 2017 and Revenue & Y-o-Y Growth, 2015-2017
Figure 11.32 Revenue, by End Application, 2017 and Research & Development, 2015-2017
Figure 11.33 Verizon Communications Revenue, by Geographic Region, 2017 and Revenue & Y-o-Y Growth, 2015-2017
Figure 11.34 Verizon Communications Revenue, by Business Segment, 2017 and Research & Development, 2015-2017
Figure 11.35 Visteon Corporation Revenue, by Geographic Region, 2017 and Revenue & Y-o-Y Growth, 2015-2017
Figure 11.36 Visteon Corporation Revenue, by Business Segment, 2017 and Research & Development, 2015-2017
Figure 11.37 Volkswagen Revenue, by Geographic Region, 2017 and Revenue & Y-o-Y Growth, 2015-2017
Figure 11.38 Volkswagen Revenue, by Business Segment, 2017 and Research & Development, 2015-2017
Figure 11.39 Google Revenue, by Geographic Region, 2017 and Revenue & Y-o-Y Growth, 2015-2017
Figure 11.40 Google Revenue, by Segment, 2017 and Research and development expenditure, 2015-2017
Accenture
Alibaba A.I. Labs
Aioi Nissay Dowa Insurance Co., Ltd.
Alphabet
Alpine Electronics
Amazon
American Honda Motor, Co. Inc.
Apple Inc.
AT&T Inc.
Audi AG
Autoliv Development AB.
Autonomic
Avis Budget Group
Baidu
Bertrandt
Blackberry
BMW AG
Bosch
BRAIQ
Broadcom Corporation
Brocade Communications Systems Inc
Calico
CapitalG
car2go
CarForce
Carvoyant:
Complex IT
Continental
Cruise
CSC
Daimler AG
Daimler Financial Services AG
Daimler Mobility Services
Daimler Trucks & Buses
Daimler Trucks North America (DTNA)
Datang Telecom Group
DeepMap
Delphi
Delphi Automotive
Denso
DidiChuxing
Dominos
DriveNow
DynaOptics
EBS
Ericsson
EXO Technologies
ExxonMobil
Facebook
Fiat Chrysler Automobiles (FCA)
Ford Motor Company
Ford Smart Mobility LLC
Freescale Semiconductor
Fuse
Garmin
Geely Auto
Geely Holding
General Motors Co.(GM)
Geotab
Google Fiber
Google Inc.
Grab Holdings Inc.
GV
Harman International
Honda Motor Company
Honda R&D Co., Ltd
Honeywell
Hughes Telematics (HTI)
Hyundai
IBM
INE Corporation
In-Motion Technology
INRIX
Intel
Jaguar Land Rover (JLR)
JapanTaxi Co., Ltd.
KDDI Corporation
KIA
Land Rover
LeddarTech
LG
LG Display
Lightbridge Communications Corporation
Lyft, Inc.
Mahindra & Mahindra Ltd (M&M Ltd)
Mahindra Group
MapAnyhting Inc.
Matterne
Maven
Mazda
Mercedes-Benz
Mercedes-Benz Cars & Vans
Mercedes-Benz Connectivity Services GmbH
Mercedes-Benz Vans
Microsoft Corporation
Mitsubishi Corporation
Mitsubishi Electric
Mobileye
MOG
moovel
MS&AD Insurance Group
mytaxi
NETGEAR
Nippon Telegraph and Telephone Corporation (NTT)
Nissan
Nokia
NVidia
NXP Semiconductor
OnStar
OYO Corporation
Panasonic
Panasonic Corporation of North America
Pandora
Parkmobile LLC
Parkopedia
Peugeot Scooters
Pioneer Electronics
Porsche
Postmates
PSA Peugeot -Citroen
QNX Software Systems
Qualcomm Inc.
Qualcomm Technologies
Qualcomm Wireless Communication Technologies (China) Limited
Renault
Renesas Electronics
Resser
Sagecom
Salesforce Ventures Portfolio
Samsung Electronics Co., Ltd.
Servco Pacific (Servco)
Sidecar
Sierra Wireless
Siroop
SOFGEN Holdings
SoftBank
Spotify
Subaru
Suzuki Motor Corporation
Tactual Labs
Tech Mahindra Ltd.
Tesla Grohmann Automation GmbH
Tesla Motors
TomTom
Toyota Connected (TC)
Toyota Connected Europe (TCEU)
Toyota Connected North America Inc. (TCNA)
Toyota Motor Corporation
Toyota Motor Europe
Toyota Research Institute (TRI)
Twitter
Uber Technologies Inc.
Vauxhall
Verily
Verizon Communications
Verizon Telematics
Verizon Wireless
Via
ViaVan
Visteon Corporation
Volkswagen AG
Volkswagen Group
Volvo Car Corporation
VW
Wavecom
Waymo
WayRay
X
Yelp
Zenuity AB
Zipcar
Zotye
Zubie
Organisations mentioned
American Center for Mobility
Bridge Alliance
China Academy of Telecommunications Technology (CATT)
Colorado Department of Transportation (CDOT)
Connected Car Consortium
Department of Motor Vehicles, CA
European Commission
Frankfurt Airport
Hamburg Airport
Intelligent Transportation Society of America
Michigan Department of Transportation
National Highway Traffic Safety Administration (NHTSA)
Open Automotive Alliance
Shanghai Municipal Commission of Economy and Informatization
Shanghai Municipal Public Security Bureau
Shanghai Municipal Transportation Commission
SmartDeviceLink Consortium
U.S. Department of Transportation (DOT)