Industries > Automotive > Automotive Embedded Software Market Report 2019-2029
Automotive Embedded Software Market Report 2019-2029
Forecasts for Tool (Compilers, Real-Time Operating System (RTOS), Debuggers, and Assemblers), Operating System (Microsoft, Blackberry QNX, Genivi (Linux Based), Android OS and Others), End User (Advanced Driver-Assistance System (ADAS), Connected Car and Autonomous Vehicles), Application (Engine Management System (EMS), Anti-Lock Braking System (ABS), Airbag Control, Car Navigation System, Music System, and others) and Geography (North America, Europe, Asia Pacific, Middle East and Africa and Latin America)
• Do you need definitive Automotive Embedded Software market data?
• Succinct Automotive Embedded Software market analysis?
• Technological insight?
• Clear competitor analysis?
• Actionable business recommendations?
Read on to discover how this definitive report can transform your own research and save you time.
The growth of the global Automotive Embedded Software market is fueled by various factors. There are extensive advancements taking place in the automotive sector coupled with an increasing trend of integrating smart technologies and IoT in modern day vehicles. This is supported by a growing number of initiatives taken by various governments to propel the growth of electric vehicles across regions. The market is further driven by the ongoing industrial developments in the emerging economies of the Middle East and Asia-Pacific regions these factors have led Visiongain to publish this timely report. The market for Automotive Embedded Software market is expected to be valued at US$ 2.39 billion in 2019. However, factors such as Design constraints on real time embedded software and Real-Time Technical Challenges are likely to challenge the Automotive Embedded Software market during the forecast period. If you want to be part of this growing industry, then read on to discover how you can maximize your investment potential.
Report highlights
286 quantitative tables, charts, and graphs
Analysis of key players in Automotive Embedded Software technologies
• NXP Semiconductors
• STMicroelectronics
• Luxoft Company
• MSC Software Corporation
• Intel Corporation
• Microsoft Corporation
• Mitsubishi Electric Corporation
• AdvanTech Corporation
• IBM Corporation
• Denso Corporation
• Robert Bosch
• Panasonic
• Texas Instruments
• BlackBerry QNX
• Continental AG
• Aptiv PLC
Global Automotive Embedded Software market outlook and analysis from 2019-2029
Automotive Embedded Software Application forecasts and analysis from 2019-2029
• Engine Management System Automotive Embedded Software Market Forecast 2019-2029
• Anti-lock Braking System Automotive Embedded Software Market Forecast 2019-2029
• Car Navigation System Automotive Embedded Software Market Forecast 2019-2029
• Music System Automotive Embedded Software Market Forecast 2019-2029
• Others Automotive Embedded Software Market Forecast 2019-2029
• Automotive Embedded Software Tool, analysis and potential from 2019-2029
• Compilers forecast 2019-2029
• Real-time operating system (RTOS) forecast 2019-2029
• Debuggers forecast 2019-2029
• Assemblers forecast 2019-2029
Regional Automotive Embedded Software market forecasts from 2019-2029
North America
• US Automotive Embedded Software forecast 2019-2029
• Canada Automotive Embedded Software forecast 2019-2029
• Mexico Automotive Embedded Software forecast 2019-2029
Europe
• UK Automotive Embedded Software forecast 2019-2029
• France Automotive Embedded Software forecast 2019-2029
• Italy Automotive Embedded Software forecast 2019-2029
• Germany Automotive Embedded Software forecast 2019-2029
• Sweden Automotive Embedded Software forecast 2019-2029
• Rest of Europe Automotive Embedded Software forecast 2019-2029
Asia Pacific
• China Automotive Embedded Software forecast 2019-2029
• India Automotive Embedded Software forecast 2019-2029
• Japan Automotive Embedded Software forecast 2019-2029
• Taiwan Automotive Embedded Software forecast 2019-2029
• South Korea Automotive Embedded Software forecast 2019-2029
• Rest of Asia Pacific Automotive Embedded Software forecast 2019-2029
MEA
• South Africa Automotive Embedded Software forecast 2019-2029
• UAE Automotive Embedded Software forecast 2019-2029
• Rest of Middle East and Africa Automotive Embedded Software forecast 2019-2029
Latin America
• Brazil Automotive Embedded Software forecast 2019-2029
• Rest of Latin America Automotive Embedded Software forecast 2019-2029
Key questions answered
• What does the future hold for the Automotive Embedded Software industry?
• Where should you target your business strategy?
• Which industry should you focus upon?
• Which disruptive technologies should you invest in?
• Which companies should you form strategic alliances with?
• Which company is likely to succeed and why?
• What business models should you adopt?
• What industry trends should you be aware of?
Target audience
• Leading Automotive Embedded Software companies
• Suppliers
• Contractors
• Technologists
• R&D staff
• Consultants
• Analysts
• CEO’s
• CIO’s
• COO’s
• Business development managers
• Investors
• Governments
• Agencies
• Industry organizations
• Banks
Visiongain is a trading partner with the US Federal Government
CCR Ref number: KD4R6
1.1 Global Automotive Embedded Software Market Overview
1.2 Why You Should Read This Report
1.3 How This Report Delivers
1.4 Key Questions Answered By This Analytical Report Include
1.5 Who Is This Report For?
1.6 Methodology
1.6.1 Secondary Research
1.6.2 Market Evaluation & Forecasting Methodology
1.7 Frequently Asked Questions (FAQ)
1.8 Associated Visiongain Reports
1.9 About Visiongain
2. Introduction to the Automotive Embedded Software Market
2.1 Objectives of the Study
2.2 Market Definition
2.2.1 Automotive Embedded Software Market at a Glance:
2.3 Currency
2.4 Assumptions
3. Research Methodology
3.1 Data Collection
3.2 Secondary Data
3.3 Market Size Estimation
4. Global Automotive Embedded Software Market 2019-2029
5. Market Dynamics of the Automotive Embedded Software Market
5.1 Introduction
5.2 Drivers of the Automotive Embedded Software Market
5.2.1 Technological Advancement
5.2.2 Increasing application of embedded software in the automobile industry
5.2.3 Increasing demand for embedded software with multi-core technologies and embedded graphics
5.3 Restraints of the Automotive Embedded Software Market
5.3.1 Design constraints on real time embedded software
5.4 Opportunities of the Automotive Embedded Software Market
5.4.1 Continuing evolution of Internet of Things (IoT)
5.5 Challenges of the Automotive Embedded Software Market
5.5.1 Real-Time Technical Challenges
6. Global Automotive Embedded Software Market, By Tool 2019-2029
6.1 Introduction
6.1.1 Automotive Embedded Software Market Tool Segment Revenue Matrix
6.1.2 Automotive Embedded Software Market Tool Share Analysis
6.2 Compilers
6.3 Real-time operating system (RTOS)
6.4 Debuggers
6.5 Assemblers
7. Global Automotive Embedded Software Market, By Operating System (OS) 2019-2029
7.1 Introduction
7.1.1 Automotive Embedded Software Market Operating System Segment Revenue Matrix
7.1.2 Automotive Embedded Software Market Operating System Share Analysis
7.2 Microsoft
7.3 Blackberry QNX
7.4 Genivi (Linux Based)
7.5 Android OS
7.6 Others
8. Global Automotive Embedded Software Market, By End User 2018-2029
8.1 Introduction
8.1.1 Automotive Embedded Software Market End User Segment Revenue Matrix
8.1.2 Automotive Embedded Software Market End User Market Share Analysis
8.2 Advanced Driver-Assistance System (ADAS)
8.3 Connected Car
8.4 Autonomous Vehicles
9. Global Automotive Embedded Software Market, By Application 2019-2029
9.1 Introduction
9.1.1 Automotive Embedded Software Market Application Segment Revenue Matrix
9.1.2 Automotive Embedded Software Market Application Market Share Analysis
9.2 Engine Management System (EMS)
9.3 Anti-lock Braking System (ABS)
9.4 Airbag Control
9.5 Car Navigation System
9.6 Music System
9.7 Others
10. Global Automotive Embedded Software Market, By Geography 2019-2029
10.1 Introduction
10.1.1 Automotive Embedded Software Market, Geography Segment Revenue Matrix
10.1.2 Automotive Embedded Software Market, Geography Market Share Analysis
10.2 North America Automotive Embedded Software Market 2019-2029
10.2.1 US Automotive Embedded Software Market 2019-2029
10.2.2 Canada Automotive Embedded Software Market 2019-2029
10.2.3 Mexico Automotive Embedded Software Market 2019-2029
10.3 Europe Automotive Embedded Software Market 2019-2029
10.3.1 UK Automotive Embedded Software Market 2019-2029
10.3.2 France Automotive Embedded Software Market 2019-2029
10.3.3 Italy Automotive Embedded Software Market 2019-2029
10.3.4 Germany Automotive Embedded Software Market 2019-2029
10.3.5 Sweden Automotive Embedded Software Market 2019-2029
10.3.6 Rest of Europe Automotive Embedded Software Market 2019-2029
10.4 Asia Pacific Automotive Embedded Software Market 2019-2029
10.4.1 China Automotive Embedded Software Market 2019-2029
10.4.2 India Automotive Embedded Software Market 2019-2029
10.4.3 Japan Automotive Embedded Software Market 2019-2029
10.4.4 Taiwan Automotive Embedded Software Market 2019-2029
10.4.5 South Korea Automotive Embedded Software Market 2019-2029
10.4.6 Rest of Asia Pacific Automotive Embedded Software Market 2019-2029
10.5 Middle East and Africa Automotive Embedded Software Market 2019-2029
10.5.1 South Africa Automotive Embedded Software Market 2019-2029
10.5.2 UAE Automotive Embedded Software Market 2019-2029
10.5.3 Rest of Middle East and Africa Automotive Embedded Software Market 2019-2029
10.6 Latin America Automotive Embedded Software Market 2019-2029
10.6.1 Brazil Automotive Embedded Software Market 2019-2029
10.6.2 Rest of Latin America Automotive Embedded Software Market 2019-2029
11. Company Profiles
11.1 Advantech Co. Ltd.
11.1.1 Advantech Co. Ltd. Revenue, by Geographic Region, 2017 and Revenue & Y-o-Y Growth, 2015-2017
11.1.2 Advantech Co. Ltd. Revenue, by Business Segment, 2017 and Research & Development, 2015-2017
11.1.3 Advantech Co. Ltd. Recent Developments
11.1.4 Advantech Co. Ltd. Analysis
11.2 Aptiv plc
11.2.1 Aptiv Revenue, by Geographic Region, 2017 and Revenue & Y-o-Y Growth, 2015-2017
11.2.2 Aptiv Revenue, by Business Segment, 2017 and Research & Development, 2015-2017
11.2.3 Aptiv’s Automotive Embedded Software Portfolio
11.2.4 Aptiv’s Recent Developments
11.2.5 Aptiv’s Company Analysis
11.3 BlackBerry
11.3.1 BlackBerry Revenue, by Geographic Region, 2018 and Revenue & Y-o-Y Growth, 2016-2018
11.3.2 BlackBerry Revenue, by Business Segment, 2018 and Research & Development, 2016-2018
11.3.3 BlackBerry Recent Developments
11.3.4 BlackBerry Analysis
11.4 Continental AG
11.4.1 Continental Revenue, by Geographic Region, 2017 and Revenue & Y-o-Y Growth, 2015-2017
11.4.2 Continental Revenue, by Geographic Region, 2017 and Revenue & Y-o-Y Growth, 2015-2017
11.4.3 Continental’s Automotive Embedded Software Portfolio
11.4.4 Continental’s Recent Developments
11.4.5 Continental’s Company Analysis
11.5 Denso Corporation
11.5.1 Denso Corporation Revenue, by Geographic Region, 2017 and Revenue & Y-o-Y Growth, 2016-2017
11.5.2 Denso Corporation Revenue, by Business Segment, 2017 and Research & Development, 2016-2018
11.5.3 Denso Corporation Recent Developments
11.5.4 Denso Corporation Analysis
11.6 IBM Corporation
11.6.1 IBM Corporation Revenue, by Geographic Region, 2017 and Revenue & Y-o-Y Growth, 2015-2017
11.6.2 IBM Corporation Revenue, by Business Segment, 2017 and Research & Development, 2015-2017
11.6.3 IBM Corporation Recent Developments
11.6.4 IBM Corporation Analysis
11.7 Intel Corporation
11.7.1 Intel Corporation Revenue, by Geographic Region, 2017 and Revenue & Y-o-Y Growth, 2015-2017
11.7.2 Intel Corporation Revenue, by Business Segment, 2017 and Research & Development, 2015-2017
11.7.3 Intel Corporation Recent Developments
11.7.4 Intel Corporation Analysis
11.8 Luxoft Holding, Inc.
11.8.1 Luxoft Holding, Inc. Revenue, by Geographic Region, 2017 and Revenue & Y-o-Y Growth, 2015-2017
11.8.2 Luxoft Holding, Inc. Revenue, by Business Segment, 2017 and Research & Development, 2015-2017
11.8.3 Luxoft Holding, Inc. Automotive Embedded Portfolio
11.8.4 Luxoft Holding, Inc. Recent Developments
11.8.5 Luxoft Holding, Inc. Company Analysis
11.9 Microsoft Corporation
11.9.1 Microsoft Corporation Revenue, by Geographic Region, 2018 and Revenue & Y-o-Y Growth, 2016-2018
11.9.2 Microsoft Corporation Revenue, by Business Segment, 2018 and Research & Development, 2016-2018
11.9.3 Microsoft Corporation Recent Developments
11.9.4 Microsoft Corporation Analysis
11.10 Mitsubishi Electric Corporation
11.10.1 Mitsubishi Electric Corporation Revenue, by Geographic Region, 2018 and Revenue & Y-o-Y Growth, 2016-2018
11.10.2 Mitsubishi Electric Corporation Revenue, by Business Segment, 2018 and Research & Development, 2016-2018
11.10.3 Mitsubishi Electric Corporation Recent Developments
11.10.4 Mitsubishi Electric Corporation Analysis
11.11 MSC Software Corporation
11.11.1 MSC Software Corporation Analysis
11.12 NXP Semiconductors N.V.
11.12.1 NXP Semiconductors N.V. Revenue, by Geographic Region, 2017 and Revenue & Y-o-Y Growth, 2015-2017
11.12.2 NXP Semiconductors N.V.Revenue, by Business Segment, 2017 and Research & Development, 2015-2017
11.12.3 NXP Semiconductors N.V. Automotive Embedded Portfolio
11.12.4 NXP Semiconductors N.V. Recent Developments
11.12.5 NXP Semiconductors N.V. Company Analysis
11.13 Panasonic
11.13.1 Panasonic Revenue, by Geographic Region, 2017 and Revenue & Y-o-Y Growth, 2015-2017
11.13.2 Panasonic Revenue, by Business Segment, 2017 and Research & Development, 2015-2017
11.13.3 Panasonic’s Automotive Embedded Software Portfolio
11.13.4 Panasonic’s Recent Developments
11.13.5 Panasonic’s company analysis
11.14 Robert Bosch
11.14.1 Robert Bosch Revenue, by Geographic Region, 2017 and Revenue & Y-o-Y Growth, 2015-2017
11.14.2 Robert Bosch Revenue, by Business Segment, 2017 and Research & Development, 2015-2017
11.14.3 Robert Bosch’s Automotive Embedded Software Portfolio
11.14.4 Robert Bosch’s Recent Developments
11.14.5 Robert Bosch’s Company Analysis
11.15 STMicroelectronics
11.15.1 STMicroelectronics Revenue, by Geographic Region, 2017 and Revenue & Y-o-Y Growth, 2015-2017
11.15.2 STMicroelectronics Revenue, by Business Segment, 2017 and Research & Development, 2015-2017
11.15.3 STMicroelectronics Automotive Embedded Portfolio
11.15.4 STMicroelectronics Recent Developments
11.15.5 STMicroelectronics Company Analysis
11.16 Texas Instruments Inc.
11.16.1 Texas Instruments Revenue, by Geographic Region, 2017 and Revenue & Y-o-Y Growth, 2015-2017
11.16.2 Texas Instruments Revenue, by Business Segment, 2017 and Research & Development, 2015-2017
11.16.3 Texas Instruments Automotive Embedded Portfolio
11.16.4 Texas Instruments Recent Developments
11.16.5 Texas Instruments Company Analysis
12. Conclusion
List of Tables
Table 4.1 Global Automotive Embedded Software Market Forecast 2019-2029 (US$bn, AGR %, CAGR %, Cumulative)
Table 6.1 Global Automotive Embedded Software Market, By Tool, 2018-2029 ($mn, AGR %, Cumulative)
Table 6.2 Compilers Automotive Embedded Software Market Forecast 2018-2029 ($mn, AGR %, CAGR %, Cumulative)
Table 6.3 RTOS Automotive Embedded Software Market Forecast 2018-2029 ($mn, AGR %, CAGR %, Cumulative)
Table 6.4 Debuggers Automotive Embedded Software Market Forecast 2019-2029 ($mn, AGR %, CAGR %, Cumulative)
Table 6.5 Assemblers Automotive Embedded Software Market Forecast 2019-2029 ($mn, AGR %, CAGR %, Cumulative)
Table 7.1 Global Automotive Embedded Software Market, By Operating System, 2018-2029 ($mn, AGR %, Cumulative)
Table 7.2 Microsoft Automotive Embedded Software Market Forecast 2018-2029 ($mn, AGR %, CAGR %, Cumulative)
Table 7.3 BlackBerry QNX Automotive Embedded Software Market Forecast 2018 - 2029 ($mn, AGR %, CAGR %, Cumulative)
Table 7.4 Genivi (Linux Based) Automotive Embedded Software Market Forecast 2019-2029 ($mn, AGR %, CAGR %, Cumulative)
Table 7.5 Android OS Automotive Embedded Software Market Forecast 2018-2029 ($mn, AGR %, CAGR %, Cumulative)
Table 7.6 Others Automotive Embedded Software Market Forecast 2018-2029 ($mn, AGR %, CAGR %, Cumulative)
Table 8.1 Global Automotive Embedded Software Market, By End User, 2018-2029 ($mn, AGR %, Cumulative)
Table 8.2 ADAS Automotive Embedded Software Market Forecast 2018-2029 ($mn, AGR %, CAGR %, Cumulative)
Table 8.3 Connected Car Automotive Embedded Software Market Forecast 2018-2029 (US$mn, AGR %, CAGR %, Cumulative)
Table 8.4 Autonomous Vehicles Automotive Embedded Software Market Forecast 2018-2029 ($mn, AGR %, CAGR %, Cumulative)
Table 9.1 Global Automotive Embedded Software Market, By Application, 2019-2029 ($mn, AGR %, Cumulative)
Table 9.2: Engine Management System Automotive Embedded Software Market Forecast 2019-2029 ($mn, AGR %, CAGR %, Cumulative)
Table 9.3 Anti-lock Braking System Automotive Embedded Software Market Forecast 2019-2029 ($mn, AGR %, CAGR %, Cumulative)
Table 9.4: Airbag Control Automotive Embedded Software Market Forecast 2019-2029 ($mn, AGR %, CAGR %, Cumulative)
Table 9.5 Car Navigation System Automotive Embedded Software Market Forecast 2019-2029 ($mn, AGR %, CAGR %, Cumulative)
Table 9.6 Music System Automotive Embedded Software Market Forecast 2019-2029 ($mn, AGR %, CAGR %, Cumulative)
Table 9.7 Others Automotive Embedded Software Market Forecast 2019-2029 ($mn, AGR %, CAGR %, Cumulative)
Table 10.1 Global Automotive Embedded Software Market Revenue Forecast by Region 2018 - 2029 ($bn, AGR %, Cumulative)
Table 10.2: North American Automotive Embedded Software Market Forecast 2018-2029 (US$mn, AGR %, CAGR %, Cumulative)
Table 10.3 North American Automotive Embedded Software Market by Country 2018-2029 (US$mn, CAGR%)
Table 10.4 North American Automotive Embedded Software Market by Tool, 2019-2029 (US$mn, CAGR%)
Table 10.5 North American Automotive Embedded Software Market by Operating System, 2018-2029 (US$mn, CAGR%)
Table 10.6 North American Automotive Embedded Software Market by Application, 2018-2029 (US$mn, CAGR%)
Table 10.7 North American Automotive Embedded Software Market by End User, 2018-2029 (US$mn, CAGR%)
Table 10.8 US Automotive Embedded Software Market Forecast 2018-2029 (US$mn, AGR %, CAGR %, Cumulative)
Table 10.9 Canada Automotive Embedded Software Market Forecast 2018-2029 (US$mn, AGR %, CAGR %, Cumulative)
Table 10.10 Mexico Automotive Embedded Software Market Forecast 2018-2029 (US$mn, AGR %, CAGR %, Cumulative)
Table 10.11 European Automotive Embedded Software Market Forecast 2018-2029 (US$mn, AGR %, CAGR %, Cumulative)
Table 10.12 European Automotive Embedded Software’s (AGV) Market Forecast by Country 2018-2029 (US$mn, CAGR%)
Table 10.13 European Automotive Embedded Software Market by Tool, 2018-2029 (US$mn, CAGR%)
Table 10.14 European Automotive Embedded Software Market by Operating System, 2018-2029 (US$mn, CAGR%)
Table 10.15 European Automotive Embedded Software Market by Application, 2018-2029 (US$mn, CAGR%)
Table 10.16 European Automotive Embedded Software Market by End User, 2019-2029 (US$mn, CAGR%)
Table 10.17 UK Automotive Embedded Software Market Forecast 2018-2029 (US$mn, AGR %, CAGR %, Cumulative)
Table 10.18 France Automotive Embedded Software Market Forecast 2018-2029 (US$mn, AGR %, CAGR %, Cumulative)
Table 10.19 Italy Automotive Embedded Software Market Forecast 2018-2029 (US$mn, AGR %, CAGR %, Cumulative)
Table 10.20 Germany Automotive Embedded Software Market Forecast 2018-2029 (US$mn, AGR %, CAGR %, Cumulative)
Table 10.21 Sweden Automotive Embedded Software Market Forecast 2018-2029 (US$mn, AGR %, CAGR %, Cumulative)
Table 10.22 Rest of Europe Automotive Embedded Software Market Forecast 2018-2029 (US$mn, AGR %, CAGR %, Cumulative)
Table 10.23 Asian Automotive Embedded Software Market Forecast 2018-2029 (US$mn, AGR %, CAGR %, Cumulative)
Table 10.24 Asian Automotive Embedded Softwares (AGV) Market Forecast by Country 2018-2029 (US$mn, CAGR%)
Table 10.25 Asian Automotive Embedded Software Market by Tool, 2018-2029 (US$mn, CAGR%)
Table10.26 Asian Automotive Embedded Software Market by Operating System, 2019-2029 (US$mn, CAGR%)
Table 10.27 Asian Automotive Embedded Software Market by Application, 2018-2029 (US$mn, CAGR%)
Table 10.28 Asian Automotive Embedded Software Market by End User, 2018-2029 (US$mn, CAGR%)
Table 10.29 China Automotive Embedded Software Market Forecast 2018-2029 (US$mn, AGR %, CAGR %, Cumulative)
Table 10.30 India Automotive Embedded Software Market Forecast 2018-2029 (US$mn, AGR %, CAGR %, Cumulative)
Table 10.31 Japan Automotive Embedded Software Market Forecast 2018-2029 (US$mn, AGR %, CAGR %, Cumulative)
Table 10.32 Taiwan Automotive Embedded Software Market Forecast 2018-2029 (US$mn, AGR %, CAGR %, Cumulative)
Table 10.33 South Korea Automotive Embedded Software Market Forecast 2018-2029 (US$mn, AGR %, CAGR %, Cumulative)
Table 10.34 Rest of Asia Pacific Automotive Embedded Software Market Forecast 2018-2029 (US$mn, AGR %, CAGR %, Cumulative)
Table 10.35 Middle East and African Automotive Embedded Software Market Forecast 2018-2029 (US$mn, AGR %, CAGR %, Cumulative)
Table 10.36 Middle East and African Automotive Embedded Softwares (AGV) Market Forecast by Country 2018-2029 (US$mn, CAGR%)
Table 10.37 Middle East and African Automotive Embedded Software Market by Tool, 2019-2029 (US$mn, CAGR%)
Table 10.38 Middle East and African Automotive Embedded Software Market by Operating System, 2018-2029 (US$mn, CAGR%)
Table 10.39 Middle East and African Automotive Embedded Software Market by Application, 2019-2029 (US$mn, CAGR%)
Table 10.40 Middle East and African Automotive Embedded Software Market by End User, 2018-2029 (US$mn, CAGR%)
Table 10.41 South African Automotive Embedded Software Market Forecast 2018-2029 (US$mn, AGR %, CAGR %, Cumulative)
Table 10.42 UAE Automotive Embedded Software Market Forecast 2018-2029 (US$mn, AGR %, CAGR %, Cumulative)
Table 10.43 Rest of Middle East and African Automotive Embedded Software Market Forecast 2018-2029 (US$mn, AGR %, CAGR %, Cumulative)
Table 10.44 Latin American Automotive Embedded Software Market Forecast 2018-2029 (US$mn, AGR %, CAGR %, Cumulative)
Table 10.45 Latin American Automotive Embedded Softwares (AGV) Market Forecast by Country 2018-2029 (US$mn, CAGR%)
Table 10.46 Latin American Automotive Embedded Software Market by Tool, 2018-2029 (US$mn, CAGR%)
Table 10.47. Latin American Automotive Embedded Software Market by Operating System, 2018-2029 (US$mn, CAGR%)
Table 10.48 Latin American Automotive Embedded Software Market by Application, 2019-2029 (US$mn, CAGR%)
Table 10.49 Latin American Automotive Embedded Software Market by End User, 2019-2029 (US$mn, CAGR%)
Table 10.50 Brazil Automotive Embedded Software Market Forecast 2019-2029 (US$mn, AGR %, CAGR %, Cumulative)
Table 10.51 Rest of Latin American Automotive Embedded Software Market Forecast 2019-2029 (US$mn, AGR %, CAGR %, Cumulative)
Table 11.1 Advantech Co. Ltd. Overview
Table 11.2 Aptiv plc Overview
Table 11.3 BlackBerry Overview
Table 11.4 Continental Company Overview
Table 11.5 Denso Corporation Overview
Table 11.6 IBM Corporation Overview
Table 11.7 Intel Corporation Overview
Table 11.8 Luxoft Holding, Inc. Overview
Table 11.9 Microsoft Corporation Overview
Table 11.10 Mitsubishi Electric Corporation Overview
Table 11.11 MSC Software Corporation Overview
Table 11.12 NXP Semiconductors N.V. Overview
Table 11.13 Panasonic Company Overview
Table 11.14 Robert Bosch Company Overview
Table 11.15 STMicroelectronics Company Overview
Table 11.16 Texas Instruments Inc. Company Overview
List of Figures
Figure 1.1: Example of Automotive Embedded Software Market by Submarket Forecast 2019-2029 (US$m, AGR %)
Figure 4.1 Global Automated Guided Vehicles (AGV) Market Forecast 2019-2029 (US$ Billion)
Figure 6.1 Global Automotive Embedded Software Market Forecast by Tool, 2018-2029 (US$mn)
Figure 6.2: Global Automotive Embedded Software Market by Tool Share Forecast 2019 (%)
Figure 6.3: Global Automotive Embedded Software Market by Tool Share Forecast 2024 (%)
Figure 6.4: Global Automotive Embedded Software Market by Tool Share Forecast 2029 (%)
Figure 6.5: Compilers Automotive Embedded Software Market Forecast 2018-2029 (US$mn, AGR %)
Figure 6.6: RTOS Automotive Embedded Software Market Forecast 2018-2029 (US$mn, AGR %)
Figure 6.7: Debuggers Automotive Embedded Software Market Forecast 2019-2029 (US$mn, AGR %)
Figure 6.8: Assemblers Automotive Embedded Software Market Forecast 2019-2029 (US$mn, AGR %)
Figure 7.1 Global Automotive Embedded Software Market Forecast by Operating System, 2018-2029 (US$mn)
Figure 7.2: Global Automotive Embedded Software Market by Operating System Share Forecast 2019 (%)
Figure 7.3: Global Automotive Embedded Software Market by Operating System Share Forecast 2024 (%)
Figure 7.4: Global Automotive Embedded Software Market by Operating System Share Forecast 2029 (%)
Figure 7.5: Microsoft Automotive Embedded Software Market Forecast 2018 - 2029 (US$mn, AGR %)
Figure 7.6: BlackBerry QNX Automotive Embedded Software Market Forecast 2018 - 2029 (US$mn, AGR %)
Figure 7.7: Genivi (Linux Based) Automotive Embedded Software Market Forecast 2019-2029 (US$mn, AGR %)
Figure 7.8: Android OS Automotive Embedded Software Market Forecast 2018-2029 (US$mn, AGR %)
Figure 7.9: Others Automotive Embedded Software Market Forecast 2018-2029 (US$mn, AGR %)
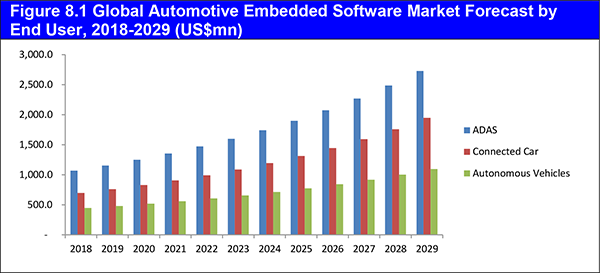
Figure 8.1 Global Automotive Embedded Software Market Forecast by End User, 2018-2029 (US$mn)
Figure 8.2: Global Automotive Embedded Software Market by End User Share Forecast 2019 (%)
Figure 8.3: Global Automotive Embedded Software Market by End User Share Forecast 2024 (%)
Figure 8.4: Global Automotive Embedded Software Market by End User Share Forecast 2029 (%)
Figure 8.5: ADAS Automotive Embedded Software Market Forecast 2019-2029 (US$mn, AGR %)
Figure 8.6: Connected Car Automotive Embedded Software Market Forecast 2018-2029 (US$mn, AGR %)
Figure 8.7: Autonomous Vehicles Automotive Embedded Software Market Forecast 2018-2029 (US$mn, AGR %)
Figure 9.1 Global Automotive Embedded Software Market Forecast by Application, 2018-2029 (US$mn)
Figure 9.2: Global Automotive Embedded Software Market by Application Share Forecast 2019 (%)
Figure 9.3: Global Automotive Embedded Software Market by Application Share Forecast 2024 (%)
Figure 9.4: Global Automotive Embedded Software Market by Application Share Forecast 2029 (%)
Figure 9.5: Engine Management System Automotive Embedded Software Market Forecast 2019-2029 (US$mn, AGR %)
Figure 9.6: Anti-lock Braking System Automotive Embedded Software Market Forecast 2018-2029 (US$mn, AGR %)
Figure 9.7: Airbag Control Automotive Embedded Software Market Forecast 2018-2029 (US$mn, AGR %)
Figure 9.8: Car Navigation System Automotive Embedded Software Market Forecast 2019-2029 (US$mn, AGR %)
Figure 9.9: Music System Automotive Embedded Software Market Forecast 2018-2029 (US$mn, AGR %)
Figure 9.10: Others Automotive Embedded Software Market Forecast 2019-2029 (US$mn, AGR %)
Figure 10.1: Global Automotive Embedded Software Market Forecast 2018-2029 (US$mn)
Figure 10.2: Global Automotive Embedded Software Market Share Forecast 2019 (%)
Figure 10.3: Global Automotive Embedded Software Market Share Forecast 2024 (%)
Figure 10.4: Global Automotive Embedded Software Market Share Forecast 2029 (%)
Figure 10.5: North American Automotive Embedded Software Market Forecast 2019-2029 (US$m, AGR %)
Figure 10.6: North American Automotive Embedded Software Market Forecast by Country 2018-2029 (US$mn)
Figure 10.7: North American Automotive Embedded Software Market Share Forecast by Country 2019 (%)
Figure 10.8: North American Automotive Embedded Software Market Share Forecast by Country 2024 (%)
Figure 10.9: North American Automotive Embedded Software Market Share Forecast by Country 2029 (%)
Figure 10.10: North American Automotive Embedded Software Market Forecast by Tool 2019-2029 (US$mn)
Figure 10.11: North American Automotive Embedded Software Market Share Forecast by Tool 2019 (%)
Figure 10.12: North American Automotive Embedded Software Market Share Forecast by Tool 2024 (%)
Figure 10.13: North American Automotive Embedded Software Market Share Forecast by Tool 2029 (%)
Figure 10.14: North American Automotive Embedded Software Market Forecast by Operating System 2019-2029 (US$mn)
Figure 10.15: North American Automotive Embedded Software Market Share Forecast by Operating System 2019 (%)
Figure 10.16: North American Automotive Embedded Software Market Share Forecast by Operating System 2024 (%)
Figure 10.17 North American Automotive Embedded Software Market Share Forecast by Operating System 2029 (%)
Figure 10.18: North American Automotive Embedded Software Market Forecast by Application 2019-2029 (US$mn)
Figure 10.19: North American Automotive Embedded Software Market Share Forecast by Application 2019 (%)
Figure 10.20: North American Automotive Embedded Software Market Share Forecast by Application 2024 (%)
Figure 10.21: North American Automotive Embedded Software Market Share Forecast by Application 2029 (%)
Figure 10.22: North American Automotive Embedded Software Market Forecast by End User 2019-2029 (US$mn)
Figure 10.23: North American Automotive Embedded Software Market Share Forecast by End User 2019 (%)
Figure 10.24: North American Automotive Embedded Software Market Share Forecast by End User 2024 (%)
Figure 10.25: North American Automotive Embedded Software Market Share Forecast by End User 2029 (%)
Figure 10.26: US Automotive Embedded Software Market Forecast 2019-2029 (US$mn, AGR %)
Figure 10.27: Canada Automotive Embedded Software Market Forecast 2018-2029 (US$mn, AGR %)
Figure 10.28: Mexico Automotive Embedded Software Market Forecast 2018-2029 (US$mn, AGR %)
Figure 10.29: European Automotive Embedded Software Market Forecast 2018-2029 (US$m, AGR %)
Figure 10.30: European Automotive Embedded Software Market Forecast by Country 2018-2029 (US$mn)
Figure 10.31: European Automotive Embedded Software Market Share Forecast by Country 2019 (%)
Figure 10.32: European Automotive Embedded Software Market Share Forecast by Country 2024 (%)
Figure 10.33: European Automotive Embedded Software Market Share Forecast by Country 2029 (%)
Figure 10.34: European Automotive Embedded Software Market Forecast by Tool 2018-2029 (US$mn)
Figure 10.35: European Automotive Embedded Software Market Share Forecast by Tool 2019 (%)
Figure 10.36: European Automotive Embedded Software Market Share Forecast by Tool 2024 (%)
Figure 10.37: European Automotive Embedded Software Market Share Forecast by Tool 2029 (%)
Figure 10.38: European Automotive Embedded Software Market Forecast by Operating System 2018-2029 (US$mn)
Figure 10.39: European Automotive Embedded Software Market Share Forecast by Operating System 2019 (%)
Figure 10.40: European Automotive Embedded Software Market Share Forecast by Operating System 2024 (%)
Figure 10.41: European Automotive Embedded Software Market Share Forecast by Operating System 2029 (%)
Figure 10.42: European Automotive Embedded Software Market Forecast by Application 2018-2029 (US$mn)
Figure 10.43: European Automotive Embedded Software Market Share Forecast by Application 2019 (%)
Figure 10.44: European Automotive Embedded Software Market Share Forecast by Application 2024 (%)
Figure 10.45: European Automotive Embedded Software Market Share Forecast by Application 2029 (%)
Figure 10.46: European Automotive Embedded Software Market Forecast by End User 2018-2029 (US$mn)
Figure 10.47: European Automotive Embedded Software Market Share Forecast by End User 2019 (%)
Figure 10.48: European Automotive Embedded Software Market Share Forecast by End User 2024 (%)
Figure 10.49: European Automotive Embedded Software Market Share Forecast by End User 2029 (%)
Figure 10.50: UK Automotive Embedded Software Market Forecast 2018-2029 (US$m, AGR %)
Figure 10.51: France Automotive Embedded Software Market Forecast 2018-2029 (US$mn, AGR %)
Figure 10.52: Italy Automotive Embedded Software Market Forecast 2018-2029 (US$mn, AGR %)
Figure 10.53: Germany Automotive Embedded Software Market Forecast 2018-2029 (US$m, AGR %)
Figure 10.54: Sweden Automotive Embedded Software Market Forecast 2018-2029 (US$mn, AGR %)
Figure 10.55: Rest of Europe Automotive Embedded Software Market Forecast 2018-2029 (US$mn, AGR %)
Figure 10.56: Asian Automotive Embedded Software Market Forecast 2018-2029 (US$m, AGR %)
Figure 10.57: Asian Automotive Embedded Software Market Forecast by Country 2018-2029 (US$mn)
Figure 10.58: Asian Automotive Embedded Software Market Share Forecast by Country 2019 (%)
Figure 10.59: Asian Automotive Embedded Software Market Share Forecast by Country 2024 (%)
Figure 10.60: Asian Automotive Embedded Software Market Share Forecast by Country 2029 (%)
Figure 10.61: Asian Automotive Embedded Software Market Forecast by Tool 2018-2029 (US$mn)
Figure 10.62: Asian Automotive Embedded Software Market Share Forecast by Tool 2019 (%)
Figure 10.63: Asian Automotive Embedded Software Market Share Forecast by Tool 2024 (%)
Figure 10.64: Asian Automotive Embedded Software Market Share Forecast by Tool 2029 (%)
Figure 10.65: Asian Automotive Embedded Software Market Forecast by Operating System, 2018-2029 (US$mn)
Figure 10.66: Asian Automotive Embedded Software Market Share Forecast by Operating System, 2019 (%)
Figure 10.67: Asian Automotive Embedded Software Market Share Forecast by Operating System, 2024 (%)
Figure 10.68: Asian Automotive Embedded Software Market Share Forecast by Operating System, 2029 (%)
Figure 10.69: Asian Automotive Embedded Software Market Forecast by Application 2018-2029 (US$mn)
Figure 10.70: Asian Automotive Embedded Software Market Share Forecast by Application 2019 (%)
Figure 10.71: Asian Automotive Embedded Software Market Share Forecast by Application 2024 (%)
Figure 10.72: Asian Automotive Embedded Software Market Share Forecast by Application 2029 (%)
Figure 10.73: Asian Automotive Embedded Software Market Forecast by End User 2018-2029 (US$mn)
Figure 10.74: Asian Automotive Embedded Software Market Share Forecast by End User 2019 (%)
Figure 10.75: Asian Automotive Embedded Software Market Share Forecast by End User 2024 (%)
Figure 10.76: Asian Automotive Embedded Software Market Share Forecast by End User 2029 (%)
Figure 10.77: China Automotive Embedded Software Market Forecast 2018-2029 (US$mn, AGR %)
Figure 10.78: India Automotive Embedded Software Market Forecast 2018-2029 (US$m, AGR %)
Figure 10.79: Japan Automotive Embedded Software Market Forecast 2018-2029 (US$m, AGR %)
Figure 10.80: Taiwan Automotive Embedded Software Market Forecast 2018-2029 (US$m, AGR %)
Figure 10.81: South Korea Automotive Embedded Software Market Forecast 2018-2029 (US$m, AGR %)
Figure 10.82: Rest of Asia Pacific Automotive Embedded Software Market Forecast 2018-2029 (US$m, AGR %)
Figure 10.83: Middle East and African Automotive Embedded Software Market Forecast 2018-2029 (US$m, AGR %)
Figure 10.84: Middle East and African Automotive Embedded Software Market Forecast by Country 2019-2029 (US$mn)
Figure 10.85: Middle East and African Automotive Embedded Software Market Share Forecast by Country 2019 (%)
Figure 10.86: Middle East and African Automotive Embedded Software Market Share Forecast by Country 2024 (%)
Figure 10.87: Middle East and African Automotive Embedded Software Market Share Forecast by Country 2029 (%)
Figure 10.88: Middle East and African Automotive Embedded Software Market Forecast by Tool 2019-2029 (US$mn)
Figure 10.89: Middle East and African Automotive Embedded Software Market Share Forecast by Tool 2019 (%)
Figure 10.90: Middle East and African Automotive Embedded Software Market Share Forecast by Tool 2024 (%)
Figure 10.91: Middle East and African Automotive Embedded Software Market Share Forecast by Tool 2029 (%)
Figure 10.92: Middle East and African Automotive Embedded Software Market Forecast by Operating System 2018-2029 (US$mn)
Figure 10.93: Middle East and African Automotive Embedded Software Market Share Forecast by Operating System 2019 (%)
Figure 10.94: Middle East and African Automotive Embedded Software Market Share Forecast by Operating System 2024 (%)
Figure 10.95: Middle East and African Automotive Embedded Software Market Share Forecast by Operating System 2029 (%)
Figure 10.96: Middle East and African Automotive Embedded Software Market Forecast by Application 2019-2029 (US$mn)
Figure 10.97: Middle East and African Automotive Embedded Software Market Share Forecast by Application 2019 (%)
Figure 10.98: Middle East and African Automotive Embedded Software Market Share Forecast by Application 2024 (%)
Figure 10.99: Middle East and African Automotive Embedded Software Market Share Forecast by Application 2029 (%)
Figure 10.100: Middle East and African Automotive Embedded Software Market Forecast by End User 2018-2029 (US$mn)
Figure 10.101: Middle East and African Automotive Embedded Software Market Share Forecast by End User 2019 (%)
Figure 10.102: Middle East and African Automotive Embedded Software Market Share Forecast by End User 2024 (%)
Figure 10.103: Middle East and African Automotive Embedded Software Market Share Forecast by End User 2029 (%)
Figure 10.104: South African Automotive Embedded Software Market Forecast 2018-2029 (US$m, AGR %)
Figure 10.105: UAE Automotive Embedded Software Market Forecast 2018-2029 (US$m, AGR %)
Figure 10.106: Rest of Middle East and African Automotive Embedded Software Market Forecast 2018-2029 (US$m, AGR %)
Figure 10.107: Latin American Automotive Embedded Software Market Forecast 2018-2029 (US$m, AGR %)
Figure 10.108: Latin American Automotive Embedded Software Market Forecast by Country 2018-2029 (US$mn)
Figure 10.109: Latin American Automotive Embedded Software Market Share Forecast by Country 2019 (%)
Figure 10.110: Latin American Automotive Embedded Software Market Share Forecast by Country 2024 (%)
Figure 10.111 Latin American Automotive Embedded Software Market Share Forecast by Country 2029 (%)
Figure 10.112: Latin American Automotive Embedded Software Market Forecast by Tool 2019-2029 (US$mn)
Figure 10.113: Latin American Automotive Embedded Software Market Share Forecast by Tool 2019 (%)
Figure 10.114: Latin American Automotive Embedded Software Market Share Forecast by Tool 2024 (%)
Figure 10.115: Latin American Automotive Embedded Software Market Share Forecast by Tool 2029 (%)
Figure 10.116: Latin American Automotive Embedded Software Market Forecast by Operating System 2019-2029 (US$mn)
Figure 10.117: Latin American Automotive Embedded Software Market Share Forecast by Operating System 2019 (%)
Figure 10.118: Latin American Automotive Embedded Software Market Share Forecast by Operating System 2024 (%)
Figure 10.119: Latin American Automotive Embedded Software Market Share Forecast by Operating System 2029 (%)
Figure 10.120: Latin American Automotive Embedded Software Market Forecast by Application 2019-2029 (US$mn)
Figure 10.121: Latin American Automotive Embedded Software Market Share Forecast by Application 2019 (%)
Figure 10.122: Latin American Automotive Embedded Software Market Share Forecast by Application 2024 (%)
Figure 10.123: Latin American Automotive Embedded Software Market Share Forecast by Application 2029 (%)
Figure 10.124: Latin American Automotive Embedded Software Market Forecast by End User 2019-2029 (US$mn)
Figure 10.125: Latin American Automotive Embedded Software Market Share Forecast by End User 2019 (%)
Figure 10.126: Latin American Automotive Embedded Software Market Share Forecast by End User 2024 (%)
Figure 10.127: Latin American Automotive Embedded Software Market Share Forecast by End User 2029 (%)
Figure 10.128: Brazil Automotive Embedded Software Market Forecast 2019-2029 (US$m, AGR %)
Figure 10.129 Rest of Latin American Automotive Embedded Software Market Forecast 2019-2029 (US$m, AGR %)
Figure 11.1 Advantech Co. Ltd. Revenue, by Geographic Region, 2017 and Revenue & Y-o-Y Growth, 2015-2017
Figure 11.2 Advantech Co. Ltd. Revenue, by Business Segment, 2017 and Research & Development, 2015-2017
Figure 11.3: Aptiv Revenue, by Geographic Region, 2017 (% Share) and Revenue & Y-o-Y Growth, 2015-2017 (US$ Bn, Y-o-Y %)
Figure 11.4: Aptiv Revenue, by Business Segment, 2017 (% Share) and Research & Development, 2015-2017 (US$ Bn), 2015-2017
Figure 11.5 BlackBerry Revenue, by Geographic Region, 2018 and Revenue & Y-o-Y Growth, 2016-2018
Figure 11.6 BlackBerry Revenue, by Business Segment, 2018 and Research & Development, 2016-2018
Figure 11.7: Continental Revenue, by Geographic Region, 2017 (% Share) and Revenue & Y-o-Y Growth, 2015-2017 (US$ Bn, Y-o-Y %)
Figure 11.8: Continental Revenue, by Business Segment, 2017 (% Share) and Research & Development, 2015-2017 (US$ Bn), 2015-2017
Figure 11.9 Denso Corporation Revenue, by Geographic Region, 2017 and Revenue & Y-o-Y Growth, 2016-2017
Figure 11.10 Denso Corporation Revenue, by Business Segment, 2017 and Research & Development, 2016-2018
Figure 11.11 IBM Corporation Revenue, by Geographic Region, 2017 and Revenue & Y-o-Y Growth, 2015-2017
Figure 11.12 IBM Corporation Revenue, by Business Segment, 2017 and Research & Development, 2015-2017
Figure 11.13 Intel Corporation Revenue, by Geographic Region, 2017 and Revenue & Y-o-Y Growth, 2015-2017
Figure 11.14 Intel Corporation Revenue, by Business Segment, 2017 and Research & Development, 2015-2017
Figure 11.15 Luxoft Holding, Inc Revenue, by Geographic Region, 2017 (% Share) and Revenue & Y-o-Y Growth, 2015-2017 (US$ Bn, Y-o-Y %)
Figure 11.16 Luxoft Holding, Inc.Revenue, by Business Segment, 2017 (% Share) and Research & Development, 2015-2017 (US$ Bn), 2015-2017
Figure 11.17 Microsoft Corporation Revenue, by Geographic Region, 2018 and Revenue & Y-o-Y Growth, 2016-2018
Figure 11.18 Microsoft Corporation Revenue, by Business Segment, 2018 and Research & Development, 2016-2018
Figure 11.19 Mitsubishi Electric Corporation Revenue, by Geographic Region, 2018 and Revenue & Y-o-Y Growth, 2016-2018
Figure 11.20 Mitsubishi Electric Corporation Revenue, by Business Segment, 2018 and Research & Development, 2016-2018
Figure 11.21 NXP Semiconductors N.V. Revenue, by Geographic Region, 2017 (% Share) and Revenue & Y-o-Y Growth, 2015-2017 (US$ Bn, Y-o-Y %)
Figure 11.22 NXP Semiconductors N.V. Revenue, by Business Segment, 2017 (% Share) and Research & Development, 2015-2017 (US$ Bn), 2015-2017
Figure 11.23 Panasonic Revenue, by Geographic Region, 2017 (% Share) and Revenue & Y-o-Y Growth, 2015-2017 (US$ Bn, Y-o-Y %)
Figure 11.24 Panasonic Revenue, by Business Segment, 2017 (% Share) and Research & Development, 2015-2017 (US$ Bn), 2015-2017
Figure 11.25: Robert Bosch Revenue, by Geographic Region, 2017 (% Share) and Revenue & Y-o-Y Growth, 2015-2017 (US$ Bn, Y-o-Y %)
Figure 11.26: Robert Bosch Revenue, by Business Segment, 2017 (% Share) and Research & Development, 2015-2017 (US$ Bn), 2015-2017
Figure 11.27:STMicroelectronics Revenue, by Geographic Region, 2017 (% Share) and Revenue & Y-o-Y Growth, 2015-2017 (US$ Bn, Y-o-Y %)
Figure 11.28: STMicroelectronics Revenue, by Business Segment, 2017 (% Share) and Research & Development, 2015-2017 (US$ Bn), 2015-2017
Figure 11.29: Texas Instruments Revenue, by Geographic Region, 2017 (% Share) and Revenue & Y-o-Y Growth, 2015-2017 (US$ Bn, Y-o-Y %)
Figure 11.30: Texas Instruments Revenue, by Business Segment, 2017 (% Share) and Research & Development, 2015-2017 (US$ Bn), 2015-2017
Figure 12.1: Global Automotive Embedded Software Market Share Analysis, By Operating System (2019)
Adrian Flux
Alibaba
Allianz
Alphabet
Amazon
Apple
Baidu
Bentley
BharatBenz.
BMW
Bosch
BT
Bugatti
Buick
Cadillac
Chevrolet
Chrysler
Continental
Cruise Automation
CSR
Daimler AG
Daimler Buses
Daimler Financial Services
Daimler Trucks
Delphi
Ducati
FAW Group
FCA
Ford Motor Company
Freightliner
FUSO
Garmin
Geely Holding
General Motors (GM)
General Motors Financial Company, Inc. (GM Financial)
Gett
GM Europe (GME)
GM International Operations (GMIO)
GM North America (GMNA)
GM South America (GMSA)
GMC
HERE Consortium
Hino
Holden
Homegrown
Honda
Lyft
MAN
Mercedes-Benz
Mercedes-Benz Vans
Microsoft
Mitsubishi
Mobileye
Nauto
Netflix
OmniVision
ON Semiconductor
Opel
Otto
Panasonic
Peloton
Porsche
QNX
Qualcomm
ReachNow
Renault Nissan
RIM
Rio Tinto
SAIC
Samsung
Scania
Seat
Skoda
SonSumitomo Electric
Tesla
Thomas Built Buses
TomTom
Toyota Motor Corporation
Toyota Research Institute
Trimble
Uber
UD Trucks
Vauxhall
Velodyne
Verizon
Volkswagen AG
Volkswagen Commercial Vehicles
Volkswagen Electronics Research Laboratory
Volvo Cars USA
Volvo Group
Waymo
Western Star
YAZAKI
Yazaki
Zoom Car
Download sample pages
Complete the form below to download your free sample pages for Automotive Embedded Software Market Report 2019-2029
Related reports
-

Automotive Head-Up Display (HUD) Market Analysis Report 2017-2027
The BMW launch of a new windshield head-up display has led Visiongain to publish this timey report. The $598m automotive...Full DetailsPublished: 03 May 2017 -

3D Printing: Automotive Additive Manufacturing Market Report 2018-2028
NEW automotive market research report focussing on 3D printing applications is available today: Receive global, regional and submarket forecasts, analysis...Full DetailsPublished: 15 January 2018 -

Connected Car Market Report 2019-2029
The latest report from business intelligence provider Visiongain offers comprehensive analysis of the global connected car market. Visiongain assesses that...
Full DetailsPublished: 03 December 2018 -

Automotive Autonomous Emergency Braking (AEB) Systems Market Report 2019-2029
The $3bn AEB market is expected to flourish in the next few years because of government regulations and also because...Full DetailsPublished: 11 March 2019 -

Top 20 Automotive Advanced Driver Assistance Systems (ADAS) Companies 2018
Visiongain assesses that the automotive ADAS technologies market will reach $38.4bn in 2018. If you want to be part of...
Full DetailsPublished: 23 May 2018 -

Automotive Smart Glass Market Report 2019-2029
Visiongain’s comprehensive new 207 page report reveals that the automotive smart glass market will achieve revenues of $798.9m in 2019....Full DetailsPublished: 20 May 2019 -

Top 20 Companies Developing Autonomous Vehicles (AV) Technologies 2018
This report independently evaluates the top 20 players developing autonomous vehicles technologies providing the reader with an objective overview of...Full DetailsPublished: 16 October 2018 -

Automotive Advanced Driver Assistance Systems (ADAS) Market Report 2018-2028
The world market for Automotive Advanced Driver Assistance Systems (ADAS) will record revenues of $38.4bn in 2018.
...Full DetailsPublished: 06 July 2018 -

Automotive Night Vision Systems (NVS) Market Report 2019-2029
Night vision systems (NVS) are one part of the growing adoption of broader Advanced Driver Assistance Systems (ADAS). Night vision...Full DetailsPublished: 10 April 2019 -

Wireless Electric Vehicle Charging (WEVC) Market Report 2019-2029
The increase in the price of petrol and diesel over the years across the globe has increased the demand for...Full DetailsPublished: 23 August 2019
Download sample pages
Complete the form below to download your free sample pages for Automotive Embedded Software Market Report 2019-2029
Do you have any custom requirements we can help you with?
Any specific country, geo region, market segment or specific company information?
Email us today, we can discuss your needs and see how we can help: jamie.roberts@visiongain.com
Would you like a free report overview of the report of your choice?
If so, please drop an email to Jamie Roberts stating your chosen report title to jamie.roberts@visiongain.com
Visiongain automotive reports are compiled using a broad and rich mixture of both primary and secondary information to produce an overall industry outlook. In order to provide our clients with the best product possible product, we do not rely on any one single source of information. Visiongain analysts reach out to market-leading vendors and automotive industry experts but also review a wealth of financial data and product information from a vast range of sources. To find out more about our reports methodology please email jamie.roberts@visiongain.com
Would you like to get the latest Visiongain automotive reports catalogue?
What are the dynamic growth sectors? where are the regional business opportunities?
Which technologies will prevail and who are the leading companies succeeding in these sectors and why?
If you want definitive answers to business critical questions, discover Visiongain’s full range of business intelligence reports.
If so, please email Jamie Roberts on jamie.roberts@visiongain.com or call her today on +44 207 336 6100
Alliance of Automobile Manufacturers (USA)
Association of Russian Automakers
Audio Video Bridging (AVB)
China Association Of Automoblie Manufacturers
European Association of Automotive Suppliers
European Automobile Manufacturers’ Association
European Council for Automotive Research and Development
Former Society of Automotive Engineers
German Association of the Automotive Industry
International Organization of Motor Vehicle Manufacturers
In-Vehicle Infotainment (IVI)
Italian Association of the Automotive Industry
Japan Automobile Manufacturers Association
One-Pair Ether-Net
Society of Indian Automobile Manufacturers (SIAM)
Society of Motor Manufacturers and Traders
The International Council For Clean Transport
US National Highway Traffic Safety Administration
Don’t Miss Out!
Subscribe to receive the latest Industry news, trending insight and analysis straight to your inbox.Choose your preferences:
Latest Automotive news
Hydrogen Vehicle Market
The global Hydrogen Vehicle market was valued at US$23.34 billion in 2023 and is projected to grow at a CAGR of 22.7% during the forecast period 2024-2034.
17 May 2024
Autonomous Vehicle Market
The global Autonomous Vehicle market was valued at US$35.4 billion in 2023 and is projected to grow at a CAGR of 22.7% during the forecast period 2024-2034.
16 May 2024
Automotive Infotainment Market
The global Automotive Infotainment market is estimated at US$20.2 billion in 2023 and is projected to grow at a CAGR of 6.3% during the forecast period 2024-2034.
14 May 2024
Automotive Cyber Security Market
The global Automotive Cyber Security market was valued at US$2,991.6 million in 2024 and is projected to grow at a CAGR of 19.4% during the forecast period 2024-2034.
13 May 2024
