Industries > Automotive > Automotive Autonomous Emergency Braking (AEB) Systems Market Report 2019-2029
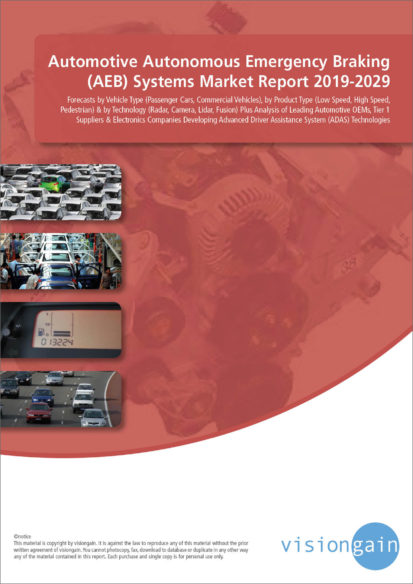
Automotive Autonomous Emergency Braking (AEB) Systems Market Report 2019-2029
Forecasts by Vehicle Type (Passenger Cars, Commercial Vehicles), by Product Type (Low Speed, High Speed, Pedestrian) & by Technology (Radar, Camera, Lidar, Fusion) Plus Analysis of Leading Automotive OEMs, Tier 1 Suppliers & Electronics Companies Developing Advanced Driver Assistance System (ADAS) Technologies
• Do you need definitive AEB market data?
• Succinct AEB market analysis?
• Technological insight?
• Clear competitor analysis?
• Actionable business recommendations?
Read on to discover how this definitive report can transform your own research and save you time.
The upcoming government mandates on mandatory fitment of Autonomous Emergency Braking (AEB) technologies has led Visiongain to publish this timely report. AEB technologies are part of the broader suite of technologies known as Advanced Driver Assistance System (ADAS) Technologies which are considered to be part of the incremental roadmap towards semi-autonomous and fully autonomous vehicles.
The $3bn AEB market is expected to flourish in the next few years because of government regulations and also because consumer awareness is expected to feed through in the latter part of the decade driving growth to new heights. If you want to be part of this growing industry, then read on to discover how you can maximise your investment potential.
Report highlights
• 232 tables, charts, and graphs
• Analysis of key players in AEB technologies
• Continental
• Bosch
• Denso
• Autoliv
• Valeo
• ZF Friedrichshafen AG
• Aisin Seiki
• Delphi
• Magna
• Hyundai Mobis
• Analysis of key automotive OEMs
• BMW
• Toyota
• Ford
• General Motors
• Daimler
• Global Autonomous Emergency Braking Market Outlook And Analysis From 2019-2029
• AEB Vehicle Type Forecasts And Analysis From 2019-2029
• Passenger Car Forecast 2019-2029
• Commercial Vehicle Forecast 2019-2029
• AEB Technology Forecasts And Analysis From 2019-2029
• Radar Forecast 2019-2029
• Lidar Forecast 2019-2029
• Camera Forecast 2019-2029
• Fusion Forecast 2019-2029
• AEB Product Type Forecasts And Analysis From 2019-2029
• Low Speed Forecast 2019-2029
• High Speed Forecast 2019-2029
• Pedestrian Forecast 2019-2029
• Regional AEB Market Forecasts From 2019-2029
North America AEB Forecast 2019-2029
• US AEB Forecast 2019-2029,
• Canada AEB Forecast 2019-2029
• Mexico AEB Forecast 2019-2029
Europe AEB Forecast 2019-2029
• Germany AEB Forecast 2019-2029
• UK AEB Forecast 2019-2029
• France AEB Forecast 2019-2029
• Italy AEB Forecast 2019-2029
• Rest of the World AEB Forecast 2019-2029
Asia Pacific AEB Forecast 2019-2029
• South Korea AEB Forecast 2019-2029
• China AEB Forecast 2019-2029
• Japan AEB Forecast 2019-2029
• India AEB Forecast 2019-2029
• Rest of Asia Pacific AEB Forecast 2019-2029
Rest of the World AEB Forecast 2019-2029
• Russia AEB Forecast 2019-2029
• Brazil AEB Forecast 2019-2029
• Others AEB Forecast 2019-2029
Key questions answered
• How is the AEB Market evolving?
• What is driving and restraining AEB Market dynamics?
• Which AEB submarket will be the main driver of the overall market from 2019-2029?
• What are the technological, regulatory and policy challenges ?
• Who are the leading players and what are their prospects over the forecast period?
Target audience
• Automotive OEMs
• Tier 1 suppliers
• AEB suppliers
• Electronics companies
• Software developers
• Autonomous / AI developers
• Technologists
• R&D staff
• Consultants
• Market analysts
• Senior executives
• Business development managers
• Banks
• Investors
• Governments
• Agencies
• Industry organisations
• Regulators
Visiongain is a trading partner with the US Federal Government
CCR Ref number: KD4R6
1.1 Autonomous Emergency Braking Market Overview
1.2 Why You Should Read This Report
1.3 How This Report Delivers
1.4 Key Questions Answered by This Analytical Report Include:
1.5 Who is This Report For?
1.6 Methodology
1.6.1 Secondary Research
1.6.2 Market Evaluation & Forecasting Methodology
1.7 Frequently Asked Questions (FAQ)
1.8 Associated Visiongain Reports
1.9 About Visiongain
2. Introduction to the AEB Market
2.1 AEB Market Structure
2.2 Market Definition
2.3 Autonomous Emergency Braking Market by Product Definitions
2.3.1 Low speed AEB Submarket Definition
2.3.2 High speed AEB Submarket Definition
2.3.3 Pedestrian AEB Submarket Definition
2.4 Autonomous Emergency Braking Market by Technology Definitions
2.4.1 Radar Based Submarket Definition
2.4.2 LIDAR Based Submarket Definition
2.4.3 Camera Based Submarket Definition
2.4.4 Fusion based Submarket Definition
2.5 Autonomous Emergency Braking Market by Vehicle Definitions
2.5.1 Passenger Cars Based Submarket Definition
2.5.2 Commercial Vehicle Based Submarket Definition
3. Autonomous Emergency Braking Market 2019-2029
3.1 Autonomous Emergency Braking Market Forecast 2019-2029
3.2 Autonomous Emergency Braking Drivers & Restraints
3.2.1 Autonomous Emergency Braking Market Drivers 2019
3.2.1.1 Government Mandates For Safety
3.2.1.2 Increasing Investments Towards Semi-Autonomous And Autonomous Vehicles
3.2.1.3 Technology Innovations Make AEB A Strong Product Differentiator
3.2.2 Autonomous Emergency Braking Market Restraints 2019
3.2.2.1 Complexity and Cost Pressure
3.2.2.2 Limited Functionality of Sensors
3.2.2.3 Frequent Changes Required In Technology
4. Autonomous Emergency Braking Submarket Forecast 2019-2029
4.1 Autonomous Emergency Braking Vehicle Type Forecast 2019-2029
4.1.1 AEB Passenger Cars Forecast by Region 2019-2029
4.1.2 AEB Commercial Vehicles Forecast by Region 2019-2029
4.2 Autonomous Emergency Braking Product Forecast 2019-2029
4.2.1 Low Speed Autonomous Emergency Braking Market Forecast by Region 2019-2029
4.2.2 High Speed Autonomous Emergency Braking Market Forecast 2019-2029
4.2.2 Pedestrian Autonomous Emergency Braking Market Forecast 2019-2029
4.3 Autonomous Emergency Braking Technology Forecast 2019-2029
4.3.1 Radar Autonomous Emergency Braking Forecast 2019-2029
4.3.2 Camera Autonomous Emergency Braking Forecast 2019-2029
4.3.3 Lidar Autonomous Emergency Braking Forecast 2019-2029
4.3.4 Fusion Autonomous Emergency Braking Forecast 2019-2029
5 Leading Regional Autonomous Emergency Braking Markets Forecast 2019-2029
5.1 Overview of Regional Autonomous Emergency Braking Market Forecast
5.2 North America Autonomous Emergency Braking Market Forecast 2019-2029
5.2.1 North America Autonomous Emergency Braking Vehicle Type Market Forecast 2019-2029
5.2.2 North America Autonomous Emergency Braking Product Market Forecast 2019-2029
5.2.3 North America Autonomous Emergency Braking Technology Market Forecast 2019-2029
5.2.4 North America Autonomous Emergency Braking Market Country Forecast 2019-2029
5.3 Europe Autonomous Emergency Braking Market Forecast 2019-2029
5.3.1 Europe Autonomous Emergency Braking Vehicle Type Market Forecast 2019-2029
5.3.2 Europe Autonomous Emergency Braking Product Market Forecast 2019-2029
5.3.3 Europe Autonomous Emergency Braking Technology Market Forecast 2019-2029
5.3.4 Europe Autonomous Emergency Braking Market Country Forecast 2019-2029
5.4 Asia-Pacific Autonomous Emergency Braking Market Forecast 2019-2029
5.4.1 Asia-Pacific Autonomous Emergency Braking Vehicle Type Market Forecast 2019-2029
5.4.2 Asia-Pacific Autonomous Emergency Braking Product Market Forecast 2019-2029
5.4.3 Asia-Pacific Autonomous Emergency Braking Technology Market Forecast 2019-2029
5.4.4 Asia-Pacific Autonomous Emergency Braking Market Country Forecast 2019-2029
5.5 RoW Autonomous Emergency Braking Market Forecast 2019-2029
5.5.1 RoW Autonomous Emergency Braking Vehicle Type Market Forecast 2019-2029
5.5.2 RoW Autonomous Emergency Braking Product Market Forecast 2019-2029
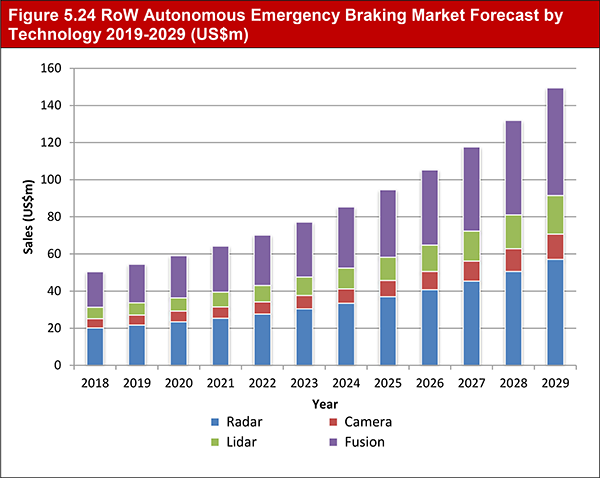
5.5.3 RoW Autonomous Emergency Braking Technology Market Forecast 2019-2029
5.5.4 RoW Autonomous Emergency Braking Market Country Forecast 2019-2029
6 Leading 10 International Autonomous Emergency Braking Companies
6.1 Leading 10 International Autonomous Emergency Braking Companies 2019
6.2 Continental AG
6.2.1 Introduction
6.2.2 Continental AG Total Company Sales 2013 - 2017
6.2.3 Continental AG Sales by Segment of Business 2013-2017
6.2.4 Continental AG Net Income / Loss 2013-2017
6.2.5 Continental AG Sales by Regional Segment of Business 2013-2017
6.2.6 Continental AG Analysis
6.2.6.1 SWOT Analysis
6.2.6.2 Continental AG Future Outlook
6.3 Bosch
6.3.1 Introduction
6.3.2 Bosch Total Company Sales 2013-2017
6.3.3 Bosch Sales by Segment of Business 2013-2017
6.3.4 Bosch Net Income / Loss 2013-2017
6.3.5 Bosch Sales by Regional Segment of Business 2013-2017
6.3.6 Bosch Analysis
6.3.6.1 SWOT Analysis
6.3.6.2 Bosch Future Outlook
6.4 Denso Corporation
6.4.1 Introduction
6.4.2 Denso Corporation Net Income 2013-2017
6.4.3 Denso Corporation Total Company Sales 2013-2017
6.4.4 Denso Corporation Net Income 2013-2017
6.4.5 Denso Corporation Sales by Segment of Business 2015-2017
6.4.6 Denso Corporation Sales by Geographical Location 2015-2017
6.4.7 Denso Corporation Analysis
6.4.7.1 SWOT Analysis
6.4.7.2 Denso Corporation Future Outlook
6.5 Autoliv AB
6.5.1 Introduction
6.5.2 Autoliv AB Total Company Sales 2013-2017
6.5.3 Autoliv AB Net Income 2013-2017
6.5.4 Autoliv Sales by Segment of Business 2015-2017
6.5.5 Autoliv AB Sales by Regional Segment of Business 2013-2017
6.5.6 Autoliv Analysis
6.5.6.1 Autoliv AB SWOT Analysis
6.5.6.2 Autoliv AB Future Outlook
6.6 Valeo
6.6.1 Introduction
6.6.2 Valeo Total Company Sales 2013-2017
6.6.3 Valeo Sales by Segment of Business 2013-2017
6.6.4 Valeo Corporation Sales by Segment of Region 2015-2017
6.6.5 Valeo Analysis
6.6.5.1 Valeo SWOT Analysis
6.6.5.2 Valeo Future Outlook
6.7 ZF Friedrichshafen AG
6.7.1 Introduction
6.7.2 ZF Friedrichshafen AG Total Company Sales 2013-2017
6.7.3 ZF Friedrichshafen AG Net Income 2013-2017
6.7.4 ZF Friedrichshafen AG Sales by Segment of Business 2015-2017
6.7.5 ZF Friedrichshafen AG Sales by Regional Segment of Business 2013-2017
6.7.6 ZF Friedrichshafen AG Analysis
6.7.6.1 ZF Friedrichshafen AG SWOT Analysis
6.7.6.2 ZF Friedrichshafen AG Future Outlook
6.8 Aisin Seiki
6.8.1. Introduction
6.8.2 Aisin Seiki Total Company Sales 2013 - 2017
6.8.3 Aisin Seiki Sales by Segment of Business 2013-2017
6.8.4 Aisin Seiki Net Income / Loss 2013-2017
6.8.5 Aisin Seiki Sales by Regional Segment of Business 2013-2017
6.8.6 Aisin Seiki Analysis
6.8.6.1 SWOT Analysis
6.8.6.2 Aisin Seiki Future Outlook
6.9 Delphi
6.9.1 Introduction
6.9.2 Delphi Total Company Sales 2013 - 2017
6.9.3 Delphi Sales by Segment of Business 2015-2017
6.9.4 Delphi Net Income / Loss 2013-2017
6.9.5 Delphi Sales by Regional Segment of Business 2015-2017
6.9.6 Delphi Analysis
6.9.6.1 SWOT Analysis
6.9.6.2 Delphi Future Outlook
6.10 Magna
6.10.1 Introduction
6.10.2 Magna Total Company Sales 2013 - 2017
6.10.3 Magna Sales by Segment of Business 2013-2017
6.10.4 Magna Net Income / Loss 2013-2017
6.10.5 Magna Sales by Regional Segment of Business 2013-2017
6.10.6 Magna Analysis
6.10.6.1 SWOT Analysis
6.10.6.2 Magna Future Outlook
6.11 Hyundai Mobis
6.11.1 Introduction
6.11.2 Hyundai Mobis Total Company Sales 2014-2018
6.11.3 Hyundai Mobis Sales by Segment of Business 2014-2018
6.11.4 Hyundai Mobis Net Income / Loss 2014-2018
6.11.5 Hyundai Mobis Analysis
6.11.5.1 SWOT Analysis
6.11.5.2 Hyundai Mobis Future Outlook
7. Leading 5 Vehicle Manufacturers Incorporating AEB
7.1 Leading 5 Vehicle Manufacturers Incorporating AEB 2019
7.2 Toyota Motor Company Overview
7.2.1 Toyota’s Role in the AEB Technology
7.2.2 Toyota & V2I Communications Technology
7.3 BMW AG Company Overview
7.3.1 BMW’s Role in the AEB Technology
7.4 Daimler AG Company Overview
7.4.1 Daimler’s Role in the AEB Technology
7.4.2 Daimler and the V2V Technology
7.5 Ford Motor Company Overview
7.5.1 Ford’s Role in the AEB Technology
7.6 General Motors (GM) Company Overview
7.6.1 GM’s Role in the AEB Technology
7.7 Other Prominent Companies in AEB Market
8. Conclusions and Recommendations
9. Glossary
List Of Tables
Table 3.1 Autonomous Emergency Braking Market Forecast 2019-2029 (US$m, AGR %, CAGR %, Cumulative)
Table 3.2 Autonomous Emergency Braking Market Drivers & Restraints 2019
Table 4.1 Autonomous Emergency Braking Vehicle Type Submarket Forecast 2019-2029 (US$m, AGR %, Cumulative)
Table 4.2 AEB Passenger Cars Submarket by Regional Market Forecast 2019-2029 (US$m, AGR %, CAGR %, Cumulative)
Table 4.3 AEB Commercial Vehicles Submarket by Regional Market Forecast 2019-2029 (US$m, AGR %, CAGR %, Cumulative)
Table 4.4 Autonomous Emergency Braking Product Submarket Forecast 2019-2029 (US$m, AGR %, Cumulative)
Table 4.5 Low Speed AEB Submarket by Regional Market Forecast 2019-2029 (US$m, AGR %, CAGR %, Cumulative)
Table 4.6 High Speed AEB Submarket by Regional Market Forecast 2019-2029 (US$m, AGR %, CAGR %, Cumulative)
Table 4.7 Pedestrian AEB Submarket by Regional Market Forecast 2019-2029 (US$m, AGR %, CAGR %, Cumulative)
Table 4.8 Autonomous Emergency Braking Technology Submarket Forecast 2019-2029 (US$m, AGR %, Cumulative)
Table 4.9 Radar AEB Submarket by Regional Market Forecast 2019-2029 (US$m, AGR %, CAGR %, Cumulative)
Table 4.10 Camera AEB Submarket by Regional Market Forecast 2019-2029 (US$m, AGR %, CAGR %, Cumulative)
Table 4.11 Lidar AEB Submarket by Regional Market Forecast 2019-2029 (US$m, AGR %, CAGR %, Cumulative)
Table 4.12 Fusion AEB Submarket by Regional Market Forecast 2019-2029 (US$m, AGR %, CAGR %, Cumulative)
Table 5.1 Autonomous Emergency Braking Market by Regional Submarket Forecast 2019-2029 (US$m, Global AGR %, Cumulative)
Table 5.2 North America Autonomous Emergency Braking Market Forecast 2019-2029 (US$m, AGR %, CAGR %, Cumulative)
Table 5.3 North America Autonomous Emergency Braking Market Forecast by Vehicle Type 2019-2029 (US$m, Cumulative)
Table 5.4 North America Autonomous Emergency Braking Market Forecast by Product 2019-2029 (US$m, Cumulative)
Table 5.5 North America Autonomous Emergency Braking Market Forecast by Technology 2019-2029 (US$m, Cumulative)
Table 5.6 North America Autonomous Emergency Braking Market Forecast by Country 2019-2029 (US$m, AGR %, Cumulative)
Table 5.7 Europe Autonomous Emergency Braking Market Forecast 2019-2029 (US$m, AGR %, CAGR %, Cumulative)
Table 5.8 Europe Autonomous Emergency Braking Market Forecast by Vehicle Type 2019-2029 (US$m, Cumulative)
Table 5.9 Europe Autonomous Emergency Braking Market Forecast by Product 2019-2029 (US$m, Cumulative)
Table 5.10 Europe Autonomous Emergency Braking Market Forecast by Technology 2019-2029 (US$m, Cumulative)
Table 5.11 Europe Autonomous Emergency Braking Market Forecast by Country 2019-2029 (US$m, AGR %, CAGR %, Cumulative)
Table 5.12 Asia Pacific Autonomous Emergency Braking Market Forecast 2019-2029 (US$m, AGR %, CAGR %, Cumulative)
Table 5.13 Asia-Pacific Autonomous Emergency Braking Market Forecast by Vehicle Type 2019-2029 (US$m, CAGR %)
Table 5.14 Asia-Pacific Autonomous Emergency Braking Market Forecast by Product 2019-2029 (US$m, Cumulative)
Table 5.15 Asia-Pacific Autonomous Emergency Braking Market Forecast by Technology 2019-2029 (US$m, Cumulative)
Table 5.16 Asia-Pacific Autonomous Emergency Braking Market Forecast by Country 2019-2029 (US$m, AGR %, CAGR %, Cumulative)
Table 5.17 RoW Autonomous Emergency Braking Market Forecast 2019-2029 (US$m, AGR %, CAGR %, Cumulative)
Table 5.18 RoW Autonomous Emergency Braking Market Forecast by Vehicle Type 2019-2029 (US$m, Cumulative)
Table 5.19 RoW Autonomous Emergency Braking Market Forecast by Product 2019-2029 (US$m, Cumulative)
Table 5.20 RoW Autonomous Emergency Braking Market Forecast by Product 2019-2029 (US$m, Cumulative)
Table 5.21 RoW Autonomous Emergency Braking Market Forecast by Technology 2019-2029 (US$m, Cumulative)
Table 6.1 Leading 10 International Autonomous Emergency Braking Companies (Company, FY 2017 Total Company Sales US$m* Latest, HQ)
Table 6.2 Continental AG Profile 2017 (CEO, Total Company Sales US$m, Net Income US$m, HQ, Founded, No. of Employees, Ticker, Website)
Table 6.3 Continental AG Total Company Sales 2013-2017 (US$m, AGR %)
Table 6.4 Continental AG Sales by Segment of Business 2013-2017 (US$m, AGR %)
Table 6.5 Continental AG Net Income / Loss 2013-2017 (US$m)
Table 6.6 Continental AG Sales by Regional Segment of Business 2013-2017 (US$m, AGR %)
Table 6.7 Continental AG SWOT Analysis
Table 6.8 Bosch Profile 2017 (CEO, Total Company Sales US$m, Net Income US$m, HQ, Founded, No. of Employees, Ticker, Website)
Table 6.9 Bosch, Total Company Sales 2013-2017 (US $m, AGR %)
Table 6.10 Bosch Sales by Segment of Business 2013-2017 (US$m, AGR %)
Table 6.11 Bosch Net Income / Loss 2013-2017 (US$m)
Table 6.12 Bosch Sales by Regional Segment of Business 2013-2017 (US$m, AGR %)
Table 6.13 Bosch SWOT Analysis
Table 6.14 Denso Corporation Profile 2017 (CEO, Total Company Sales US$m, Net Income US$m, HQ, Founded, No. of Employees, Ticker, Website)
Table 6.15 Denso Corporation Net Earnings 2011-2015 (US$m, AGR%)
Table 6.16 Denso Corporation Total Company Sales 2013-2017 (US$m, AGR%)
Table 6.17 Denso Corporation Net Income 2013-2017 (US$m, AGR%)
Table 6.18 Denso Corporation Sales by Segment of Business 2015-2017 (US$m)
Table 6.19 Denso Corporation Sales by Geographical Location 2015-2017 (US$m, AGR%)
Table 6.20 Denso Corporation SWOT Analysis
Table 6.21 Autoliv AB Profile 2017 (CEO, Total Company Sales US$m, Net Income US$m, Net Capital Expenditure US$m, HQ, Founded, IR Contact, Ticker, Website)
Table 6.22 Autoliv AB Total Company Sales 2013-2017 (US$m, AGR%)
Table 6.23 Autoliv AB Net Earnings 2013-2017 (US$m, AGR%)
Table 6.24 Autoliv AB Sales by Segment of Business 2015-2017 (US$m, AGR%)
Table 6.25 Autoliv Sales by Regional Segment of Business 2013-2017 (US$m, AGR %)
Table 6.26 Autoliv AB SWOT Analysis
Table 6.27 Valeo Profile 2017 (CEO, Total Company Sales US$m, Net Income US$m, Net Capital Expenditure US$m, HQ, Founded, IR Contact, Ticker, Website)
Table 6.28 Valeo Total Company Sales 2013-2017 (US$m, AGR%)
Table 6.29 Valeo Sales by Segment of Business 2015-2017 (US$m, AGR%)
Table 6.30 Valeo Sales by Regional Segment of Business 2013-2017 (US$m, AGR%)
Table 6.31 Valeo SWOT Analysis
Table 6.32 ZF Friedrichshafen AG Profile 2017 (CEO, Total Company Sales US$m, Net Income US$m, Net Capital Expenditure US$m, HQ, Founded, IR Contact, Ticker, Website)
Table 6.33 ZF Friedrichshafen AG Total Company Sales 2013-2017 (US$m, AGR%)
Table 6.34 ZF Friedrichshafen AG Net Earnings 2013-2017 (US$m, AGR%)
Table 6.35 ZF Friedrichshafen AG Sales by Segment of Business 2015-2017 (US$m, AGR%)
Table 6.36 ZF Friedrichshafen AG Sales by Regional Segment of Business 2016-2017 (US$m, AGR %)
Table 6.37 ZF Friedrichshafen AG SWOT Analysis
Table 6.38 Aisin Seiki Profile 2017 (CEO, Total Company Sales US$m, Net Income US$m, HQ, Founded, No. of Employees, Ticker, Website)
Table 6.39 Aisin Seiki Total Company Sales 2013-2017 (US$m, AGR %)
Table 6.40 Aisin Seiki Sales by Segment of Business 2013-2017 (US$m, AGR %)
Table 6.41 Aisin Seiki SE Net Income / Loss 2013-2017 (US$m)
Table 6.42 Aisin Seiki Sales by Regional Segment of Business 2013-2017 (US$m, AGR %)
Table 6.43 Aisin Seiki SWOT Analysis
Table 6.44 Delphi Profile 2017 (CEO, Total Company Sales US$m, Net Income US$m, HQ, Founded, No. of Employees, Ticker, Website)
Table 6.45 Delphi Total Company Sales 2013-2017 (US$m, AGR %)
Table 6.46 Delphi Sales by Segment of Business 2015-2017 (US$m, AGR %)
Table 6.47 Delphi Net Income / Loss 2013-2017 (US$m)
Table 6.48 Delphi Sales by Regional Segment of Business 2015-2017 (US$m, AGR %)
Table 6.49 Delphi SWOT Analysis
Table 6.50 Magna Profile 2017 (CEO, Total Company Sales US$m, Net Income US$m, HQ, Founded, No. of Employees, Ticker, Website)
Table 6.51 Magna Total Company Sales 2013-2017 (US$m, AGR %)
Table 6.52 Magna Sales by Segment of Business 2013-2017 (US$m, AGR %)
Table 6.53 Magna Net Income / Loss 2013-2017 (US$m)
Table 6.54 Magna Sales by Regional Segment of Business 2013-2017 (US$m, AGR %)
Table 6.55 Magna SWOT Analysis
Table 6.56 Hyundai Mobis Profile 2018 (CEO, Total Company Sales US$m, Net Income US$m, HQ, Founded, No. of Employees, Ticker, Website)
Table 6.57 Hyundai Mobis Total Company Sales 2014-2018 (US$m, AGR %)
Table 6.58 Hyundai Mobis Sales by Segment of Business 2014-2018 (US$m, AGR %)
Table 6.59 Hyundai Mobis Net Income / Loss 2014-2018 (US$m)
Table 6.60 Hyundai Mobis SWOT Analysis
Table 7.1 Leading 5 Vehicle Manufacturers Incorporating AEB (Company, FY 2017 Total Company Sales US$m* Latest, HQ)
Table 7.2 Toyota Overview (Revenue, HQ, Market Cap, Ticker, No. of Employees, IR, Contact, Website)
Table 7.3 BMW AG Overview (Revenue, No. of Employees, HQ, Ticker, Contact, Website)
Table 7.4 Daimler AG Overview (Revenue, HQ, Ticker, IR, Website)
Table 7.5 Ford Overview (Revenue, HQ, Market Share in Car Sales, No of Employees, Ticker, Contact, Website)
Table 7.6 General Motors Company Overview (Revenue, HQ, Ticker, Contact, Website)
Table 7.7 GM’s Financials 2011-2017 (6-Year Revenue, Gross Profit, Operating Income, Net Income, Diluted EPS), (In $Million Apart from EPS)
Table 7.8 Other Prominent Companies In The AEB Market
List Of Figures
Figure 2.1 AEB Market Segmentation Overview
Figure 3.1 Autonomous Emergency Braking Market Forecast 2019-2029 (US$m, Global AGR %)
Figure 4.1 Autonomous Emergency Braking Vehicle Type Submarket AGR Forecast 2019-2029 (AGR %)
Figure 4.2 Autonomous Emergency Braking Vehicle Type Market Forecast 2019-2029 (US$m, Global AGR %)
Figure 4.3 Autonomous Emergency Braking Vehicle Type Submarket Shares Forecast 2019 (% Share)
Figure 4.4 Autonomous Emergency Braking Vehicle Type Submarket Shares Forecast 2024 (% Share)
Figure 4.5 Autonomous Emergency Braking Vehicle Type Submarket Shares Forecast 2029 (% Share)
Figure 4.6 AEB Passenger Cars Submarket Forecast by Regional Market 2019-2029 (US$m)
Figure 4.7 AEB Passenger Cars Share by Region 2019 (% Share)
Figure 4.8 AEB Passenger Cars Share by Region 2024 (% Share)
Figure 4.9 AEB Passenger Cars Share by Region 2029 (% Share)
Figure 4.10 AEB Commercial Vehicles Submarket Forecast by Regional Market 2019-2029 (US$m)
Figure 4.11 AEB Commercial Vehicles Market Share by Region 2019 (% Share)
Figure 4.12 AEB Commercial Vehicle Market Share by Region 2024 (% Share)
Figure 4.13 AEB Commercial Vehicle Market Share by Region 2029 (% Share)
Figure 4.14 Autonomous Emergency Braking Product Submarket AGR Forecast 2019-2029 (AGR %)
Figure 4.15 Autonomous Emergency Braking Product Market Forecast 2019-2029 (US$m, Global AGR %)
Figure 4.16 Autonomous Emergency Braking Product Submarket Shares 2019 (% Share)
Figure 4.17 Autonomous Emergency Braking Product Submarket Shares 2024 (% Share)
Figure 4.18 Autonomous Emergency Braking Product Submarket Shares 2029 (% Share)
Figure 4.19 Low Speed AEB Submarket Forecast by Regional Market 2019-2029 (US$m)
Figure 4.20 Low Speed AEB Share by Region 2019 (% Share)
Figure 4.21 Low Speed AEB Share by Region 2024 (% Share)
Figure 4.22 Low Speed AEB Share by Region 2029 (% Share)
Figure 4.23 High Speed AEB Submarket Forecast by Regional Market 2019-2029 (US$m)
Figure 4.24 High Speed AEB Share by Region 2019 (% Share)
Figure 4.25 High Speed AEB Share by Region 2024 (% Share)
Figure 4.26 High Speed AEB Share by Region 2029 (% Share)
Figure 4.27 Pedestrian AEB Submarket Forecast by Regional Market 2019-2029 (US$m)
Figure 4.28 Pedestrian AEB Share by Region 2019 (% Share)
Figure 4.29 Pedestrian AEB Share by Region 2024 (% Share)
Figure 4.30 Pedestrian AEB Share by Region 2029 (% Share)
Figure 4.31 Autonomous Emergency Braking Technology Submarket AGR Forecast 2019-2029 (AGR %)
Figure 4.32 Autonomous Emergency Braking Technology Market Forecast 2019-2029 (US$m, Global AGR %)
Figure 4.33 Autonomous Emergency Braking Technology Submarket Shares 2019 (% Share)
Figure 4.34 Autonomous Emergency Braking Technology Submarket Shares 2024 (% Share)
Figure 4.35 Autonomous Emergency Braking Technology Submarket Shares 2029 (% Share)
Figure 4.36 Radar AEB Submarket Forecast by Regional Market 2019-2029 (US$m)
Figure 4.37 Radar AEB Share by Region 2019 (% Share)
Figure 4.38 Radar AEB Share by Region 2024 (% Share)
Figure 4.39 Radar AEB Share by Region 2029 (% Share)
Figure 4.40 Camera AEB Submarket Forecast by Regional Market 2019-2029 (US$m)
Figure 4.41 Camera AEB Share by Region 2019 (% Share)
Figure 4.42 Camera AEB Share by Region 2024 (% Share)
Figure 4.43 Camera AEB Share by Region 2029 (% Share)
Figure 4.44 Lidar AEB Submarket Forecast by Regional Market 2019-2029 (US$m)
Figure 4.45 Lidar AEB Share by Region 2019 (% Share)
Figure 4.46 Lidar AEB Share by Region 2024 (% Share)
Figure 4.47 Lidar AEB Share by Region 2029 (% Share)
Figure 4.48 Fusion AEB Submarket Forecast by Regional Market 2019-2029 (US$m)
Figure 4.49 Fusion AEB Share by Region 2019 (% Share)
Figure 4.50 Fusion AEB Share by Region 2024 (% Share)
Figure 4.51 Fusion AEB Share by Region 2029 (% Share)
Figure 5.1 Leading Regional Autonomous Emergency Braking Market Forecast 2019-2029 (US$m, Global AGR %)
Figure 5.2 Leading Regional Autonomous Emergency Braking Market Forecast 2019-2029 (Sales US$m, Global AGR %)
Figure 5.3 Autonomous Emergency Braking Market Share by Region 2019 (% Share)
Figure 5.4 Autonomous Emergency Braking Market Shares by Region 2024 (% Share)
Figure 5.5 Autonomous Emergency Braking Market Shares by Region 2028 (% Share)
Figure 5.6 North America Autonomous Emergency Braking Market Forecast 2019-2029 (US$m, AGR %)
Figure 5.7 North America Autonomous Emergency Braking Market Forecast by Vehicle Type 2019-2029 (US$m)
Figure 5.8 North America Autonomous Emergency Braking Market Forecast by Product 2019-2029 (US$m)
Figure 5.9 North America Autonomous Emergency Braking Market Forecast by Technology 2019-2029 (US$m)
Figure 5.10 North America Autonomous Emergency Braking Market Forecast by Country 2019-2029 (US$m, Global AGR %)
Figure 5.11 Europe Autonomous Emergency Braking Market Forecast 2019-2029 (US$m, AGR %)
Figure 5.12 Europe Autonomous Emergency Braking Market Forecast by Vehicle Type 2019-2029 (US$m)
Figure 5.13 Europe Autonomous Emergency Braking Market Forecast by Product 2019-2029 (US$m)
Figure 5.14 Europe Autonomous Emergency Braking Market Forecast by Technology 2019-2029 (US$m)
Figure 5.15 Europe Autonomous Emergency Braking Market Forecast by Country 2019-2029 (US$m, Global AGR %)
Figure 5.16 Asia Pacific Autonomous Emergency Braking Market Forecast 2019-2029 (US$m, AGR %)
Figure 5.17 Asia-Pacific Autonomous Emergency Braking Market Forecast by Vehicle Type 2019-2029 (US$m)
Figure 5.18 Asia-Pacific Autonomous Emergency Braking Market Forecast by Product 2019-2029 (US$m)
Figure 5.19 Asia-Pacific Autonomous Emergency Braking Market Forecast by Technology 2019-2029 (US$m)
Figure 5.20 Asia-Pacific Autonomous Emergency Braking Market Forecast by Country Market 2019-2029 (US$m, Global AGR %)
Figure 5.21 RoW Autonomous Emergency Braking Market Forecast 2019-2029 (US$m, AGR %)
Figure 5.22 RoW Autonomous Emergency Braking Market Forecast by Vehicle Type 2019-2029 (US$m)
Figure 5.23 RoW Autonomous Emergency Braking Market Forecast by Platform 2019-2029 (US$m)
Figure 5.24 RoW Autonomous Emergency Braking Market Forecast by Product 2019-2029 (US$m)
Figure 5.25 RoW Autonomous Emergency Braking Market Forecast by Technology 2019-2029 (US$m)
Figure 6.1 Continental AG Total Company Sales 2013-2017 (US$ M, AGR %)
Figure 6.2 Continental AG Sales by Segment of Business 2013-2017 (US$m, Total Company Sales AGR %)
Figure 6.3 Continental AG Sales AGR by Segment of Business 2014-2017 (AGR %)
Figure 6.4 Continental AG Net Income / Loss 2013-2017 (US$m)
Figure 6.5 Continental AG Sales by Regional Segment of Business 2013-2017 (US$m, Total Company Sales AGR %)
Figure 6.6 Continental AG Sales AGR by Regional Segment of Business 2013-2017 (AGR %)
Figure 6.7 Bosch Total Company Sales 2013-2017 (US$m, AGR %)
Figure 6.8 Bosch Sales by Segment of Business 2013-2017 (US$m, Total Company Sales AGR %)
Figure 6.9 Bosch Sales AGR by Segment of Business 2014-2017 (AGR %)
Figure 6.10 Bosch Net Income / Loss 2013-2017 (US$m)
Figure 6.11 Bosch Sales by Regional Segment of Business 2013-2017 (US$m, Total Company Sales AGR %)
Figure 6.12 Bosch Sales AGR by Regional Segment of Business 2014-2017 (AGR %)
Figure 6.13 Denso Corporation Net Income 2013-2017 (US$m, AGR%)
Figure 6.14 Denso Corporation Total Company Sales 2013-2017 (US$m, AGR%)
Figure 6.15 Denso Corporation Net Income 2013-2017 (US$m, AGR%)
Figure 6.16 Denso Corporation Sales by Segment of Business 2015-2017 (US$m, Total Company Sales AGR%)
Figure 6.17 Denso Corporation Sales by Geographical Location 2015-2017 (US$m, Total Company Sales AGR%)
Figure 6.18 Autoliv AB Total Company Sales 2013-2017 (US$m, AGR%)
Figure 6.19 Autoliv AB Net Income 2013-2017 (US$m, AGR%)
Figure 6.20 Autoliv AB Sales by Segment of Business 2013-2017 (US$m, Total Company Sales AGR%)
Figure 6.21 Autoliv AB Sales by Regional Segment of Business 2016-2017 (US$m, Total Company Sales AGR %)
Figure 6.22 Valeo Total Company Sales 2013-2017 (US$m, AGR%)
Figure 6.23 Valeo Sales by Segment of Business 2013-2017 (US$m, Total Company Sales AGR%)
Figure 6.24 Valeo Sales by Regional Segment 2013-2017 (US$m, Total Company Sales AGR%)
Figure 6.25 ZF Friedrichshafen AG Total Company Sales 2013-2017 (US$m, AGR%)
Figure 6.26 ZF Friedrichshafen AG Net Income 2013-2017 (US$m, AGR%)
Figure 6.27 ZF Friedrichshafen AG Sales by Segment of Business 2013-2017 (US$m, Total Company Sales AGR%)
Figure 6.28 ZF Friedrichshafen AG Sales by Regional Segment of Business 2016-2017 (US$m, Total Company Sales AGR %)
Figure 6.29 Aisin Seiki Total Company Sales 2013-2017 (US$ M, AGR %)
Figure 6.30 Aisin Seiki Sales by Segment of Business 2013-2017 (US$m, Total Company Sales AGR %)
Figure 6.31 Aisin Seiki Sales AGR by Segment of Business 2014-2017 (AGR %)
Figure 6.32 Aisin Seiki Net Income / Loss 2013-2017 (US$m)
Figure 6.33 Aisin Seiki Sales by Regional Segment of Business 2013-2017 (US$m, Total Company Sales AGR %)
Figure 6.34 Aisin Seiki Sales AGR by Regional Segment of Business 2014-2017 (AGR %)
Figure 6.35 Delphi Total Company Sales 2013-2017 (US$ M, AGR %)
Figure 6.36 Delphi Sales by Segment of Business 2015-2017 (US$m, Total Company Sales AGR %)
Figure 6.37 Delphi Net Income / Loss 2013-2017 (US$m)
Figure 6.38 Delphi Sales by Regional Segment of Business 2015-2017 (US$m, Total Company Sales AGR %)
Figure 6.39 Magna Total Company Sales 2013-2017 (US$ M, AGR %)
Figure 6.40 Magna Sales by Segment of Business 2013-2017 (US$m, Total Company Sales AGR %)
Figure 6.41 Magna Sales AGR by Segment of Business 2014-2017 (AGR %)
Figure 6.42 Magna Net Income / Loss 2013-2017 (US$m)
Figure 6.43 Magna Sales by Regional Segment of Business 2013-2017 (US$m, Total Company Sales AGR %)
Figure 6.44 Magna Sales AGR by Regional Segment of Business 2014-2017 (AGR %)
Figure 6.45 Hyundai Mobis Total Company Sales 2014-2018 (US$ M, AGR %)
Figure 6.46 Hyundai Mobis Sales by Segment of Business 2014-2018 (US$m, Total Company Sales AGR %)
Figure 6.47 Hyundai Mobis Sales AGR by Segment of Business 2015-2018 (AGR %)
Figure 6.48 Hyundai Net Income / Loss 2014-2018 (US$m)
Figure 7.1 BMW Group Car Sales Overview 2013-2017 (Million Units)
Figure 7.2 Market Share in 2017 BMW Group’s Sales in Selected Regions (%)
Figure 7.3 Mercedes-Benz Car Sales’ Share Distribution in Selected Regions in 2017 (%)
Aisin Group
Aisin Seiki
Alfa Romeo
Allied Vision Technologies
Analog Devices
Audi AG
Autoliv
Balluf
Basler AG
Beijing Automotive
BMW
Borgwarner Inc
Bosch
Brilliance
BYD Auto Co Ltd.
Changan Automobile
Chery
Continental AG
Daimler
Daimler Financial Services
Daimler Trucks
Delphi
Denso Corporation
Dongfeng Motor Corporation
Faurecia
FAW Group
Fiat Chrysler Automobiles (FCA)
Ficosa International S.A.
First Sensor AG
Ford
Geely
General Motors
Gestamp Automoción
Getrag
Gongcheng Denso (Chongqing) Co., Ltd
Google Inc.
Great Wall Motors
Hafei Motor
Hawtai
Hella
Hella KGaA Hueck & Co.
Honda
Hyundai Mobis
Hyundai Motor Company
IBM
Infineon Semiconductors AG
Infineon Technologies AG
International Rectifier Corp.
Isuzu
JAC Motors
Jaguar Land Rover
Kia Motors Corporation
Land Rover
Magna Electronics
Magna International Inc.
Mahindra
Maserati
Mazda
Mercedes-Benz
Meritor Inc.
Mitsubishi Motors
Mobileye
Nissan
nuTonomy, Inc
NXP Semiconductors N.V.
Omron
Oxford Technical Solutions Ltd.
Porsche
Ricardo plc
Robert Bosch GmbH (Bosch)
SAIC Motor Corporation
Schrader international
Seeing Machines
Ssangyong
ST Microelectronics
Subaru
Tata Motors
Tesla Motors
Texas Instruments, Inc
Tokai Rika
TomTom
Toyota Motor Corporation
TRW Automotive
Valeo
Vans Daimler Buses
VBOX Automotive
Velodyne LiDAR, Inc
Volkswagen
Volvo
Voxx Electronics
VW Group
WABCO Vehicle Control Systems
Wuyang-Honda Motors (Guangzhou) Co., Ltd
ZF Friedrichshafen AG
Organisations mentioned
Euro NCAP
European Commission
U.S. National Highway Traffic Safety Administration (NHTSA)
US Department of Transportation
US NCAP
Download sample pages
Complete the form below to download your free sample pages for Automotive Autonomous Emergency Braking (AEB) Systems Market Report 2019-2029
Related reports
-
Automotive Regenerative Braking System (RBS) Market Report 2019-2029
Visiongain assesses that the automotive regenerative braking system market space will be worth $4,097m in 2019 and there are massive...Full DetailsPublished: 07 May 2019 -
Automotive Head-Up Display (HUD) Market Analysis Report 2017-2027
The BMW launch of a new windshield head-up display has led Visiongain to publish this timey report. The $598m automotive...Full DetailsPublished: 03 May 2017 -
Automotive Embedded Software Market Analysis Report 2017-2027
This Visiongain report indicates that the global Automotive Embedded Software market will achieve $2.04bn in spending in 2017.
...Full DetailsPublished: 02 November 2017 -
Automotive Embedded Software Market Report 2019-2029
The market for Automotive Embedded Software market is expected to be valued at US$ 2.39 billion in 2019. ...Full DetailsPublished: 15 January 2019 -
Autonomous Trucks Market Outlook Report 2019-2029
The latest report from business intelligence provider Visiongain offers comprehensive analysis of the global Autonomous Trucks market. Visiongain assesses that...Full DetailsPublished: 30 January 2019 -
Top 20 Automotive Advanced Driver Assistance Systems (ADAS) Companies 2018
Visiongain assesses that the automotive ADAS technologies market will reach $38.4bn in 2018. If you want to be part of...
Full DetailsPublished: 23 May 2018 -

Battery Electric Vehicle (BEV) Market Report 2019-2029
The increasing need to reduce vehicular emissions, decreasing battery prices, and the introduction of stringent regulations by government bodies, has...Full DetailsPublished: 20 November 2018 -
Automotive Over the Air (OTA) Updates Market Report 2019-2029
Automotive OTA Updates market set to reach $1.71bn in 2019.
...Full DetailsPublished: 04 February 2019 -
Automotive Sensor Market Report 2019-2029
Visiongain calculates that the automotive sensor market will reach $19.3bn in 2019....Full DetailsPublished: 18 December 2018 -
Autonomous Vehicle (AV) Market Analysis Report 2017-2027
This report presents the realistic outlook for autonomous vehicles (AV) and provides the expected timelines for the implementation of 3...
Full DetailsPublished: 19 May 2017
Download sample pages
Complete the form below to download your free sample pages for Automotive Autonomous Emergency Braking (AEB) Systems Market Report 2019-2029
Do you have any custom requirements we can help you with?
Any specific country, geo region, market segment or specific company information?
Email us today, we can discuss your needs and see how we can help: jamie.roberts@visiongain.com
Would you like a free report overview of the report of your choice?
If so, please drop an email to Jamie Roberts stating your chosen report title to jamie.roberts@visiongain.com
Visiongain automotive reports are compiled using a broad and rich mixture of both primary and secondary information to produce an overall industry outlook. In order to provide our clients with the best product possible product, we do not rely on any one single source of information. Visiongain analysts reach out to market-leading vendors and automotive industry experts but also review a wealth of financial data and product information from a vast range of sources. To find out more about our reports methodology please email jamie.roberts@visiongain.com
Would you like to get the latest Visiongain automotive reports catalogue?
What are the dynamic growth sectors? where are the regional business opportunities?
Which technologies will prevail and who are the leading companies succeeding in these sectors and why?
If you want definitive answers to business critical questions, discover Visiongain’s full range of business intelligence reports.
If so, please email Jamie Roberts on jamie.roberts@visiongain.com or call her today on +44 207 336 6100
Alliance of Automobile Manufacturers (USA)
Association of Russian Automakers
Audio Video Bridging (AVB)
China Association Of Automoblie Manufacturers
European Association of Automotive Suppliers
European Automobile Manufacturers’ Association
European Council for Automotive Research and Development
Former Society of Automotive Engineers
German Association of the Automotive Industry
International Organization of Motor Vehicle Manufacturers
In-Vehicle Infotainment (IVI)
Italian Association of the Automotive Industry
Japan Automobile Manufacturers Association
One-Pair Ether-Net
Society of Indian Automobile Manufacturers (SIAM)
Society of Motor Manufacturers and Traders
The International Council For Clean Transport
US National Highway Traffic Safety Administration
Latest Automotive news
Visiongain Publishes Connected Vehicle Market Report 2024-2034
The global Connected Vehicle market was valued at US$82.67 billion in 2023 and is projected to grow at a CAGR of 14.7% during the forecast period 2024-2034.
24 April 2024
Visiongain Publishes Automotive Electronics Market Report 2024-2034
The global Automotive Electronics market was valued at US$270.7 million in 2023 and is projected to grow at a CAGR of 8.7% during the forecast period 2024-2034.
15 April 2024
Visiongain Publishes Automobile AI and Generative Design Market Report 2024-2034
The global Automobile AI and Generative Design market was valued at US$630.7 million in 2023 and is projected to grow at a CAGR of 19% during the forecast period 2024-2034.
02 April 2024
Visiongain Publishes Vehicle to Grid (V2G) Market Report 2024-2034
The global Vehicle to Grid (V2G) market was valued at US$3,391 million in 2023 and is projected to grow at a CAGR of 27.6% during the forecast period 2024-2034.
08 March 2024
