Industries > Automotive > Automotive Smart Glass Market Report 2019-2029
Automotive Smart Glass Market Report 2019-2029
Forecasts by Technology Type (Electrochromic, Polymer Dispersed Liquid Device (PDLC), Suspended Particle Device (SPD), Thermochromic, Photochromic), by Application (Rear & Side Windows, Sunroof, Windshields, Mirrors, Head-up Displays (HUD)), by Glass Type (Laminated, Tempered, Combined), by Vehicle Type (Passenger Cars, Commercial Vehicles) Plus Analysis of Leading Companies
Visiongain’s comprehensive new 207 page report reveals that the automotive smart glass market will achieve revenues of $798.9m in 2019.
Smart glass is defined as glass whose transparency can be varied by voltage, light or heat . This allows the blocking of light in certain lighting conditions to improve comfort and visibility. The different types of smart glass include Electrochromic, polymer dispersed liquid crystal (PDLC), suspended particle device (SPD), Thermochromic and Photochromic.
Market scope: The automotive smart glass market has multiple applications in rear and side windows, windshields, sunroof, mirrors, and head-up displays (HUD). Visiongain assesses how these five submarkets and the 15 largest national markets will evolve over the forecast period. The competitive landscape is further illustrated with examination of the 10 market leading manufacturers.
Are you involved in the automotive smart glass market or intend to be? If so, then you must read this report
It’s vital that you keep your knowledge up to date. You need this report.
The Automotive Smart Glass Market Report 2019-2029 Report Responds To Your Need For Definitive Market Data:
• Where Are The Automotive Smart Glass Market Opportunities?
– 285 Tables, Charts, And Graphs Reveal Market Data Allowing You To Target Your Strategy More Effectively
• When Will The Automotive Smart Glass Market Grow?
– Global, Regional And Automotive Smart Glass Submarket Forecasts And Analysis From 2019-2029 Illustrate The Market Progression
• Which Automotive Smart Glass Application Submarkets Will Flourish From 2019-2029?
– Rear And Side Windows Smart Glass Forecast 2019-2029
– Windshields Smart Glass Forecast 2019-2029
– Sunroof Smart Glass Forecast 2019-2029
– Mirrors Smart Glass Forecast 2019-2029
– Head-Up Display Smart Glass Forecast 2019-2029
• Which Automotive Smart Glass Technology Submarkets Will Thrive From 2019-2029?
– Electrochromic Smart Glass Forecast 2019-2029
– PDLC Smart Glass Forecast 2019-2029
– SPD Smart Glass Forecast 2019-2029
– Thermochromic Smart Glass Forecast 2019-2029
– Photochromic Smart Glass Forecast 2019-2029
• Which Automotive Smart Glass Type Submarkets Will Flourish From 2019-2029?
– Laminated Smart Glass Forecast 2019-2029
– Tempered Smart Glass Forecast 2019-2029
– Combined Smart Glass Forecast 2019-2029
• Which Automotive Smart Glass Vehicle Type Submarkets Will Grow From 2019-2029?
– Passenger Cars Smart Glass Forecast 2019-2029
– Commercial Vehicles Smart Glass Forecast 2019-2029
• Where Are The Regional Automotive Smart Glass Market Opportunities From 2019-2029?
North America Automotive Smart Glass Forecast 2019-2029
– US Automotive Smart Glass Forecast 2019-2029
– Mexico Automotive Smart Glass Forecast 2019-2029
– Canada Automotive Smart Glass Forecast 2019-2029
Asia Pacific Automotive Smart Glass Forecast 2019-2029
– China Automotive Smart Glass Forecast 2019-2029
– Japan Automotive Smart Glass Forecast 2019-2029
– India Automotive Smart Glass Forecast 2019-2029
– South Korea Automotive Smart Glass Forecast 2019-2029
– Rest of Asia Pacific Automotive Smart Glass Forecast 2019-2029
Europe Automotive Smart Glass Forecast 2019-2029
– Germany Automotive Smart Glass Forecast 2019-2029
– UK Automotive Smart Glass Forecast 2019-2029
– France Automotive Smart Glass Forecast 2019-2029
– Spain Automotive Smart Glass Forecast 2019-2029
– Rest of Europe Automotive Smart Glass Forecast 2019-2029
Rest Of The World Automotive Smart Glass Forecast 2019-2029
– Brazil Automotive Smart Glass Forecast 2019-2029
– Iran Automotive Smart Glass Forecast 2019-2029
– Turkey Automotive Smart Glass Forecast 2019-2029
– Other Countries Automotive Smart Glass Forecast 2019-2029
What Are The Factors Influencing Automotive Smart Glass Market Dynamics?
– SWOT analysis explores the factors.
– Companies’ strategies for the future
– Extrinsic operational barriers
– Tinting regulations in different markets
– Competition from new product types
– Advances in product quality
– Cost difference analysis between standard and smart glass
Who Are The Leading 10 Automotive Smart Glass Companies?
– Corning Inc
– Compagnie de Saint-Gobain S.A.
– AGC Corporation
– Gentex Corporation
– Nippon Sheet Glass Company, Limited
– Glass Apps, LLC
– Kinestral Technologies, Inc
– Polytronix, Inc.
– Isoclima S.p.A.
– Prelco Inc.
Who should read this report?
– Anyone within the smart glass value chain, including
– Automotive OEMs
– Glass manufacturers
– Component suppliers
– Electronics companies
– Engineers
– CEOs
– Commercial Director
– Director of Marketing
– Business development managers
– Automotive analysts
– Consultants
– Glass industry analysts
– Investors
– Banks
The Automotive Smart Glass Market Report 2019-2029 is a market based report offering detailed segmentation and insight across multiple regions. Avoid missing out – order our report now.
Visiongain is a trading partner with the US Federal Government
CCR Ref number: KD4R6
Do you have any custom requirements we can help you with? Any need for specific country, geo region, market segment or specific company information? Contact us today, we can discuss your needs and see how we can help: sara.peerun@visiongain.com
1.1 Global Automotive Smart Glass Market Overview.
1.2 Why You Should Read This Report
1.3 How This Report Delivers.
1.4 Key Questions Answered by This Analytical Report Include:
1.5 Who is This Report For?.
1.6 Methodology.
1.6.1 Primary Research.
1.6.2 Secondary Research.
1.6.3 Market Evaluation & Forecasting Methodology.
1.7 Frequently Asked Questions (FAQ)
1.8 Associated Visiongain Reports.
1.9 About Visiongain.
2. Introduction to the Automotive Smart Glass Market
2.1 Automotive Smart Glass Market Structure.
2.2 Automotive Smart Glass Market Definition.
2.3 Automotive Smart Glass Technology Type Submarkets Definition.
2.3.1 Automotive Smart Glass Electrochromic Submarket Definition.
2.3.2 Automotive Smart Glass PDLC Submarket Definition.
2.3.3 Automotive Smart Glass SPD Submarket Definition.
2.3.4 Automotive Smart Glass Thermochromic Submarket Definition.
2.3.5 Automotive Smart Glass Photochromic Submarket Definition.
2.4 Automotive Smart Glass - Glass Type Submarkets Definition.
2.4.1 Automotive Laminated Smart Glass Submarket Definition.
2.4.2 Automotive Tempered Smart Glass Submarket Definition.
2.4.3 Automotive Combiner Smart Glass Submarket Definition.
2.5 Automotive Smart Glass Application Submarkets Definition.
2.5.1 Automotive Smart Glass for Rear and Side Windows Submarket Definition.
2.5.2 Automotive Smart Glass for Sunroof Submarket Definition.
2.5.3 Automotive Smart Glass for Windshields Submarket Definition.
2.5.4 Automotive Smart Glass for Mirrors Submarket Definition.
2.5.5 Automotive Smart Glass for Head-up Displays (HUD) Submarket Definition.
2.6 Automotive Smart Glass Vehicle Type Submarkets Definition.
2.6.1 Automotive Smart Glass for Passenger Cars Submarket Definition.
2.6.2 Automotive Smart Glass for Commercial Vehicles Submarket Definition.
3. The Global Automotive Smart Glass Market 2019-2029.
3.1 Global Automotive Smart Glass Market by National Market Share Forecast 2019-2029.
3.2 Global Automotive Smart Glass Market Forecast 2019-2029.
3.3 Global Automotive Smart Glass Submarket Forecast by Regional Markets 2019-2029.
3.4 Global Automotive Smart Glass Technology Type Submarket 2019-2029.
3.5 Global Automotive Smart Glass Application Submarket 2019-2029.
3.6 Global Automotive Smart Glass, Glass Type Submarket 2019-2029.
3.7 Global Automotive Smart Glass Vehicle Type Submarket 2019-2029.
3.8 Global Automotive Smart Glass Market Drivers & Restraints.
3.9 Automotive Smart Glass Market Trends.
4. Automotive Smart Glass Submarket by Technology Type 2019-2029.
4.1 Electrochromic Submarket Forecast 2019-2029.
4.2 PDLC Submarket Forecast 2019-2029.
4.3 SPD Submarket Forecast 2019-2029.
4.4 Thermochromic Submarket Forecast 2019-2029.
4.5 Photochromic Submarket Forecast 2019-2029.
5. The Global Automotive Smart Glass Application Submarket 2019-2029.
5.1 Rear & Side Windows Application Submarket Forecast 2019-2029.
5.2 Sunroof Application Submarket Forecast 2019-2029.
5.3 Windshields Application Submarket Forecast 2019-2029.
5.4 Mirrors Application Submarket Forecast 2019-2029
5.5 HUD Application Submarket Forecast 2019-2029.
6. Automotive Smart Glass Submarket by Glass Type 2019-2029.
6.1 Laminated Submarket Forecast 2019-2029.
6.2 Tempered Submarket Forecast 2019-2029.
6.3 Combiner Submarket Forecast 2019-2029.
7. Automotive Smart Glass Submarket by Vehicle Type 2019-2029.
7.1 Passenger Cars Submarket Forecast 2019-2029.
7.2 Commercial Vehicles Submarket Forecast 2019-2029.
8. North America Automotive Smart Glass Market Forecasts 2019-2029.
8.1 North America Automotive Smart Glass Technology Type Submarket 2019-2029.
8.2 North America Automotive Smart Glass Application Submarket 2019-2029.
8.3 North America Automotive Smart Glass - Glass Type Submarket 2019-2029.
8.4 North America Automotive Smart Glass - Vehicle Type Submarket 2019-2029.
8.5 North America Automotive Smart Glass Market by Country Forecast 2019-2029.
8.5.1 U.S. Automotive Smart Glass Market Forecast 2019-2029.
8.5.1.1 Analysis of State Regulation Influencing U.S. Automotive Smart Glass Outlook
8.5.2 Canada Automotive Smart Glass Market Forecast 2019-2029.
8.5.2.1 Analysis of State Regulation Influencing Canada Automotive Smart Glass Outlook
8.5.3 Mexico Automotive Smart Glass Market Forecast 2019-2029.
9. Europe Automotive Smart Glass Market Forecasts 2019-2029.
9.1 Europe Automotive Smart Glass Technology Type Submarket 2019-2029.
9.2 Europe Automotive Smart Glass Application Submarket 2019-2029.
9.3 Europe Automotive Smart Glass - Glass Type Submarket 2019-2029.
9.5 Europe Automotive Smart Glass - Vehicle Type Submarket 2019-2029.
9.6 Europe Automotive Smart Glass Market by Country Forecast 2019-2029.
9.6.1 Germany Automotive Smart Glass Market Forecast 2019-2029.
9.6.2 France Automotive Smart Glass Market Forecast 2019-2029.
9.6.3 U.K. Automotive Smart Glass Market Forecast 2019-2029.
9.6.4 Spain Automotive Smart Glass Market Forecast 2019-2029.
9.6.5 Rest of Europe Automotive Smart Glass Market Forecast 2019-2029.
10. Asia-Pacific Automotive Smart Glass Market Forecasts 2019-2029.
10.1 Asia-Pacific Automotive Smart Glass Technology Type Submarket 2019-2029.
10.2 Asia-Pacific Automotive Smart Glass Application Submarket 2019-2029.
10.3 Asia-Pacific Automotive Smart Glass - Glass Type Submarket 2019-2029.
10.4 Asia-Pacific Automotive Smart Glass - Vehicle Type Submarket 2019-2029.
10.5 Asia-Pacific Automotive Smart Glass Market by Country Forecast 2019-2029.
10.5.1 China Smart Glass Market Forecast 2019-2029.
10.5.2 Japan Automotive Smart Glass Market Forecast 2019-2029.
10.5.3 India Automotive Smart Glass Market Forecast 2019-2029.
10.5.4 South Korea Automotive Smart Glass Market Forecast 2019-2029.
10.5.5 Rest of Asia-Pacific Automotive Smart Glass Market Forecast 2019-2029.
11. ROW Automotive Smart Glass Market Forecasts 2019-2029.
11.1 ROW Automotive Smart Glass Technology Type Submarket 2019-2029.
11.2 ROW Automotive Smart Glass Application Submarket 2019-2029.
11.3 ROW Automotive Smart Glass - Glass Type Submarket 2019-2029.
11.4 ROW Automotive Smart Glass - Vehicle Type Submarket 2019-2029.
11.5 ROW Automotive Smart Glass Market by Country Forecast 2019-2029.
11.5.1 Brazil Automotive Smart Glass Market Forecast 2019-2029.
11.5.2 Iran Automotive Smart Glass Market Forecast 2019-2029.
11.5.3 Turkey Automotive Smart Glass Market Forecast 2019-2029.
11.5.4 Other Countries Automotive Smart Glass Market Forecast 2019-2029.
12. Competitive Landscape of the Automotive Smart Glass Market
12.1 SWOT Analysis.
12.2 Key Recent Developments Mapping
12.3 Strategy Focus Benchmarking of Key Competitors
13. Leading Companies in the Automotive Smart Glass Market
13.1 Corning Inc.
13.1.1 Introduction.
13.1.2 Corning Inc. Total Company Sales 2015-2018.
13.1.3 Corning Inc. Sales by Geographical Segment of Business 2016-2018
13.1.4 Corning Inc. Sales by Operating Segment of Business 2016-2018.
13.1.5 Corning Inc. Selected Recent Product Launch, Partnerships, Joint Venture, 2016-2019.
13.1.5 Corning Inc. Patents Granted.
13.1.7 Corning Inc. Future Outlook.
13.1.8 Competitors of Corning Inc.
13.1.9 Regional Emphasis/Focus of Corning Inc.
13.2 Compagnie de Saint-Gobain S.A.
13.2.1 Introduction.
13.2.2 Compagnie de Saint-Gobain S.A. Total Company Sales 2015-2018.
13.2.3 Compagnie de Saint-Gobain S.A. Sales by Geographical Segment of Business 2016-2018
13.2.4 Compagnie de Saint-Gobain S.A. Sales by Operating Segment of Business 2016-2018
13.2.5 Compagnie de Saint-Gobain S.A. Selected Recent Product Enhancement, Acquisitions and Divestiture, 2018-2019.
13.2.7 Compagnie de Saint-Gobain S.A. Future Outlook.
13.2.8 Competitors of Compagnie de Saint-Gobain S.A.
13.2.9 Regional Emphasis/Focus of Compagnie de Saint-Gobain S.A.
13.3 AGC Corporation.
13.3.1 Introduction.
13.3.2 AGC Corporation Regional Company Sales 2017
13.3.3 AGC Corporation Selected Recent R&D Framework, Product Launch, and Product Deployment, 2018-2019
13.3.4 AGC Corporation Future Outlook.
13.3.5 Competitors of AGC Corporation.
13.3.6 Regional Emphasis/Focus of AGC Corporation.
13.4 Gentex Corporation.
13.4.1 Introduction.
13.4.2 Gentex Corporation Total Company Sales 2014-2017.
13.4.3 Gentex Corporation Sales by Geographical Segment of Business 2015-2017.
13.4.4 Gentex Corporation Sales by Operating Segment of Business 2015-2017.
13.4.5 Gentex Corporation Selected Recent Client Win, Product Launch, Equity Stake, Partnership, and Technology Enhancement, 2017-2019.
13.4.6 Gentex Corporation Future Outlook.
13.4.7 Competitors of Gentex Corporation.
13.4.8 Regional Emphasis/Focus of Gentex Corporation.
13.5 Nippon Sheet Glass Company, Limited.
13.5.1 Introduction.
13.5.2 Nippon Sheet Glass Company, Limited Total Company Sales 2015-2018.
13.5.3 Nippon Sheet Glass Company, Limited Sales Split by Geographical Segment of Business 2018
13.5.4 Nippon Sheet Glass Company, Limited Sales by Operating Segment of Business 2017-2018
13.5.5 Nippon Sheet Glass Company, Limited Selected Recent Renaming, Client Win, New Plant Set Up, Geographical Expansion, Value Creation, Product Line Expansion, and Product Development 2018-2019
13.5.6 Nippon Sheet Glass Company, Limited Future Outlook.
13.5.7 Competitors of Nippon Sheet Glass Company, Limited.
13.5.8 Regional Emphasis/Focus of Nippon Sheet Glass Company, Limited.
13.6 Glass Apps, LLC.
13.6.1 Introduction.
13.6.2 Glass Apps, LLC Selected Recent Acquisition, 2014.
13.6.3 Glass Apps, LLC Future Outlook.
13.6.4 Competitors of Glass Apps, LLC.
13.6.5 Regional Emphasis/Focus of Glass Apps, LLC.
13.7 Kinestral Technologies, Inc.
13.7.1 Introduction.
13.7.2 Kinestral Technologies, Inc. Selected Recent Acquisition, 2014.
13.7.3 Kinestral Technologies, Inc. Future Outlook.
13.7.4 Competitors of Kinestral Technologies, Inc.
13.7.5 Regional Emphasis/Focus of Kinestral Technologies, Inc.
13.8 Polytronix, Inc.
13.8.1 Introduction.
13.8.2 Polytronix, Inc. Future Outlook.
13.8.3 Competitors of Polytronix, Inc.
13.8.4 Regional Emphasis/Focus of Polytronix, Inc.
13.9 Isoclima S.p.A.
13.9.1 Introduction.
13.9.2 Isoclima S.p.A. Selected Recent Acquisition, 2017.
13.9.3 Isoclima S.p.A. Future Outlook.
13.9.4 Competitors of Isoclima S.p.A.
13.9.5 Regional Emphasis/Focus of Isoclima S.p.A.
13.9 Prelco Inc.
13.10.1 Introduction.
13.10.2 Prelco Inc. Selected Recent Client Win, Capacity Enhancement and Investment, 2016-2018
13.10.3 Prelco Inc. Future Outlook.
13.10.4 Competitors of Prelco Inc.
13.10.5 Regional Emphasis/Focus of Prelco Inc.
14. Other Companies involved With Automotive Glass
15. Conclusions and Recommendations
16. Glossary
List of Tables
Table 3.1 Leading National Automotive Smart Glass Market Forecast 2019-2029 (US$m, Global AGR %, Cumulative)
Table 3.2 Global Automotive Smart Glass Market CAGR Forecast 2019-2024, 2024-2029, 2019-2029 (CAGR %)
Table 3.3 Global Automotive Smart Glass Market Forecast 2019-2029 (US $m, AGR %, CAGR%)
Table 3.4 Global Automotive Smart Glass Market Forecast by Regional Market 2019-2029 (US $m, CAGR %)
Table 3.5 Global Automotive Smart Glass Market Drivers & Restraints
Table 3.6 Conventional to Smart Glass Price Comparison, US$ Per Square Foot
Table 4.1 Electrochromic Submarket Forecast by Regional Market 2019-2029 (US $m, AGR %, CAGR %)
Table 4.2 PDLC Market Forecast by Regional Market 2019-2029 (US $m, AGR %, CAGR %)
Table 4.3 SPD Market Forecast by Regional Market 2019-2029 (US $m, AGR %, CAGR %)
Table 4.4 Thermochromic Market Forecast by Regional Market 2019-2029 (US $m, AGR %, CAGR %)
Table 4.5 Photochromic Market Forecast by Regional Market 2019-2029 (US $m, AGR %, CAGR %)
Table 5.1 Rear & Side Windows Technology Market Forecast by Regional Market 2019-2029 (US $m, AGR %, CAGR %)
Table 5.2 Sunroof Application Market Forecast by Regional Market 2019-2029 (US $m, AGR %, CAGR %)
Table 5.3 Windshields Application Market Forecast by Regional Market 2019-2029 (US $m, AGR %, CAGR %)
Table 5.4 Mirrors Application Market Forecast by Regional Market 2019-2029 (US $m, AGR %, CAGR %)
Table 5.5 HUD Application Market Forecast by Regional Market 2019-2029 (US $m, AGR %, CAGR %)
Table 6.1 Laminated Smart Glass Submarket Forecast by Regional Market 2019-2029 (US $m, AGR %, CAGR %)
Table 6.2 Tempered Smart Glass Submarket Forecast by Regional Market 2019-2029 (US $m, AGR %, CAGR %)
Table 6.3 Combiner Smart Glass Submarket Forecast by Regional Market 2019-2029 (US $m, AGR %, CAGR %)
Table 7.1 Passenger Cars Smart Glass Submarket Forecast by Regional Market 2019-2029 (US $m, AGR %, CAGR %)
Table 7.2 Commercial Vehicles Smart Glass Submarket Forecast by Regional Market 2019-2029 (US $m, AGR %, CAGR %)
Table 8.1 North America Automotive Smart Glass Technology Type Submarket Forecast 2019-2029 (US $m, AGR %, CAGR %)
Table 8.2 North America Automotive Smart Glass Application Submarket Forecast 2019-2029 (US $m, AGR %, CAGR %)
Table 8.3 North America Automotive Smart Glass - Glass Type Submarket Forecast 2019-2029 (US $m, AGR %, CAGR %)
Table 8.4 North America Automotive Smart Glass - Vehicle Type Submarket Forecast 2019-2029 (US $m, AGR %, CAGR %)
Table 8.5 North America Automotive Smart Glass Market Forecast by Country, 2019-2029 (US $m, AGR %, CAGR %)
Table 8.6 U.S. Automotive Smart Glass Market Forecast 2019-2029 (US$m, AGR %, CAGR %, Cumulative)
Table 8.7 Canada Automotive Smart Glass Market Forecast 2019-2029 (US$m, AGR %, CAGR %, Cumulative)
Table 8.8 Mexico Automotive Smart Glass Market Forecast 2019-2029 (US$m, AGR %, CAGR %, Cumulative)
Table 9.1 Europe Automotive Smart Glass Technology Type Submarket Forecast 2019-2029 (US $m, AGR %, CAGR %)
Table 9.2 Europe Automotive Smart Glass Application Submarket Forecast 2019-2029 (US $m, AGR %, CAGR %)
Table 9.3 Europe Automotive Smart Glass - Glass Type Submarket Forecast 2019-2029 (US $m, AGR %, CAGR %)
Table 9.4 Europe Automotive Smart Glass - Vehicle Type Submarket Forecast 2019-2029 (US $m, AGR %, CAGR %)
Table 9.5 Europe Automotive Smart Glass Market Forecast by Country, 2019-2029 (US $m, AGR %, CAGR %)
Table 9.6 Germany Automotive Smart Glass Market Forecast 2019-2029 (US$m, AGR %, CAGR %, Cumulative)
Table 9.7 France Automotive Smart Glass Market Forecast 2019-2029 (US$m, AGR %, CAGR %, Cumulative)
Table 9.8 U.K. Automotive Smart Glass Market Forecast 2019-2029 (US$m, AGR %, CAGR %, Cumulative)
Table 9.9 Spain Automotive Smart Glass Market Forecast 2019-2029 (US$m, AGR %, CAGR %, Cumulative)
Table 9.10 Rest of Europe Automotive Smart Glass Market Forecast 2019-2029 (US$m, AGR %, CAGR %, Cumulative)
Table 10.1 Asia-Pacific Automotive Smart Glass Technology Type Submarket Forecast 2019-2029 (US $m, AGR %, CAGR %)
Table 10.2 Asia-Pacific Automotive Smart Glass Application Submarket Forecast 2019-2029 (US $m, AGR %, CAGR %)
Table 10.3 Asia-Pacific Automotive Smart Glass - Glass Type Submarket Forecast 2019-2029 (US $m, AGR %, CAGR %)
Table 10.4 Asia-Pacific Automotive Smart Glass - Vehicle Type Submarket Forecast 2019-2029 (US $m, AGR %, CAGR %)
Table 10.5 Asia-Pacific Automotive Smart Glass Market Forecast by Country, 2019-2029 (US $m, AGR %, CAGR %)
Table 10.6 China Smart Glass Market Forecast 2019-2029 (US$m, AGR %, CAGR %, Cumulative)
Table 10.7 Japan Automotive Smart Glass Market Forecast 2019-2029 (US$m, AGR %, CAGR %, Cumulative)
Table 10.8 India Automotive Smart Glass Market Forecast 2019-2029 (US$m, AGR %, CAGR %, Cumulative)
Table 10.9 South Korea Automotive Smart Glass Market Forecast 2019-2029 (US$m, AGR %, CAGR %, Cumulative)
Table 10.10 Rest of Asia-Pacific Automotive Smart Glass Market Forecast 2019-2029 (US$m, AGR %, CAGR %, Cumulative)
Table 11.1 ROW Automotive Smart Glass Technology Type Submarket Forecast 2019-2029 (US $m, AGR %, CAGR %)
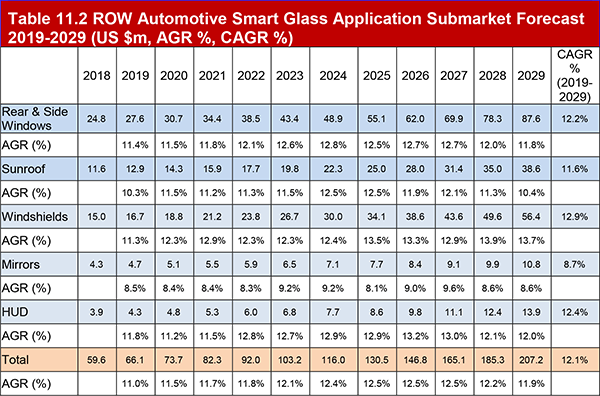
Table 11.2 ROW Automotive Smart Glass Application Submarket Forecast 2019-2029 (US $m, AGR %, CAGR %)
Table 11.3 ROW Automotive Smart Glass - Glass Type Submarket Forecast 2019-2029 (US $m, AGR %, CAGR %)
Table 11.4 ROW Automotive Smart Glass - Vehicle Type Submarket Forecast 2019-2029 (US $m, AGR %, CAGR %)
Table 11.5 ROW Automotive Smart Glass Market Forecast by Country, 2019-2029 (US $m, AGR %, CAGR %)
Table 11.6 Brazil Automotive Smart Glass Market Forecast 2019-2029 (US$m, AGR %, CAGR %, Cumulative)
Table 11.7 Iran Automotive Smart Glass Market Forecast 2019-2029 (US$m, AGR %, CAGR %, Cumulative)
Table 11.8 Turkey Automotive Smart Glass Market Forecast 2019-2029 (US$m, AGR %, CAGR %, Cumulative)
Table 11.9 Other Countries Automotive Smart Glass Market Forecast 2019-2029 (US$m, AGR %, CAGR %, Cumulative)
Table 13.1 Corning Inc. Profile 2019 (CEO, Total Company Sales US$m, Net Income US$m, HQ, Founded, No. of Employees, Website)
Table 13.2 Corning Inc. Total Company Sales 2015-2018 (US$m, AGR %)
Table 13.3 Corning Inc. Sales by Geographical Segment of Business 2016-2018 (US$m, AGR %)
Table 13.4 Corning Inc. Sales by Operating Segment of Business 2015-2017 (US$m, AGR %)
Table 13.5 Selected Recent Corning Inc. Product Launch, Partnership, Joint Venture, 2016-2019 (Year, Type, Details)
Table 13.6 Number of Patents (Global, U.S., Expiry Date)
Table 13.7 Compagnie de Saint-Gobain S.A. Profile 2019 (CEO, Total Company Sales US$m, Net Income US$m, HQ, Founded, No. of Employees, Website)
Table 13.8 Compagnie de Saint-Gobain S.A. Total Company Sales 2015-2018 (US$m, AGR %)
Table 13.9 Compagnie de Saint-Gobain S.A. Sales by Geographical Segment of Business 2016-2018 (US$m, AGR %)
Table 13.10 Compagnie de Saint-Gobain S.A. Sales by Operating Segment of Business 2015-2017 (US$m, AGR %)
Table 13.11 Selected Recent Compagnie de Saint-Gobain S.A. Product Enhancement, Acquisitions and Divestiture, 2018-2019 (Year, Type, Details)
Table 13.12 AGC Corporation Profile 2019 (CEO, Total Company Sales US$m, Net Income US$m, HQ, Founded, No. of Employees, Website)
Table 13.13 Selected Recent AGC Corporation R&D Framework, Product Launch, and Product Deployment, 2018-2019 (Year, Type, Details)
Table 13.14 Gentex Corporation Profile 2019 (CEO, Total Company Sales US$m, Net Income US$m, HQ, Founded, No. of Employees, Website)
Table 13.15 Gentex Corporation Total Company Sales 2014-2017 (US$m, AGR %)
Table 13.16 Gentex Corporation Sales by Geographical Segment of Business 2015-2017 (US$m, AGR %)
Table 13.17 Gentex Corporation Sales by Operating Segment of Business 2015-2017 (US$m, AGR %)
Table 13.18 Selected Recent Gentex Corporation Gentex Corporation Selected Recent Client Win, Product Launch, Equity Stake, Partnership, and Technology Enhancement, 2017-2019.
Table 13.19 Nippon Sheet Glass Company, Limited Profile 2019 (CEO, Total Company Sales US$m, Net Income US$m, HQ, Founded, No. of Employees, Website)
Table 13.20 Nippon Sheet Glass Company, Limited Total Company Sales 2015-2018 (US$m, AGR %)
Table 13.21 Nippon Sheet Glass Company, Limited Sales by Operating Segment of Business 2017-2018 (US$m, AGR %)
Table 13.22 Selected Recent Nippon Sheet Glass Company, Limited Selected Recent Renaming, Client Win, New Plant Set Up, Geographical Expansion, Value Creation, Product Line Expansion, and Product Development 2018-2019.
Table 13.23 Glass Apps, LLC Profile 2019 (CEO, Total Company Sales US$m, HQ, Founded, No. of Employees, Website)
Table 13.24 Selected Recent Glass Apps, LLC Selected Recent Acquisition, 2014 (Year, Type, Details)
Table 13.25 Kinestral Technologies, Inc. Profile 2019 (CEO, Total Company Sales US$m, HQ, Founded, No. of Employees, Website)
Table 13.26 Selected Recent Kinestral Technologies, Inc. Selected Recent Acquisition, 2014 (Year, Type, Details)
Table 13.27 Polytronix, Inc. Profile 2019 (CEO, Total Company Sales US$m, HQ, Founded, No. of Employees, Website)
Table 13.28 Isoclima S.p.A. Profile 2019 (CEO, Total Company Sales US$m, HQ, Founded, No. of Employees, Website)
Table 13.29 Selected Recent Isoclima S.p.A. Selected Recent Investment and Partnership, 2017 (Year, Type, Details)
Table 13.30 Prelco Inc. Profile 2019 (CEO, Total Company Sales US$m, HQ, Founded, No. of Employees, Website)
Table 13.31 Selected Recent Prelco Inc. Selected Recent Client Win, Capacity Enhancement and Investment, 2016-2018 (Year, Type, Details)
List of Figures
Figure 2.1 Global Automotive Smart Glass Market Segmentation Overview..
Figure 3.1 Global Automotive Smart Glass Market by National Market Forecast 2019-2029 (US$m, Global AGR %)
Figure 3.2 Leading National Automotive Smart Glass Market CAGR Forecast 2019-2024 (CAGR %)
Figure 3.3 Leading National Automotive Smart Glass Market CAGR Forecast 2024-2029 (CAGR %)
Figure 3.4 Leading National Automotive Smart Glass Market CAGR Forecast 2019-2029 (CAGR %)
Figure 3.5 Global Automotive Smart Glass Market by National Market Share Forecast 2019 (% Share)
Figure 3.6 Global Automotive Smart Glass Market by National Market Share Forecast 2024 (% Share)
Figure 3.7 Global Automotive Smart Glass Market by National Market Share Forecast 2029 (% Share)
Figure 3.8 Global Automotive Smart Glass Market Forecast 2019-2029 (US $m, AGR%)
Figure 3.9 Global Automotive Smart Glass Market Regional Opportunity Assessment 2019-2029
Figure 3.10 Global Automotive Smart Glass Technology Type Submarket Forecasts 2019-2029 (US$m, AGR %)
Figure 3.11 Global Automotive Smart Glass Technology Type Submarket Forecast (AGR%) 2019-2029
Figure 3.12 Global Automotive Smart Glass Technology Type Submarket Forecast 2019, 2024 and 2029 (% Share)
Figure 3.13 Global Automotive Smart Glass Technology Type Submarket Opportunity Assessment 2019-2029
Figure 3.14 Global Automotive Smart Glass Application Submarket Forecasts 2019-2029 (US$m)
Figure 3.15 Global Automotive Smart Glass Application Submarket Forecast (AGR%) 2019-2029
Figure 3.16 Global Automotive Smart Glass Application Submarket Forecast 2019, 2024 and 2029 (% Share)
Figure 3.17 Global Automotive Smart Glass Market Application Submarket Opportunity Assessment 2019-2029
Figure 3.18 Global Automotive Smart Glass, Glass Type Submarket Forecasts 2019-2029 (US$m, AGR %)
Figure 3.19 Global Automotive Smart Glass, Glass Type Submarket Forecast (AGR%) 2019-2029
Figure 3.20 Global Automotive Smart Glass, Glass Type Submarket Forecast 2019, 2024 and 2029 (% Share)
Figure 3.21 Global Automotive Smart Glass, Glass Type Submarket Opportunity Assessment 2019-2029
Figure 3.22 Global Automotive Smart Glass Vehicle Type Submarket Forecasts 2019-2029 (US$m)
Figure 3.23 Global Automotive Smart Glass Vehicle Type Submarket Forecast (AGR%) 2019-2029
Figure 3.24 Global Automotive Smart Glass Vehicle Type Submarket Forecast 2019, 2024 and 2029 (% Share)
Figure 3.25 Global Automotive Smart Glass Market Vehicle Type Submarket Opportunity Assessment 2019-2029
Figure 4.1 The Global Electrochromic Submarket Share Forecast by Regional Market 2019, 2024 and 2029 (% Share)
Figure 4.2 Electrochromic Submarket Forecast by Regional Market 2019-2029 (US $m, AGR %)
Figure 4.3 PDLC Market Share Forecast by Regional Market 2019, 2024 and 2029 (% Share)
Figure 4.4 PDLC Market Forecast by Regional Market 2019-2029 (US $m, AGR%)
Figure 4.5 SPD Market Share Forecast by Regional Market 2019, 2024 and 2029 (% Share)
Figure 4.6 SPD Market Forecast by Regional Market 2019-2029 (US $m, AGR%)
Figure 4.7 Thermochromic Market Share Forecast by Regional Market 2019, 2024 and 2029 (% Share)
Figure 4.8 Thermochromic Market Forecast by Regional Market 2019-2029 (US $m, AGR%)
Figure 4.9 Photochromic Market Share Forecast by Regional Market 2019, 2024 and 2029 (% Share)
Figure 4.10 Photochromic Market Forecast by Regional Market 2019-2029 (US $m, AGR%)
Figure 5.1 Rear & Side Windows Technology Market Share Forecast by Regional Market 2019, 2024 and 2029 (% Share)
Figure 5.2 Rear & Side Windows Technology Market Forecast by Regional Market 2019-2029 (US $m, AGR%)
Figure 5.3 Sunroof Application Market Share Forecast by Regional Market 2019, 2024 and 2029 (% Share)
Figure 5.4 Sunroof Application Market Forecast by Regional Market 2019-2029 (US $m, AGR%)
Figure 5.5 Windshields Application Market Share Forecast by Regional Market 2019, 2024 and 2029 (% Share)
Figure 5.6 Windshields Application Market Forecast by Regional Market 2019-2029 (US $m, AGR%)
Figure 5.7 Mirrors Application Market Share Forecast by Regional Market 2019, 2024 and 2029 (% Share)
Figure 5.8 Mirrors Application Market Forecast by Regional Market 2019-2029 (US $m, AGR%)
Figure 5.9 HUD Application Market Share Forecast by Regional Market 2019, 2024 and 2029 (% Share)
Figure 5.10 HUD Application Market Forecast by Regional Market 2019-2029 (US $m, AGR%)
Figure 6.1 The Global Laminated Smart Glass Submarket Share Forecast by Regional Market 2019, 2024 and 2029 (% Share)
Figure 6.2 Laminated Smart Glass Submarket Forecast by Regional Market 2019-2029 (US $m, AGR %)
Figure 6.3 The Global Tempered Smart Glass Submarket Share Forecast by Regional Market 2019, 2024 and 2029 (% Share)
Figure 6.4 Tempered Smart Glass Submarket Forecast by Regional Market 2019-2029 (US $m, AGR %)
Figure 6.5 The Global Combiner Smart Glass Submarket Share Forecast by Regional Market 2019, 2024 and 2029 (% Share)
Figure 6.6 Combiner Smart Glass Submarket Forecast by Regional Market 2019-2029 (US $m, AGR %)
Figure 7.1 The Global Passenger Cars Smart Glass Submarket Share Forecast by Regional Market 2019, 2024 and 2029 (% Share)
Figure 7.2 Passenger Cars Smart Glass Submarket Forecast by Regional Market 2019-2029 (US $m, AGR %)
Figure 7.3 The Global Commercial Vehicles Smart Glass Submarket Share Forecast by Regional Market 2019, 2024 and 2029 (% Share)
Figure 7.4 Commercial Vehicles Smart Glass Submarket Forecast by Regional Market 2019-2029 (US $m, AGR %)
Figure 8.1 North America Automotive Smart Glass Technology Type Submarket Forecasts 2019-2029 (US$m, AGR %)
Figure 8.2 North America Automotive Smart Glass Technology Type Submarket Forecast (AGR%) 2019-2029
Figure 8.3 North America Automotive Smart Glass Technology Type Submarket Share Forecast 2019, 2024 and 2029 (% Share)
Figure 8.4 North America Automotive Smart Glass Application Submarket Forecast 2019-2029 (US$m, AGR %)
Figure 8.5 North America Automotive Smart Glass Application Submarket Forecast (AGR%) 2019-2029
Figure 8.6 North America Automotive Smart Glass Application Submarket Forecast 2019, 2024 and 2029 (% Share)
Figure 8.7 North America Automotive Smart Glass - Glass Type Submarket Forecast 2019-2029 (US$m, AGR %)
Figure 8.8 North America Automotive Smart Glass - Glass Type Submarket Forecast (AGR%) 2019-2029
Figure 8.9 North America Automotive Smart Glass - Glass Type Submarket Forecast 2019, 2024 and 2029 (% Share)
Figure 8.10 North America Automotive Smart Glass - Vehicle Type Submarket Forecast 2019-2029 (US$m, AGR %)
Figure 8.11 North America Automotive Smart Glass - Vehicle Type Submarket Forecast (AGR%) 2019-2029
Figure 8.12 North America Automotive Smart Glass - Vehicle Type Submarket Forecast 2019, 2024 and 2029 (% Share)
Figure 8.13 North America Automotive Smart Glass Market Forecast by Country 2019-2029 (US$m, AGR %)
Figure 8.14 North America Automotive Smart Glass Market AGR Forecast by Country 2019-2029 (AGR%)
Figure 8.15 North America Automotive Smart Glass Market Share Forecast by Country, 2019, 2024 and 2029 (% Share)
Figure 8.16 U.S. Automotive Smart Glass Market Forecast 2019-2029 (US$m, U.S. Total Market Sales AGR %)
Figure 8.17 Canada Automotive Smart Glass Market Forecast 2019-2029 (US$m, Canada Total Market Sales AGR %)
Figure 8.18 Mexico Automotive Smart Glass Market Forecast 2019-2029 (US$m, Mexico Total Market Sales AGR %)
Figure 9.1 Europe Automotive Smart Glass Technology Type Submarket Forecast 2019-2029 (US$m, AGR %)
Figure 9.2 Europe Automotive Smart Glass Technology Type Submarket Forecast (AGR%) 2019-2029
Figure 9.3 Europe Automotive Smart Glass Technology Type Submarket Share Forecast 2019, 2024 and 2029 (% Share)
Figure 9.4 Europe Automotive Smart Glass Application Submarket Forecast 2019-2029 (US$m, AGR %)
Figure 9.5 Europe Automotive Smart Glass Application Submarket Forecast (AGR%) 2019-2029
Figure 9.6 Europe Automotive Smart Glass Application Submarket Forecast 2019, 2024 and 2029 (% Share)
Figure 9.7 Europe Automotive Smart Glass - Glass Type Submarket Forecast 2019-2029 (US$m, AGR %)
Figure 9.8 Europe Automotive Smart Glass - Glass Type Submarket Forecast (AGR%) 2019-2029
Figure 9.9 Europe Automotive Smart Glass - Glass Type Submarket Forecast 2019, 2024 and 2029 (% Share)
Figure 9.10 Europe Automotive Smart Glass - Vehicle Type Submarket Forecast 2019-2029 (US$m, AGR %)
Figure 9.11 Europe Automotive Smart Glass - Vehicle Type Submarket Forecast (AGR%) 2019-2029
Figure 9.12 Europe Automotive Smart Glass - Vehicle Type Submarket Forecast 2019, 2024 and 2029 (% Share)
Figure 9.13 Europe Automotive Smart Glass Market Forecast by Country 2019-2029 (US$m, AGR %)
Figure 9.14 Europe Automotive Smart Glass Market AGR Forecast by Country 2019-2029 (AGR%)
Figure 9.15 Europe Automotive Smart Glass Market Share Forecast by Country, 2019, 2024 and 2029 (% Share)
Figure 9.16 Germany Automotive Smart Glass Market Forecast 2019-2029 (US$m, Germany Total Market Sales AGR %)
Figure 9.17 France Automotive Smart Glass Market Forecast 2019-2029 (US$m, France Total Market Sales AGR %)
Figure 9.18 U.K. Automotive Smart Glass Market Forecast 2019-2029 (US$m, U.K. Total Market Sales AGR %)
Figure 9.19 Spain Automotive Smart Glass Market Forecast 2019-2029 (US$m, Spain Total Market Sales AGR %)
Figure 9.20 Rest of Europe Automotive Smart Glass Market Forecast 2019-2029 (US$m, Rest of Europe Total Market Sales AGR %)
Figure 10.1 Asia-Pacific Automotive Smart Glass Technology Type Submarket Forecasts 2019-2029 (US$m, AGR %)
Figure 10.2 Asia-Pacific Automotive Smart Glass Technology Type Submarket Forecast (AGR%) 2019-2029
Figure 10.3 Asia-Pacific Automotive Smart Glass Technology Type Submarket Share Forecast 2019, 2024 and 2029 (% Share)
Figure 10.4 Asia-Pacific Automotive Smart Glass Application Submarket Forecast 2019-2029 (US$m, AGR %)
Figure 10.5 Asia-Pacific Automotive Smart Glass Application Submarket Forecast (AGR%) 2019-2029
Figure 10.6 Asia-Pacific Automotive Smart Glass Application Submarket Forecast 2019, 2024 and 2029 (% Share)
Figure 10.7 Asia-Pacific Automotive Smart Glass - Glass Type Submarket Forecast 2019-2029 (US$m, AGR %)
Figure 10.8 Asia-Pacific Automotive Smart Glass - Glass Type Submarket Forecast (AGR%) 2019-2029
Figure 10.9 Asia-Pacific Automotive Smart Glass - Glass Type Submarket Forecast 2019, 2024 and 2029 (% Share)
Figure 10.10 Asia-Pacific Automotive Smart Glass - Vehicle Type Submarket Forecast 2019-2029 (US$m, AGR %)
Figure 10.11 Asia-Pacific Automotive Smart Glass - Vehicle Type Submarket Forecast (AGR%) 2019-2029
Figure 10.12 Asia-Pacific Automotive Smart Glass - Vehicle Type Submarket Forecast 2019, 2024 and 2029 (% Share)
Figure 10.13 Asia-Pacific Automotive Smart Glass Market Forecast by Country 2019-2029 (US$m, AGR %)
Figure 10.14 Asia-Pacific Automotive Smart Glass Market AGR Forecast by Country 2019-2029 (AGR%)
Figure 10.15 Asia-Pacific Automotive Smart Glass Market Share Forecast by Country, 2019, 2024 and 2029 (% Share)
Figure 10.16 China Smart Glass Market Forecast 2019-2029 (US$m, China Total Market Sales AGR %)
Figure 10.17 Japan Automotive Smart Glass Market Forecast 2019-2029 (US$m, Japan Total Market Sales AGR %)
Figure 10.18 India Automotive Smart Glass Market Forecast 2019-2029 (US$m, India Total Market Sales AGR %)
Figure 10.19 South Korea Automotive Smart Glass Market Forecast 2019-2029 (US$m, South Korea Total Market Sales AGR %)
Figure 10.20 Rest of Asia-Pacific Automotive Smart Glass Market Forecast 2019-2029 (US$m, Rest of Asia-Pacific Total Market Sales AGR %)
Figure 11.1 ROW Automotive Smart Glass Technology Type Submarket Forecasts 2019-2029 (US$m, AGR %)
Figure 11.2 ROW Automotive Smart Glass Technology Type Submarket Forecast (AGR%) 2019-2029
Figure 11.3 ROW Automotive Smart Glass Technology Type Submarket Share Forecast 2019, 2024 and 2029 (% Share)
Figure 11.4 ROW Automotive Smart Glass Application Submarket Forecast 2019-2029 (US$m, AGR %)
Figure 11.5 ROW Automotive Smart Glass Application Submarket Forecast (AGR%) 2019-2029
Figure 11.6 ROW Automotive Smart Glass Application Submarket Forecast 2019, 2024 and 2029 (% Share)
Figure 11.7 ROW Automotive Smart Glass - Glass Type Submarket Forecast 2019-2029 (US$m, AGR %)
Figure 11.8 ROW Automotive Smart Glass - Glass Type Submarket Forecast (AGR%) 2019-2029
Figure 11.9 ROW Automotive Smart Glass - Glass Type Submarket Forecast 2019, 2024 and 2029 (% Share)
Figure 11.10 ROW Automotive Smart Glass - Vehicle Type Submarket Forecast 2019-2029 (US$m, AGR %)
Figure 11.11 ROW Automotive Smart Glass - Vehicle Type Submarket Forecast (AGR%) 2019-2029
Figure 11.12 ROW Automotive Smart Glass - Vehicle Type Submarket Forecast 2019, 2024 and 2029 (% Share)
Figure 11.13 ROW Automotive Smart Glass Market Forecast by Country 2019-2029 (US$m, AGR %)
Figure 11.14 ROW Automotive Smart Glass Market AGR Forecast by Country 2019-2029 (AGR%)
Figure 11.15 ROW Automotive Smart Glass Market Share Forecast by Country, 2019, 2024 and 2029 (% Share)
Figure 11.16 Brazil Automotive Smart Glass Market Forecast 2019-2029 (US$m, Brazil Total Market Sales AGR %)
Figure 11.17 Iran Automotive Smart Glass Market Forecast 2019-2029 (US$m, Iran Total Market Sales AGR %)
Figure 11.18 Turkey Automotive Smart Glass Market Forecast 2019-2029 (US$m, Turkey Total Market Sales AGR %)
Figure 11.19 Other Countries Automotive Smart Glass Market Forecast 2019-2029 (US$m, Other Countries Total Market Sales AGR %)
Figure 12.1 Key Recent Development Mapping.
Figure 13.1 Corning Inc. Total Company Sales 2015-2018 (US$m, AGR %)
Figure 13.2 Corning Inc. Sales by Geographical Segment of Business 2016-2018 (US$m, Total Company Sales, AGR %)
Figure 13.3 Corning Inc. Sales by Operating Segment of Business 2016-2018 (US$m, Total Company Sales, AGR %)
Figure 13.5 Compagnie de Saint-Gobain S.A. Total Company Sales 2015-2018 (US$m, AGR %)
Figure 13.6 Compagnie de Saint-Gobain S.A. Sales by Geographical Segment of Business 2016-2018 (US$m, Total Company Sales, AGR %)
Figure 13.7 Compagnie de Saint-Gobain S.A. Sales by Operating Segment of Business 2016-2018 (US$m, Total Company Sales, AGR %)
Figure 13.8 Compagnie de Saint-Gobain S.A. Portfolio Structure
Figure 13.9 AGC Corporation Sales Split by Geographical Segment of Business 2017 (%)
Figure 13.10 AGC Corporation Portfolio Structure
Figure 13.11 Gentex Corporation Total Company Sales 2014-2017 (US$m, AGR %)
Figure 13.12 Gentex Corporation Sales by Geographical Segment of Business 2015-2017 (US$m, Total Company Sales, AGR %)
Figure 13.13 Gentex Corporation Sales by Operating Segment of Business 2015-2017 (US$m, Total Company Sales, AGR %)
Figure 13.14 Gentex Corporation Portfolio Structure
Figure 13.15 Nippon Sheet Glass Company, Limited Total Company Sales 2015-2018 (US$m, AGR %)
Figure 13.16 Nippon Sheet Glass Company, Limited Sales Split by Geographical Segment of Business 2018
Figure 13.17 Nippon Sheet Glass Company, Limited Sales by Operating Segment of Business 2017-2018 (US$m, Total Company Sales, AGR %)
Acs-Armoured Car Systems GmbH
AGC Corporation
AGC Group
AGC Inc.
Alenia Aermacchi SPA
Alexandria Venture Investments
American Glass Products
AMG
Asahi Glass Co., Ltd.
ASPA
AT&T
Audi
Avery Dennison
Azimut-Benetti SpA
Bank of America
Beclawat Manufacturing
BMW
Boeing
Bosch
Brembo
BRG Group, Ltd.
Capricorn
Centigon France Sas
Chorum Technologies Inc.
Citala
Compagnie de Saint-Gobain S.A.
Corning Inc.
Craftsman Fabricated Glass, Ltd.
Cricursa Cristales Curvados S.A.
Custom Glass Corporation
Daihatsu Motor Co., Ltd.
Daimler AG
DANI
Diamond Glass
Diamond Sea Glaze Manufacturing Ltd.
DIC Corporation
Disney
DuPont
Ferrari SPA
Fiat
Film Technologies International
Finanziaria Industriale S.p.A.
Fingerprint
First Solar
Ford
Gauzy Ltd
Gentex
GKN Aerospace Transparency Systems Inc.
Glass Apps, LLC
Global Mirror GMBH & Co. KG
Halio International
Halio North America
Hermes Epitek
Hotel Technologies
iGlass Pty Ltd
Innovative Glass Corporation
Inspechtech Aero Service, Inc.
Investment Quebec
Isoclima S.p.A.
Katerra
Kerros Ltd (Intellitint)
Kinestral Technologies, Inc
Laminated Technologies Inc.
Leminur Enterprises Corp.
MDV Glass
Microsoft
Mimir Invest AB
MUFG
Nippon Sheet Glass Company, Limited
Nissan
NSG Group
Odakyu Electric Railway
Pagani Automobili S.p.A.
PepsiCo.
Pilkington Plc
Pirelli
Pittsburg Glass Works
Pleotint (Suntuitive)
Polaroid Corporation
Polytronix, Inc.
PPG Industries
Prelco Inc.
RavenWindow
Repetti SRL
Research Frontiers
Rinspeed
Saint Gobain
Salesforce
SIG RoofSpace Solutions
SK Holdings
Smartglass International Inc.
SPD Systems Inc..
SPD Technologies Inc.
Starbucks
Stirling Square Capital Partners
Teknoglass Solutions
Thermoview Industries, Inc.
Tint-IT JSC
Traco, Inc.
Uber
Versant Ventures
Vidriería Argentina S.A. (VASA)
Vidrio Andino
View Inc. (View Dynamic Glass)
Vision Systems
Wba Heusel Gmbh
Woelltech Gmbh
Yonomi
YPF
Organisations mentioned
Association of American Railroad (AAR)
Department of Public Safety
Division of Motor Vehicles (DMV)
Driver and Vehicle Standards Agency (DVSA)
FLHSMV
ISO
Motor Vehicle Commission (MVC)
National Renewable Energy Lab (NREL)
Puerto Rico Department of Transportation (DOT)
Safety Glazing Certification Council (SGCC)
Wyoming Department of Transportation (WYDOT)
Download sample pages
Complete the form below to download your free sample pages for Automotive Smart Glass Market Report 2019-2029
Related reports
-

100 Automotive Advanced Driver Assistance Systems (ADAS) Companies to Watch in 2019
The emergence of the automotive advanced driver assistance systems (ADAS) market and increasing R&D spending on semi-autonomous and fully automated...Full DetailsPublished: 07 December 2018 -

Autonomous Trucks Market Report 2020-2030
Visiongain anticipates that the Global Autonomous Trucks Market is projected to surpass US$7,328.6 million in 2030 while growing at a...
Full DetailsPublished: 30 April 2020 -

Automotive Composites Market Report 2019-2029
Visiongain has quantfied the automotive composites market at $18.51bn in 2019....Full DetailsPublished: 09 April 2019 -

Automotive Camera & Camera Module Market 2019-2029
The major advances being made in Advanced Driver Assistance Systems (ADAS) towards semi and fully Autonomous Technologies are hugely reliant...
Full DetailsPublished: 03 April 2019 -

Global Smart Coatings Market 2019-2029
Smart coatings were developed way back in time, however in recent years, advanced multifunctional materials have become a potential subset...
Full DetailsPublished: 01 January 1970 -

Smart Lock Market Report 2020-2030
- Drivers impacting the growth of the industry
- Growing Security and Safety Concerns
- Enhanced Features Compared With Traditional...Full DetailsPublished: 01 January 1970 -

Aramid Fiber Market Report 2020-2030
Visiongain’s new report Aramid Fiber Market Report 2020-2030: Forecasts by Product (Para-aramid, Meta-aramid), Application (Aerospace, Electrical Insulation, Frictional Materials, Optical...
Full DetailsPublished: 01 January 1970 -

Global Fiber Paper Filtration Market Report 2019-2029
Industrial gases are needed to be filtered from unnecessary impurities to enhance the quality of the commodities manufactured subsequently. Thereby,...
Full DetailsPublished: 01 January 1970 -

Automotive Embedded Software Market Report 2019-2029
The market for Automotive Embedded Software market is expected to be valued at US$ 2.39 billion in 2019. ...Full DetailsPublished: 15 January 2019 -

Smart Ports Market Report 2020-2030
Increasing expenditure in IoT and process automation systems across shipping industry is expected to drive significant revenue growth in the...
Full DetailsPublished: 06 April 2020
Download sample pages
Complete the form below to download your free sample pages for Automotive Smart Glass Market Report 2019-2029
Do you have any custom requirements we can help you with?
Any specific country, geo region, market segment or specific company information?
Email us today, we can discuss your needs and see how we can help: jamie.roberts@visiongain.com
Would you like a free report overview of the report of your choice?
If so, please drop an email to Jamie Roberts stating your chosen report title to jamie.roberts@visiongain.com
Visiongain automotive reports are compiled using a broad and rich mixture of both primary and secondary information to produce an overall industry outlook. In order to provide our clients with the best product possible product, we do not rely on any one single source of information. Visiongain analysts reach out to market-leading vendors and automotive industry experts but also review a wealth of financial data and product information from a vast range of sources. To find out more about our reports methodology please email jamie.roberts@visiongain.com
Would you like to get the latest Visiongain automotive reports catalogue?
What are the dynamic growth sectors? where are the regional business opportunities?
Which technologies will prevail and who are the leading companies succeeding in these sectors and why?
If you want definitive answers to business critical questions, discover Visiongain’s full range of business intelligence reports.
If so, please email Jamie Roberts on jamie.roberts@visiongain.com or call her today on +44 207 336 6100
Alliance of Automobile Manufacturers (USA)
Association of Russian Automakers
Audio Video Bridging (AVB)
China Association Of Automoblie Manufacturers
European Association of Automotive Suppliers
European Automobile Manufacturers’ Association
European Council for Automotive Research and Development
Former Society of Automotive Engineers
German Association of the Automotive Industry
International Organization of Motor Vehicle Manufacturers
In-Vehicle Infotainment (IVI)
Italian Association of the Automotive Industry
Japan Automobile Manufacturers Association
One-Pair Ether-Net
Society of Indian Automobile Manufacturers (SIAM)
Society of Motor Manufacturers and Traders
The International Council For Clean Transport
US National Highway Traffic Safety Administration
Latest Automotive news
Visiongain Publishes Connected Vehicle Market Report 2024-2034
The global Connected Vehicle market was valued at US$82.67 billion in 2023 and is projected to grow at a CAGR of 14.7% during the forecast period 2024-2034.
24 April 2024
Visiongain Publishes Automotive Electronics Market Report 2024-2034
The global Automotive Electronics market was valued at US$270.7 million in 2023 and is projected to grow at a CAGR of 8.7% during the forecast period 2024-2034.
15 April 2024
Visiongain Publishes Automobile AI and Generative Design Market Report 2024-2034
The global Automobile AI and Generative Design market was valued at US$630.7 million in 2023 and is projected to grow at a CAGR of 19% during the forecast period 2024-2034.
02 April 2024
Visiongain Publishes Vehicle to Grid (V2G) Market Report 2024-2034
The global Vehicle to Grid (V2G) market was valued at US$3,391 million in 2023 and is projected to grow at a CAGR of 27.6% during the forecast period 2024-2034.
08 March 2024
