Night vision systems (NVS) are one part of the growing adoption of broader Advanced Driver Assistance Systems (ADAS). Night vision systems enhance driver awareness in low light or poor visibility conditions, improve safety and reduce the risk of accidents. Recent developments in the night vision sector have led Visiongain to publish this timely report.
The $2.65bn night vision systems market is expected to flourish in the next few years because of government regulations and also because consumer awareness is expected to feed through in the latter part of the decade driving growth to new heights. If you want to be part of this growing industry, then read on to discover how you can maximise your investment potential.
Key selling points
• Definitive NVS market data
• Succinct NVS market analysis
• Technological insight
• Clear competitor analysis
• Actionable business recommendations
Report highlights
229 Tables, Charts, And Graphs
Analysis Of Key Players In NVS Technologies
• Continental
• Bosch
• Denso
• Autoliv
• Valeo
• ZF Friedrichshafen AG
• Aisin Seiki
• Delphi
• Magna
• Visteon
Analysis Of Key Automotive OEMs Involved In NVS Technologies
• BMW
• Daimler
• Ford
• General Motors
• Honda
• PSA Peugeot Citroen
• Renault
• Toyota
• Volkswagen
• Volvo
• Global Night Vision System Market Outlook And Analysis From 2019-2029
• NVS Vehicle Type Forecasts And Analysis From 2019-2029
• Passenger Car Forecast 2019-2029
• Commercial Vehicle Forecast 2019-2029
• NVS Technology Forecasts And Analysis From 2019-2029
• Far Infrared Automotive NVS Forecast 2019-2029
• Near Infrared Automotive NVS Forecast 2019-2029
• NVS Product Type Forecasts And Analysis From 2019-2029
• Active Automotive NVS Forecast 2019-2029
• Passive Automotive NVS Forecast 2019-2029
Regional NVS Market Forecasts From 2019-2029
North America Automotive NVS Forecast 2019-2029
• US Automotive NVS Forecast 2019-2029,
• Canada Automotive NVS Forecast 2019-2029
• Mexico Automotive NVS Forecast 2019-2029
Europe Automotive NVS Forecast 2019-2029
• Germany Automotive NVS Forecast 2019-2029
• UK Automotive NVS Forecast 2019-2029
• France Automotive NVS Forecast 2019-2029
• Italy Automotive NVS Forecast 2019-2029
• Rest of Europe Automotive NVS Forecast 2019-2029
Asia Pacific Automotive NVS Forecast 2019-2029
• South Korea Automotive NVS Korea Forecast 2019-2029
• China Automotive NVS Forecast 2019-2029
• Japan Automotive NVS Forecast 2019-2029
• India Automotive NVS Forecast 2019-2029
• Rest of Asia Pacific Automotive NVS Forecast 2019-2029
Rest of the World Automotive NVS Forecast 2019-2029
• Brazil Automotive NVS Forecast 2019-2029
• Russia Automotive NVS Forecast 2019-2029
• Others Automotive NVS Forecast 2019-2029
Key questions answered
• How is the NVS market evolving?
• What is driving and restraining NVS market dynamics?
• How will each NVS submarket segment grow over the forecast period and how much sales will these submarkets account for in 2029?
• Which NVS submarket will be the main driver of the overall market from 2019-2029?
• Who are the leading players and what are their prospects over the forecast period?
Target audience
• Leading NVS companies
• Automotive OEMs
• Component suppliers
• Software developers
• Electronics companies
• R&D engineers
• Technologists
• R&D staff
• Consultants
• Market analysts
• Senior executives
• Business development managers
• Banks
• Investors
• Governments
• Agencies
• Regulators
• Industry organisations
• Transport safety organisations
Visiongain is a trading partner with the US Federal Government
CCR Ref number: KD4R6
1 Report Overview
1.1 Automotive Night Vision System Market Overview
1.2 Why You Should Read This Report
1.3 How This Report Delivers
1.4 Key Questions Answered by This Analytical Report Include:
1.5 Who is This Report For?
1.6 Methodology
1.6.1 Secondary Research
1.6.2 Market Evaluation & Forecasting Methodology
1.7 Frequently Asked Questions (FAQ)
1.8 Associated Visiongain Reports
1.9 About Visiongain
2. Introduction to the Night Vision System Market
2.1 Night Vision System Market Structure
2.2 Market Definition
2.3 Automotive Night Vision System Market by Product Definitions
2.3.1 Active Night Vision System Submarket Definition
2.3.2 Passive Night Vision System Submarket Definition
2.4 Night Vision System Market by Technology Definitions
2.4.1 Near Infrared Technology Based Submarket Definition
2.4.2 Far Infrared Technology Based Submarket Definition
2.5 Night Vision System Market by Vehicle Definitions
2.5.1 Passenger Cars Based Submarket Definition
2.5.2 Commercial Vehicle Based Submarket Definition
3. Automotive Night Vision System Market 2019-2029
3.1 Night Vision System Market Forecast 2019-2029
3.2 Night Vision System Drivers & Restraints
3.2.1 Night Vision System Market Drivers 2019
3.2.1.1 Government Regulations Regarding Safety Will Boost The Penetration Of Night Vision System.
3.2.1.2 Increasing Investments Towards Semi-Autonomous And Autonomous Vehicles
3.2.1.3 Technology innovations make Night Vision System a strong product differentiator
3.2.1.4 Increasing Sales Of Luxury Vehicles
3.2.2 Night Vision System Market Restraints 2019
3.2.2.1 High Cost
3.2.2.2 Limited Functionality of Sensors
3.2.2.3 Frequent Changes Required In Technology
4. Night Vision System Submarket Forecast 2019-2029
4.1 Night Vision System Vehicle Type Forecast 2019-2029
4.1.1 Night Vision System Passenger Cars Forecast by Region 2019-2029
4.1.2 Night Vision System Commercial Vehicles Forecast by Region 2019-2029
4.2 Night Vision System Product Forecast 2019-2029
4.2.1 Active Night Vision System Market Forecast by Region 2019-2029
4.2.2 Passive Night Vision System Market Forecast 2019-2029
4.3 Night Vision System Technology Forecast 2019-2029
4.3.1 FIR Night Vision System Forecast 2019-2029
4.3.2 NIR Night Vision System Forecast 2019-2029
5 Leading Regional Night Vision System Markets Forecast 2019-2029
5.1 Overview of Regional Night Vision System Market Forecast
5.2 North America Night Vision System Market Forecast 2019-2029
5.2.1 North America Night Vision System Vehicle Type Market Forecast 2019-2029
5.2.2 North America Night Vision System Product Market Forecast 2019-2029
5.2.3 North America Active Night Vision System Technology Market Forecast 2019-2029
5.2.4 North America Night Vision System Market Country Forecast 2019-2029
5.3 Europe Night Vision System Market Forecast 2019-2029
5.3.1 Europe Night Vision System Vehicle Type Market Forecast 2019-2029
5.3.2 Europe Night Vision System Product Market Forecast 2019-2029
5.3.3 Europe Active Night Vision System Technology Market Forecast 2019-2029
5.3.4 Europe Night Vision System Market Country Forecast 2019-2029
5.4 Asia-Pacific Night Vision System Market Forecast 2019-2029
5.4.1 Asia-Pacific Night Vision System Vehicle Type Market Forecast 2019-2029
5.4.2 Asia-Pacific Night Vision System Product Market Forecast 2019-2029
5.4.3 Asia-Pacific Active Night Vision System Technology Market Forecast 2019-2029
5.4.4 Asia-Pacific Night Vision System Market Country Forecast 2019-2029
5.5 RoW Night Vision System Market Forecast 2019-2029
5.5.1 RoW Night Vision System Vehicle Type Market Forecast 2019-2029
5.5.2 RoW Night Vision System Product Market Forecast 2019-2029
5.5.3 RoW Active Night Vision System Technology Market Forecast 2019-2029
5.5.4 RoW Night Vision System Country Market Forecast 2019-2029
6 Leading 10 International Night Vision System Companies
6.1 Leading 10 International Night Vision System Companies 2019
6.2 Continental AG
6.2.1 Introduction
6.2.2 Continental AG Total Company Sales 2013 - 2017
6.2.3 Continental AG Sales by Segment of Business 2013-2017
6.2.4 Continental AG Net Income / Loss 2013-2017
6.2.5 Continental AG Sales by Regional Segment of Business 2013-2017
6.2.6 Continental AG Analysis
6.2.6.1 SWOT Analysis
6.2.6.2 Continental AG Future Outlook
6.3 Bosch
6.3.1 Introduction
6.3.2 Bosch Total Company Sales 2013-2017
6.3.3 Bosch Sales by Segment of Business 2013-2017
6.3.4 Bosch Net Income / Loss 2013-2017
6.3.5 Bosch Sales by Regional Segment of Business 2013-2017
6.3.6 Bosch Analysis
6.3.6.1 SWOT Analysis
6.3.6.2 Bosch Future Outlook
6.4 Denso Corporation
6.4.1 Introduction
6.4.2 Denso Corporation Net Income 2013-2017
6.4.3 Denso Corporation Total Company Sales 2013-2017
6.4.4 Denso Corporation Net Income 2013-2017
6.4.5 Denso Corporation Sales by Segment of Business 2013-2017
6.4.6 Denso Corporation Sales by Geographical Location 2013-2017
6.4.7 Denso Corporation Analysis
6.4.7.1 SWOT Analysis
6.4.7.2 Denso Corporation Future Outlook
6.5 Autoliv AB
6.5.1 Introduction
6.5.2 Autoliv AB Total Company Sales 2013-2017
6.5.3 Autoliv AB Net Income 2013-2017
6.5.4 Autoliv Sales by Segment of Business 2013-2017
6.5.5 Autoliv AB Sales by Regional Segment of Business 2013-2017
6.5.6 Autoliv Analysis
6.5.6.1 Autoliv AB SWOT Analysis
6.5.6.2 Autoliv AB Future Outlook
6.6 Valeo
6.6.1 Introduction
6.6.2 Valeo Total Company Sales 2013-2017
6.6.3 Valeo Sales by Segment of Business 2013-2017
6.6.4 Valeo Corporation Sales by Segment of Region 2013-2017
6.6.5 Valeo Analysis
6.6.5.1 Valeo SWOT Analysis
6.6.5.2 Valeo Future Outlook
6.7 ZF Friedrichshafen AG
6.7.1 Introduction
6.7.2 ZF Friedrichshafen AG Total Company Sales 2013-2017
6.7.3 ZF Friedrichshafen AG Net Income 2013-2017
6.7.4 ZF Friedrichshafen AG Sales by Segment of Business 2013-2017
6.7.5 ZF Friedrichshafen AG Sales by Regional Segment of Business 2013-2017
6.7.6 ZF Friedrichshafen AG Analysis
6.7.6.1 ZF Friedrichshafen AG SWOT Analysis
6.7.6.2 ZF Friedrichshafen AG Future Outlook
6.8 Aisin Seiki
6.81. Introduction
6.8.2 Aisin Seiki Total Company Sales 2013 - 2017
6.8.3 Aisin Seiki Sales by Segment of Business 2013-2017
6.8.4 Aisin Seiki Net Income / Loss 2013-2017
6.8.5 Aisin Seiki Sales by Regional Segment of Business 2013-2017
6.8.6 Aisin Seiki Analysis
6.8.6.1 SWOT Analysis
6.8.6.2 Aisin Seiki Future Outlook
6.9 Delphi
6.9.1 Introduction
6.9.2 Delphi Total Company Sales 2013 - 2017
6.9.3 Delphi Sales by Segment of Business 2015-2017
6.9.4 Delphi Net Income / Loss 2013-2017
6.9.5 Delphi Sales by Regional Segment of Business 2015-2017
6.9.6 Delphi Analysis
6.9.6.1 SWOT Analysis
6.9.6.2 Delphi Future Outlook
6.10 Magna
6.10.1 Introduction
6.10.2 Magna Total Company Sales 2013 - 2017
6.10.3 Magna Sales by Segment of Business 2013-2017
6.10.4 Magna Net Income / Loss 2013-2017
6.10.5 Magna Sales by Regional Segment of Business 2013-2017
6.10.6 Magna Analysis
6.10.6.1 SWOT Analysis
6.10.6.2 Magna Future Outlook
6.11 Visteon Corporation
6.11.1 Introduction
6.11.2 Visteon Corporation Total Company Sales 2013-2017
6.11.3 Visteon Corporation Sales by Segment of Business 2013-2017
6.11.4 Visteon Corporation Net Income / Loss 2013-2017
6.11.5 Visteon Corporation Sales by Regional Segment of Business 2013-2017
6.11.6 Visteon Corporation
6.11.6.1 SWOT Analysis
6.11.6.2 Visteon Corporation Future Outlook
7. Leading 5 Vehicle Manufacturers Incorporating Night Vision Systems
7.1 Leading 5 Vehicle Manufacturers Incorporating Night Vision System 2019
7.2 Volkswagen Group AG Company Overview
7.2.1 Volkswagen’s Role in the ADAS Technology
7.3 BMW AG Company Overview
7.3.1 BMW’s Role in the ADAS Technology
7.4 Daimler AG Company Overview
7.4.1 Daimler’s Role in the ADAS Technology
7.5 Ford Motor Company Overview
7.5.1 Ford’s Role in the ADAS Technology
7.6 General Motors (GM) Company Overview
7.6.1 GM’s Role in the ADAS Technology
7.7 Honda Motor Company Overview
7.7.1 Honda’s Role in the Automotive ADAS Technology
7.8 Volvo Group Company Overview
7.8.1 Volvo’s Role in the ADAS Technology
7.9 Toyota Motor Company Overview
7.9.1 Toyota’s Role in the ADAS Technology
7.10 PSA Peugeot Citroen Company Overview
7.10.1 PSA’s Role in the ADAS Technology
7.11 Renault Company Overview
7.11.1 Renault’s Role in the ADAS Technology
7.12 Other Prominent Companies in Night Vision System Market
8. Conclusions and Recommendations
9. Glossary
List of Tables
Table 3.1 Night Vision System Market Forecast 2019-2029 (US$m, AGR %, CAGR %, Cumulative)
Table 3.2 Night Vision System Market Drivers & Restraints 2019
Table 4.1 Night Vision System Vehicle Type Submarket Forecast 2019-2029 (US$m, AGR %, Cumulative)
Table 4.2 Night Vision System Passenger Cars Submarket by Regional Market Forecast 2019-2029 (US$m, AGR %, CAGR %, Cumulative)
Table 4.3 Night Vision System Commercial Vehicles Submarket by Regional Market Forecast 2019-2029 (US$m, AGR %, CAGR %, Cumulative)
Table 4.4 Night Vision System Product Submarket Forecast 2019-2029 (US$m, AGR %, Cumulative)
Table 4.5 Active Night Vision System Submarket by Regional Market Forecast 2019-2029 (US$m, AGR %, CAGR %, Cumulative)
Table 4.6 Passive Night Vision System Submarket by Regional Market Forecast 2019-2029 (US$m, AGR %, CAGR %, Cumulative)
Table 4.7 Active Night Vision System Technology Submarket Forecast 2019-2029 (US$m, AGR %, Cumulative)
Table 4.8 Active FIR Night Vision System Submarket by Regional Market Forecast 2019-2029 (US$m, AGR %, CAGR %, Cumulative)
Table 4.9 Active NIR Night Vision System Submarket by Regional Market Forecast 2019-2029 (US$m, AGR %, CAGR %, Cumulative)
Table 5.1 Night Vision System Market by Regional Submarket Forecast 2019-2029 (US$m, Global AGR %, Cumulative)
Table 5.2 North America Night Vision System Market Forecast 2019-2029 (US$m, AGR %, CAGR %, Cumulative)
Table 5.3 North America Night Vision System Market Forecast by Product 2019-2029 (US$m, Cumulative)
Table 5.4 North America Active Night Vision System Market Forecast by Technology 2019-2029 (US$m, Cumulative)
Table 5.5 North America Night Vision System Market Forecast by Country 2019-2029 (US$m, AGR %, Cumulative)
Table 5.6 Europe Night Vision System Market Forecast 2019-2029 (US$m, AGR %, CAGR %, Cumulative)
Table 5.7 Europe Night Vision System Market Forecast by Vehicle Type 2019-2029 (US$m, Cumulative)
Table 5.8 Europe Night Vision System Market Forecast by Product 2019-2029 (US$m, Cumulative)
Table 5.9 Europe Active Night Vision System Market Forecast by Technology 2019-2029 (US$m, Cumulative)
Table 5.10 Europe Night Vision System Market Forecast by Country 2019-2029 (US$m, AGR %, CAGR %, Cumulative)
Table 5.11 Asia Pacific Night Vision System Market Forecast 2019-2029 (US$m, AGR %, CAGR %, Cumulative)
Table 5.12 Asia-Pacific Night Vision System Market Forecast by Vehicle Type 2019-2029 (US$m, CAGR %)
Table 5.13 Asia-Pacific Night Vision System Market Forecast by Product 2019-2029 (US$m, Cumulative)
Table 5.14 Asia-Pacific Active Night Vision System Market Forecast by Technology 2019-2029 (US$m, Cumulative)
Table 5.15 Asia-Pacific Night Vision System Market Forecast by Country 2019-2029 (US$m, AGR %, CAGR %, Cumulative)
Table 5.16 RoW Night Vision System Market Forecast 2019-2029 (US$m, AGR %, CAGR %, Cumulative)
Table 5.17 RoW Night Vision System Market Forecast by Vehicle Type 2019-2029 (US$m, Cumulative)
Table 5.18 RoW Night Vision System Market Forecast by Product 2019-2029 (US$m, Cumulative)
Table 5.19 RoW Active Night Vision System Market Forecast by Technology 2019-2029 (US$m, Cumulative)
Table 5.20 RoW Night Vision System Market Forecast by Country 2019-2029 (US$m, Cumulative)
Table 6.1 Leading 10 International Night Vision System Companies Listed Alphabetically (Company, FY 2017 Total Company Sales US$m Latest, HQ)
Table 6.2 Continental AG Profile 2017 (CEO, Total Company Sales US$m, Net Income US$m, HQ, Founded, No. of Employees, Ticker, Website)
Table 6.3 Continental AG Total Company Sales 2013-2017 (US$m, AGR %)
Table 6.4 Continental AG Sales by Segment of Business 2013-2017 (US$m, AGR %)
Table 6.5 Continental AG Net Income / Loss 2013-2017 (US$m)
Table 6.6 Continental AG Sales by Regional Segment of Business 2013-2017 (US$m, AGR %)
Table 6.7 Continental AG SWOT Analysis
Table 6.8 Bosch Profile 2017 (CEO, Total Company Sales US$m, Net Income US$m, HQ, Founded, No. of Employees, Ticker, Website)
Table 6.9 Bosch, Total Company Sales 2013-2017 (US $m, AGR %)
Table 6.10 Bosch Sales by Segment of Business 2013-2017 (US$m, AGR %)
Table 6.11 Bosch Net Income / Loss 2013-2017 (US$m)
Table 6.12 Bosch Sales by Regional Segment of Business 2013-2017 (US$m, AGR %)
Table 6.13 Bosch SWOT Analysis
Table 6.14 Denso Corporation Profile 2017 (CEO, Total Company Sales US$m, Net Income US$m, HQ, Founded, No. of Employees, Ticker, Website)
Table 6.15 Denso Corporation Net Earnings 2011-2015 (US$m, AGR%)
Table 6.16 Denso Corporation Total Company Sales 2013-2017 (US$m, AGR%)
Table 6.17 Denso Corporation Net Income 2013-2017 (US$m, AGR%)
Table 6.18 Denso Corporation Sales by Segment of Business 2013-2017 (US$m)
Table 6.19 Denso Corporation Sales by Geographical Location 2015-2017 (US$m, AGR%)
Table 6.20 Denso Corporation SWOT Analysis
Table 6.21 Autoliv AB Profile 2017 (CEO, Total Company Sales US$m, Net Income US$m, Net Capital Expenditure US$m, HQ, Founded, IR Contact, Ticker, Website)
Table 6.23 Autoliv AB Total Company Sales 2013-2017 (US$m, AGR%)
Table 6.22 Autoliv AB Net Earnings 2013-2017 (US$m, AGR%)
Table 6.23 Autoliv AB Sales by Segment of Business 2015-2017 (US$m, AGR%)
Table 6.24 Autoliv Sales by Regional Segment of Business 2013-2017 (US$m, AGR %)
Table 6.25 Autoliv AB SWOT Analysis
Table 6.26 Valeo Profile 2017 (CEO, Total Company Sales US$m, Net Income US$m, Net Capital Expenditure US$m, HQ, Founded, IR Contact, Ticker, Website)
Table 6.27 Valeo Total Company Sales 2013-2017 (US$m, AGR%)
Table 6.28 Valeo Sales by Segment of Business 2015-2017 (US$m, AGR%)
Table 6.29 Valeo Sales by Regional Segment of Business 2013-2017 (US$m, AGR%)
Table 6.30 Valeo SWOT Analysis
Table 6.31 ZF Friedrichshafen AG Profile 2017 (CEO, Total Company Sales US$m, Net Income US$m, Net Capital Expenditure US$m, HQ, Founded, IR Contact, Ticker, Website)
Table 6.32 ZF Friedrichshafen AG Total Company Sales 2013-2017 (US$m, AGR%)
Table 6.33 ZF Friedrichshafen AG Net Earnings 2013-2017 (US$m, AGR%)
Table 6.34 ZF Friedrichshafen AG Sales by Segment of Business 2015-2017 (US$m, AGR%)
Table 6.35 ZF Friedrichshafen AG Sales by Regional Segment of Business 2013-2017 (US$m, AGR %)
Table 6.36 ZF Friedrichshafen AG SWOT Analysis
Table 6.37 Aisin Seiki Profile 2017 (CEO, Total Company Sales US$m, Net Income US$m, HQ, Founded, No. of Employees, Ticker, Website)
Table 6.38 Aisin Seiki Total Company Sales 2013-2017 (US$m, AGR %)
Table 6.39 Aisin Seiki Sales by Segment of Business 2013-2017 (US$m, AGR %)
Table 6.40 Aisin Seiki SE Net Income / Loss 2013-2017 (US$m)
Table 6.41 Aisin Seiki Sales by Regional Segment of Business 2013-2017 (US$m, AGR %)
Table 6.42 Aisin Seiki SWOT Analysis
Table 6.43 Delphi Profile 2017 (CEO, Total Company Sales US$m, Net Income US$m, HQ, Founded, No. of Employees, Ticker, Website)
Table 6.44 Delphi Total Company Sales 2013-2017 (US$m, AGR %)
Table 6.45 Delphi Sales by Segment of Business 2015-2017 (US$m, AGR %)
Table 6.46 Delphi Net Income / Loss 2013-2017 (US$m)
Table 6.47 Delphi Sales by Regional Segment of Business 2015-2017 (US$m, AGR %)
Table 6.48 Delphi SWOT Analysis
Table 6.49 Magna Profile 2017 (CEO, Total Company Sales US$m, Net Income US$m, HQ, Founded, No. of Employees, Ticker, Website)
Table 6.50 Magna Total Company Sales 2013-2017 (US$m, AGR %)
Table 6.51 Magna Sales by Segment of Business 2013-2017 (US$m, AGR %)
Table 6.52 Magna Net Income / Loss 2013-2017 (US$m)
Table 6.53 Magna Sales by Regional Segment of Business 2013-2017 (US$m, AGR %)
Table 6.54 Magna SWOT Analysis
Table 6.55 Visteon Corporation Profile 2018 (CEO, Total Company Sales US$m, Net Income US$m, HQ, Founded, No. of Employees, Ticker, Website)
Table 6.56 Visteon Corporation Total Company Sales 2013-2017 (US$m, AGR %)
Table 6.57 Visteon Corporation Sales by Segment of Business 2013-2017 (US$m, AGR %)
Table 6.58 Visteon Corporation Net Income / Loss 2013-2017 (US$m)
Table 6.59 Visteon Corporation Sales by Regional Segment of Business 2013-2017 (US$m, AGR %)
Table 6.60 Visteon Corporation SWOT Analysis
Table 7.1 Leading 10 Vehicle Manufacturers Incorporating Night Vision System (Company, FY 2017 Total Company Sales US$m* Latest, HQ)
Table 7.2 Volkswagen Overview (Revenue, HQ, Market Cap, Ticker, No. of Employees, IR, Contact, Website)
Table 7.3 BMW AG Overview (Revenue, No. of Employees, HQ, Ticker, Contact, Website)
Table 7.4 Daimler AG Overview (Revenue, HQ, Ticker, IR, Website)
Table 7.5 Ford Overview (Revenue, HQ, Market Share in Car Sales, No of Employees, Ticker, Contact, Website)
Table 7.6 General Motors Company Overview (Revenue, HQ, Ticker, Contact, Website)
Table 7.7 GM’s Financials 2011-2017 (6-Year Revenue, Gross Profit, Operating Income, Net Income, Diluted EPS), (In $Million Apart from EPS)
Table 7.8 Honda Motor Company Overview (Revenue, HQ, Ticker, Website)
Table 7.9 Volvo Group Company Overview (Revenue, HQ, IR Contact, Website)
Table 7.10 Toyota Overview (Revenue, HQ, Market Cap, Ticker, No. of Employees, IR, Contact, Website)
Table 7.11 PSA Company Overview (Revenue, HQ, Ticker, IR Contact, Website)
Table 7.12 Renault Company Overview (Total Revenue, HQ, Ticker, IR Contact, Website)
Table 7.13 Other Prominent Companies in the Night Vision Systems Market
List of Figures
Figure 2.1 Night Vision System Market Segmentation Overview
Figure 3.1 Night Vision System Market Forecast 2019-2029 (US$m, Global AGR %)
Figure 4.1 Night Vision System Vehicle Type Submarket AGR Forecast 2019-2029 (AGR %)
Figure 4.2 Night Vision System Vehicle Type Market Forecast 2019-2029 (US$m, Global AGR %)
Figure 4.3 Night Vision System Vehicle Type Submarket Shares Forecast 2019 (% Share)
Figure 4.4 Night Vision System Vehicle Type Submarket Shares Forecast 2024 (% Share)
Figure 4.5 Night Vision System Vehicle Type Submarket Shares Forecast 2029 (% Share)
Figure 4.6 Night Vision System Passenger Cars Submarket Forecast by Regional Market 2019-2029 (US$m)
Figure 4.7 Night Vision System Passenger Cars Share by Region 2019 (% Share)
Figure 4.8 Night Vision System Passenger Cars Share by Region 2024 (% Share)
Figure 4.9 Night Vision System Passenger Cars Share by Region 2029 (% Share)
Figure 4.10 Night Vision System Commercial Vehicles Submarket Forecast by Regional Market 2019-2029 (US$m)
Figure 4.11 Night Vision System Commercial Vehicles Market Share by Region 2019 (% Share)
Figure 4.12 Night Vision System Commercial Vehicle Market Share by Region 2024 (% Share)
Figure 4.13 Night Vision System Commercial Vehicle Market Share by Region 2029 (% Share)
Figure 4.14 Night Vision System Product Submarket AGR Forecast 2019-2029 (AGR %)
Figure 4.15 Night Vision System Product Market Forecast 2019-2029 (US$m, Global AGR %)
Figure 4.16 Night Vision System Product Submarket Shares 2019 (% Share)
Figure 4.17 Night Vision System Product Submarket Shares 2024 (% Share)
Figure 4.18 Night Vision System Product Submarket Shares 2029 (% Share)
Figure 4.19 Active Night Vision System Submarket Forecast by Regional Market 2019-2029 (US$m)
Figure 4.20 Active Night Vision System Share by Region 2019 (% Share)
Figure 4.21 Active Night Vision System Share by Region 2024 (% Share)
Figure 4.22 Active Night Vision System Share by Region 2029 (% Share)
Figure 4.23 Passive Night Vision System Submarket Forecast by Regional Market 2019-2029 (US$m)
Figure 4.24 Passive Night Vision System Share by Region 2019 (% Share)
Figure 4.25 Passive Night Vision System Share by Region 2024 (% Share)
Figure 4.26 Passive Night Vision System Share by Region 2029 (% Share)
Figure 4.27 Active Night Vision System Technology Submarket AGR Forecast 2019-2029 (AGR %)
Figure 4.28 Active Night Vision System Technology Market Forecast 2019-2029 (US$m, Global AGR %)
Figure 4.29 Active Night Vision System Technology Submarket Shares 2019 (% Share)
Figure 4.30 Active Night Vision System Technology Submarket Shares 2024 (% Share)
Figure 4.31 Active Night Vision System Technology Submarket Shares 2029 (% Share)
Figure 4.32 Active FIR Night Vision System Submarket Forecast by Regional Market 2019-2029 (US$m)
Figure 4.33 Active FIR Night Vision System Share by Region 2019 (% Share)
Figure 4.34 Active FIR Night Vision System Share by Region 2024 (% Share)
Figure 4.35 Active FIR Night Vision System Share by Region 2029 (% Share)
Figure 4.36 Active NIR Night Vision System Submarket Forecast by Regional Market 2019-2029 (US$m)
Figure 4.37 Active NIR Night Vision System Share by Region 2019 (% Share)
Figure 4.38 Active NIR Night Vision System Share by Region 2024 (% Share)
Figure 4.39 Active NIR Night Vision System Share by Region 2029 (% Share)
Figure 5.1 Leading Regional Night Vision System Market Forecast 2019-2029 (US$m, Global AGR %)
Figure 5.2 Leading Regional Night Vision System Market Forecast 2019-2029 (Sales US$m, Global AGR %)
Figure 5.3 Night Vision System Market Share by Region 2019 (% Share)
Figure 5.4 Night Vision System Market Shares by Region 2024 (% Share)
Figure 5.5 Night Vision System Market Shares by Region 2029 (% Share)
Figure 5.6 North America Night Vision System Market Forecast 2019-2029 (US$m, AGR %)
Figure 5.7 North America Night Vision System Market Forecast by Vehicle Type 2019-2029 (US$m)
Figure 5.8 North America Night Vision System Market Forecast by Product 2019-2029 (US$m)
Figure 5.9 North America Active Night Vision System Market Forecast by Technology 2019-2029 (US$m)
Figure 5.10 North America Night Vision System Market Forecast by Country 2019-2029 (US$m, Global AGR %)
Figure 5.11 Europe Night Vision System Market Forecast 2019-2029 (US$m, AGR %)
Figure 5.12 Europe Night Vision System Market Forecast by Vehicle Type 2019-2029 (US$m)
Figure 5.13 Europe Night Vision System Market Forecast by Product 2019-2029 (US$m)
Figure 5.14 Europe Active Night Vision System Market Forecast by Technology 2019-2029 (US$m)
Figure 5.15 Europe Night Vision System Market Forecast by Country 2019-2029 (US$m, Global AGR %)
Figure 5.16 Asia Pacific Night Vision System Market Forecast 2019-2029 (US$m, AGR %)
Figure 5.17 Asia-Pacific Night Vision System Market Forecast by Vehicle Type 2019-2029 (US$m)
Figure 5.18 Asia-Pacific Night Vision System Market Forecast by Product 2019-2029 (US$m)
Figure 5.19 Asia-Pacific Active Night Vision System Market Forecast by Technology 2019-2029 (US$m)
Figure 5.20 Asia-Pacific Night Vision System Market Forecast by Country Market 2019-2029 (US$m, Global AGR %)
Figure 5.21 RoW Night Vision System Market Forecast 2019-2029 (US$m, AGR %)
Figure 5.22 RoW Night Vision System Market Forecast by Vehicle Type 2019-2029 (US$m)
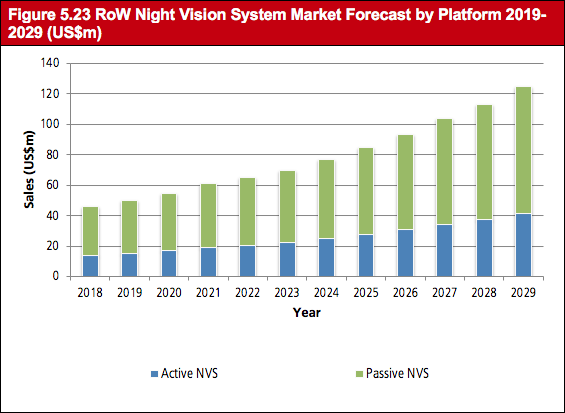
Figure 5.23 RoW Night Vision System Market Forecast by Platform 2019-2029 (US$m)
Figure 5.24 RoW Active Night Vision System Market Forecast by Technology 2019-2029 (US$m)
Figure 5.25 RoW Night Vision System Market Forecast by Country 2019-2029 (US$m)
Figure 6.1 Continental AG Total Company Sales 2013-2017 (US$ M, AGR %)
Figure 6.2 Continental AG Sales by Segment of Business 2013-2017 (US$m, Total Company Sales AGR %)
Figure 6.3 Continental AG Sales AGR by Segment of Business 2014-2017 (AGR %)
Figure 6.4 Continental AG Net Income / Loss 2013-2017 (US$m)
Figure 6.5 Continental AG Sales by Regional Segment of Business 2013-2017 (US$m, Total Company Sales AGR %)
Figure 6.6 Continental AG Sales AGR by Regional Segment of Business 2013-2017 (AGR %)
Figure 6.7 Bosch Total Company Sales 2013-2017 (US$m, AGR %)
Figure 6.8 Bosch Sales by Segment of Business 2013-2017 (US$m, Total Company Sales AGR %)
Figure 6.9 Bosch Sales AGR by Segment of Business 2014-2017 (AGR %)
Figure 6.10 Bosch Net Income / Loss 2013-2017 (US$m)
Figure 6.11 Bosch Sales by Regional Segment of Business 2013-2017 (US$m, Total Company Sales AGR %)
Figure 6.12 Bosch Sales AGR by Regional Segment of Business 2014-2017 (AGR %)
Figure 6.13 Denso Corporation Net Income 2013-2017 (US$m, AGR%)
Figure 6.14 Denso Corporation Total Company Sales 2013-2017 (US$m, AGR%)
Figure 6.15 Denso Corporation Net Income 2013-2017 (US$m, AGR%)
Figure 6.16 Denso Corporation Sales by Segment of Business 2015-2017 (US$m, Total Company Sales AGR%)
Figure 6.17 Denso Corporation Sales by Geographical Location 2015-2017 (US$m, Total Company Sales AGR%)
Figure 6.18 Autoliv AB Total Company Sales 2013-2017 (US$m, AGR%)
Figure 6.19 Autoliv AB Net Income 2013-2017 (US$m, AGR%)
Figure 6.20 Autoliv AB Sales by Segment of Business 2013-2017 (US$m, Total Company Sales AGR%)
Figure 6.21 Autoliv AB Sales by Regional Segment of Business 2013-2017 (US$m, Total Company Sales AGR %)
Figure 6.22 Valeo Total Company Sales 2013-2017 (US$m, AGR%)
Figure 6.23 Valeo Sales by Segment of Business 2013-2017 (US$m, Total Company Sales AGR%)
Figure 6.24 Valeo Sales by Regional Segment 2013-2017 (US$m, Total Company Sales AGR%)
Figure 6.25 ZF Friedrichshafen AG Total Company Sales 2013-2017 (US$m, AGR%)
Figure 6.26 ZF Friedrichshafen AG Net Income 2013-2017 (US$m, AGR%)
Figure 6.27 ZF Friedrichshafen AG Sales by Segment of Business 2013-2017 (US$m, Total Company Sales AGR%)
Figure 6.28 ZF Friedrichshafen AG Sales by Regional Segment of Business 2013-2017 (US$m, Total Company Sales AGR %)
Figure 6.29 Aisin Seiki Total Company Sales 2013-2017 (US$ M, AGR %)
Figure 6.30 Aisin Seiki Sales by Segment of Business 2013-2017 (US$m, Total Company Sales AGR %)
Figure 6.31 Aisin Seiki Sales AGR by Segment of Business 2014-2017 (AGR %)
Figure 6.32 Aisin Seiki Net Income / Loss 2013-2017 (US$m)
Figure 6.33 Aisin Seiki Sales by Regional Segment of Business 2013-2017 (US$m, Total Company Sales AGR %)
Figure 6.34 Aisin Seiki Sales AGR by Regional Segment of Business 2014-2017 (AGR %)
Figure 6.35 Delphi Total Company Sales 2013-2017 (US$ M, AGR %)
Figure 6.36 Delphi Sales by Segment of Business 2015-2017 (US$m, Total Company Sales AGR %)
Figure 6.37 Delphi Net Income / Loss 2013-2017 (US$m)
Figure 6.38 Delphi Sales by Regional Segment of Business 2015-2017 (US$m, Total Company Sales AGR %)
Figure 6.39 Magna Total Company Sales 2013-2017 (US$ M, AGR %)
Figure 6.40 Magna Sales by Segment of Business 2013-2017 (US$m, Total Company Sales AGR %)
Figure 6.41 Magna Sales AGR by Segment of Business 2014-2017 (AGR %)
Figure 6.42 Magna Net Income / Loss 2013-2017 (US$m)
Figure 6.43 Magna Sales by Regional Segment of Business 2013-2017 (US$m, Total Company Sales AGR %)
Figure 6.44 Magna Sales AGR by Regional Segment of Business 2014-2017 (AGR %)
Figure 6.45 Visteon Corporation Total Company Sales 2013-2017 (US$ M, AGR %)
Figure 6.46 Visteon Corporation Sales by Segment of Business 2013-2017 (US$m, Total Company Sales AGR %)
Figure 6.47 Visteon Corporation Sales AGR by Segment of Business 2013-2017 (AGR %)
Figure 6.48 Visteon Corporation Net Income / Loss 2013-2017 (US$m)
Figure 6.49 Visteon Corporation Sales by Regional Segment of Business 2013-2017 (US$m, Total Company Sales AGR %)
Figure 6.50 Visteon Corporation Sales AGR by Regional Segment of Business 2013-2017 (AGR %)
Figure 7.1 BMW Group Car Sales Overview 2013-2017 (Million Units)
Figure 7.2 Market Share in 2017 BMW Group’s Sales in Selected Regions (%)
Figure 7.3 Mercedes-Benz Car Sales’ Share Distribution in Selected Regions in 2017 (%)
AE system
AEI
AEye, Inc.
Aisin Group
Aisin Seiki
Ambarella
ATN Corporation
Audi
Autoliv
Bel
Bendix Commercial Vehicles Systems
BMW
Bosch
Bosch Group
Cadillac
Clarion
Continental AG
Daimler
Delphi
Denso Corporation
Elbit Systems
Ficosa
FLIR Systems
Ford
General Motors
Gentex Corporation
getrag
Gongcheng DENSO (Chongqing) Co., Ltd.
Harris
Hella KGaA Hueck & Co.
Hitachi
Honda
Ibeo Automotive Systems GmbH
Infineon Technologies AG
Innoviz Technologies, Ltd.
Integrated Micro-Electronics, Inc. (IMI)
Kyocera Corporation
L-3 Technologies Inc.
LeddarTech
Luminar Technologies, Inc.
Magna Electronics
Magna International Inc.
Magneti Marelli S.p.A.
Mazda
Meopta
Mercedes-Benz
Mobileye N.V.
Neptec Design Group Ltd.
Newcon Optik
Nissan
nuTonomy, Inc.
OmniVision Technologies
Omron Corporation
Optix
Phantom Intelligence
Princeton Lightwave, Inc.
PSA Peugeot Citroen
Quanergy Systems, Inc.
Raytheon
Renault
Robert Bosch GmbH
Rockwell Collins
Safradir EC
Samsung Electro Mechanics
Samvardhana Motherson Reflectec
Satire
Shenzhen Protruly Electronics Co. Ltd.
Stonkam Co., Ltd.
Suzuki
Teledyne Technologies Incorporated
Tesla
Tetravue, Inc.
Thales
Toyota
TriLumina
TRW Automotive
Valeo
Velodyne
Velodyne LiDAR Inc.
Visteon Corporation
Volkswagen
Volvo
Wuyang-Honda Motors (Guangzhou) Co., Ltd.,
ZF Friedrichshafen AG
Organisations mentioned
European Commission
Euro-NCAP