Industries > Automotive > Car Sharing Market Report 2019-2029
Car Sharing Market Report 2019-2029
Forecasts by Model (Peer-to-Peer (P2P), Point-to-Point Free-Floating, Point-to-Point Station Based), by Business Model (Round Trip, One-Way), by Application (Business, Private), by Region Plus Analysis of Leading Companies Developing Technologies for Ride Sharing, Shared Mobility & On-Demand Mobility
• Do you need definitive Car Sharing market data?
• Succinct Car Sharing market analysis?
• Technological insight?
• Clear competitor analysis?
• Actionable business recommendations?
The Car Sharing market from 2019-2029 will drive a major transformative effect in the way people use vehicles. Visiongain assesses that the Car Sharing market will reach $2.4bn in 2019. There will be exponential growth in the sales and utilisation of Car Sharing and its technology.
During this period, the Peer-to-peer model will be one of the fastest growing segments of the Car Sharing market. This brand-new in-depth Car Sharing Market Report 2019-2029 describes trends in the market both quantitatively and qualitatively. In recent years, this global Car Sharing market has undergone increasing investment, as the importance of mobility is surging in both developed and developing nations.
Report highlights
• 123 Tables, Charts, And Graphs
• Analysis Of Key Players In The Car Sharing Market
• DriveNow GmbH & Co. KG
• ORIX Corporation
• Lyft, Inc.
• Zipcar, Inc
• Modo Co-operative
• Getaround, Inc
• The Hertz Corporation
• Cambio CarSharing
• car2go NA, LLC
• GoGet Carshare
• Uber Technologies, Inc.
• Cityhop
• Global Car Sharing Market Outlook And Analysis From 2019-2029
• Car Sharing Model Forecasts And Analysis From 2019-2029
• Peer-To-Peer (P2P) Car Sharing Forecast 2019-2029
• Point-To-Point Free-Floating Car Sharing Forecast 2019-2029
• Point-To-Point Station Based Car Sharing Forecast 2019-2029
• Car Sharing Application Forecasts And Analysis From 2019-2029
• Business Car Sharing Forecast 2019-2029
• Private Car Sharing Forecast 2019-2029
• Car Sharing Business Model Forecasts And Analysis From 2019-2029
• Round Trip Sharing Forecast 2019-2029
• One Way Car Sharing Forecast 2019-2029
• Regional Car Sharing Market Forecasts From 2019-2029
• North America Car Sharing Forecast 2019-2029
• US Car Sharing Forecast 2019-2029
• Canada Car Sharing Forecast 2019-2029
• Mexico Car Sharing Forecast 2019-2029
• Europe Car Sharing Forecast 2019-2029
• Germany Car Sharing Forecast 2019-2029
• UK Car Sharing Forecast 2019-2029
• France Car Sharing Forecast 2019-2029
• Italy Car Sharing Forecast 2019-2029
• Switzerland Car Sharing Forecast 2019-2029
• Austria Car Sharing Forecast 2019-2029
• Netherlands Car Sharing Forecast 2019-2029
• Sweden Car Sharing Forecast 2019-2029
• Spain Car Sharing Forecast 2019-2029
• Belgium Car Sharing Forecast 2019-2029
• Rest of Europe Car Sharing Forecast 2019-2029
• Asia Car Sharing Forecast 2019-2029
• China Car Sharing Forecast 2019-2029
• Japan Car Sharing Forecast 2019-2029
• India Car Sharing Forecast 2019-2029
• South Korea Car Sharing Forecast 2019-2029
• Rest of Asia Car Sharing Forecast 2019-2029
• Oceania Car Sharing Forecast 2019-2029
• Australia Car Sharing Forecast 2019-2029
• Rest of Oceania Car Sharing Forecast 2019-2029
• Latin America Car Sharing Forecast 2019-2029
• Brazil Car Sharing Forecast 2019-2029
• Rest of Latin America Car Sharing Forecast 2019-2029
• Key questions answered
• What does the future hold for the Car Sharing industry?
• Where should you target your business strategy?
• Which applications should you focus upon?
• Which disruptive technologies should you invest in?
• Which companies should you form strategic alliances with?
• Which company is likely to success and why?
• What business models should you adopt?
• What industry trends should you be aware of?
Target audience
• Leading car sharing companies
• On-demand mobility specialists
• Telematics companies
• Autonomous vehicle companies
• Automotive OEMs
• Automotive engineers
• Technologists
• R&D staff
• Consultants
• Market analysts
• Executives
• Business development managers
• Investors
• Governments
• Agencies
• Industry organisations
• Banks
Visiongain is a trading partner with the US Federal Government
CCR Ref number: KD4R6
1.1 Global Car Sharing Market Overview
1.2 Research Methodology
1.3 Primary Research
1.4 Secondary Research
1.5 Market Evaluation & Forecasting Methodology
1.6 Global Car Sharing Market Segment
1.7 Overview of Findings
1.8 Why You Should Read This Report
1.9 How This Report Delivers?
1.10 Key Questions Answered by This Analytical Report
1.11 Frequently Asked Questions (FAQ)
1.12 How is the report delivered?
1.13 Who is This Report For?
2. Introduction to Car Sharing Market
2.1 What is Car Sharing?
2.1.1 Round Trip Carsharing Submarket
2.1.2 Peer-To-Peer (P2P) Carsharing Submarket
2.1.3 Point-To-Point Free-Floating Carsharing Submarket
2.1.4 Point-To-Point Station-Based Carsharing Submarket
2.1.5 Carsharing vs. Accessing
2.1.6 Is ‘Uber’ a Carsharing Service?
3. Global Car Sharing Market 2019-2029
3.1 Global Car Sharing Market Revenue Forecast 2019-2029
3.2 Car Sharing Market Analysis 2019-2029
3.3 Global Car Sharing Market Revenue Forecast by Region 2019-2029 ($Bn, AGR %, Cumulative)
3.4 Global Car Sharing Market Drivers 2019
3.4.1 Changing Consumption Culture
3.4.2 Resources Becoming More Scarce
3.4.3 Advancement of Digitalisation
3.4.4 Shifts in Demographics
4. Global Car Sharing Market by Product: Market Forecast to 2029
4.1 Global Car Sharing Market by Model Revenue (USD Million): Market Forecast to 2029
4.2 Car Sharing Market by Model Type Revenue Market Share Forecast
4.3 Peer-to-peer Car Sharing Market Forecast 2019-2029
4.3.1 Peer-to-peer Car Sharing Market Analysis 2019-2029
4.3.2 Why Car Owners Choose P2P Carsharing
4.3.3 Learn What the Barriers Are for Peer-To-Peer Carsharing Growth
4.3.4 Learn what Drives the Demand for Peer-To-Peer Carsharing
4.4 Point-to-point Car Sharing Market Forecast 2019-2029
4.4.1 Point-to-point Car Sharing Market Analysis 2019-2029
4.5 Point-to-point station-based Car Sharing Market Forecast 2019-2029
4.5.1 Point-to-point station-based Car Sharing Market Analysis 2019-2029
4.5.2 Learn What the Barriers Are for Station-Based Carsharing Growth
4.5.3 Learn what Drives the Demand for Station-Based Carsharing
4.5.4 Other Important Factors to Consider
5. Global Car Sharing Market by Application 2019-2029
5.1 Car Sharing Market Outlook by Application 2019-2029
5.2 Car Sharing Market by Application Market Share Forecast
5.3 Business Application Car Sharing Market Forecast 2019-2029
5.3.1 Business Car Sharing Market Analysis 2019-2029
5.4 Private Application Car Sharing Market Forecast 2019-2029
5.4.1 Private Car Sharing Market Analysis 2019-2029
6. Global Car Sharing Market by Business Model 2019-2029
6.1 Car Sharing Market Outlook by Business Model 2019-2029
6.2 Car Sharing Market by Business Model Market Share Forecast
6.3 Round Trip Car Sharing Market Forecast 2019-2029
6.3.1 Round Trip Car Sharing Market Analysis 2019-2029
6.4 One Way Car Sharing Market Forecast 2019-2029
6.4.1 One Way Car Sharing Market Analysis 2019-2029
7. The Leading Regional and National Car Sharing Markets 2019-2029
7.1 An Overview of the Leading Regional Car Sharing Markets 2019-2029
7.2 North America Car Sharing Market Forecast 2019-2029
7.2.1 North America Car Sharing Market Analysis 2019-2029
7.3 U.S. Car Sharing Market Forecast 2019-2029
7.3.1 U.S. Car Sharing Market Analysis 2019-2029
7.4 Canada Car Sharing Market Forecast 2019-2029
7.4.1 Canada Car Sharing Market Analysis 2019-2029
7.5 Mexico Car Sharing Market Forecast 2019-2029
7.5.1 Mexico Car Sharing Market Analysis 2019-2029
7.6 Europe Car Sharing Market Forecast 2019-2029
7.6.1 Europe Car Sharing Market Analysis 2019-2029
7.7 Germany Car Sharing Market Forecast 2019-2029
7.7.1 Germany Car Sharing Market Analysis 2019-2029
7.8 United Kingdom Car Sharing Market Forecast 2019-2029
7.8.1 United Kingdom Car Sharing Market Analysis 2019-2029
7.9 France Car Sharing Market Forecast 2019-2029
7.9.1 France Car Sharing Market Analysis 2019-2029
7.10 Italy Car Sharing Market Forecast 2019-2029
7.10.1 Italy Car Sharing Market Analysis 2019-2029
7.11 Switzerland Car Sharing Market Forecast 2019-2029
7.11.1 Switzerland Car Sharing Market Analysis 2019-2029
7.12 Austria Car Sharing Market Forecast 2019-2029
7.12.1 Austria Car Sharing Market Analysis 2019-2029
7.13 Netherlands Car Sharing Market Forecast 2019-2029
7.13.1 Netherlands Car Sharing Market Analysis 2019-2029
7.14 Sweden Car Sharing Market Forecast 2019-2029
7.14.1 Sweden Car Sharing Market Analysis 2019-2029
7.15 Spain Car Sharing Market Forecast 2019-2029
7.15.1 Spain Car Sharing Market Analysis 2019-2029
7.16 Belgium Car Sharing Market Forecast 2019-2029
7.16.1 Belgium Car Sharing Market Analysis 2019-2029
7.17 Rest Of Europe Car Sharing Market Forecast 2019-2029
7.17.1 Rest Of Europe Car Sharing Market Analysis 2019-2029
7.18 Asia Car Sharing Market Forecast 2019-2029
7.18.1 Asia Car Sharing Market Analysis 2019-2029
7.19 China Car Sharing Market Forecast 2019-2029
7.19.1 China Car Sharing Market Analysis 2019-2029
7.20 India Car Sharing Market Forecast 2019-2029
7.20.1 India Car Sharing Market Analysis 2019-2029
7.21 Japan Car Sharing Market Forecast 2019-2029
7.21.1 Japan Car Sharing Market Analysis 2019-2029
7.22 South Korea Car Sharing Market Forecast 2019-2029
7.22.1 South Korea Car Sharing Market Analysis 2019-2029
7.23 Rest of Asia Car Sharing Market Forecast 2019-2029
7.23.1 Rest of Asia Car Sharing Market Analysis 2019-2029
7.24 Latin America Car Sharing Market Forecast 2019-2029
7.24.1 Latin America Car Sharing Market Analysis 2019-2029
7.25 Brazil Car Sharing Market Forecast 2019-2029
7.25.1 Brazil Car Sharing Market Analysis 2019-2029
7.26 Rest of Latin America Car Sharing Market Forecast 2019-2029
7.26.1 Rest of Latin America Car Sharing Market Analysis 2019-2029
7.27 Oceania Car Sharing Market Forecast 2019-2029
7.27.1 Oceania Car Sharing Market Analysis 2019-2029
7.28 Australia Car Sharing Market Forecast 2019-2029
7.28.1 Australia Car Sharing Market Analysis 2019-2029
7.29 Rest of Oceania Car Sharing Market Forecast 2019-2029
7.29.1 Rest of Oceania Car Sharing Market Analysis 2019-2029
8. Leading Companies in the Car Sharing Market
8.1 DriveNow GmbH & Co. KG
8.1.1 DriveNow GmbH & Co. KG- Company Overview
8.1.2 DriveNow GmbH & Co. KG Market Products / Services
8.1.3 DriveNow GmbH & Co. KG Primary Market Competitors 2018
8.1.4 DriveNow GmbH & Co. KG Key Developments
8.1.5 DriveNow GmbH & Co. KG’s Role in the Car Sharing Market
8.2 ORIX Corporation
8.2.1 ORIX Corporation - Company Overview
8.2.2 ORIX Corporation Revenue Share by Region, By Business Segment 2018
8.2.3 ORIX Corporation Market Products / Services
8.2.4 ORIX Corporation Primary Market Competitors 2018
8.2.5 ORIX Corporation Key Developments
8.2.6 ORIX Corporation’s Role in the Car Sharing Market
8.3.Lyft, Inc.
8.3.1 Lyft, Inc. - Company Overview
8.3.2 Lyft, Inc. Market Products / Services
8.3.3 Lyft, Inc. Primary Market Competitors 2018
8.3.4 Lyft, Inc. Key Developments
8.3.5 Lyft, Inc.’s Role in the Car Sharing Market
8.4 Zipcar, Inc.
8.4.1 Zipcar, Inc. - Company Overview
8.4.2 Zipcar, Inc. Market Products / Services
8.4.3 Zipcar, Inc. Primary Market Competitors 2018
8.4.4 Zipcar, Inc. Key Developments
8.4.5 Zipcar, Inc.’s Role in the Car Sharing Market
8.5 Modo Co-operative
8.5.1 Modo Co-operative - Company Overview
8.5.2 Modo Co-operative Market Products / Services
8.5.3 Modo Co-operative Primary Market Competitors 2018
8.5.4 Modo Co-operative Key Developments
8.5.5 Modo Co-operative’s Role in the Car Sharing Market
8.6 Getaround, Inc.
8.6.1 Getaround, Inc. - Company Overview
8.6.2 Getaround, Inc. Market Products / Services
8.6.3 Getaround, Inc. Primary Market Competitors 2018
8.6.4 Getaround, Inc. Key Developments
8.6.5 Getaround, Inc.’s Role in the Car Sharing Market
8.7 The Hertz Corporation
8.7.1 The Hertz Corporation - Company Overview
8.7.2 The Hertz Corporation Revenue Share by Region, By Business Segment 2017
8.7.3 The Hertz Corporation Market Products / Services
8.7.4 The Hertz Corporation Primary Market Competitors 2018
8.7.5 The Hertz Corporation Key Developments
8.7.6 The Hertz Corporation’s Role in the Car Sharing Market
8.8 Cambio CarSharing
8.8.1 Cambio CarSharing - Company Overview
8.8.2 Cambio CarSharing Market Products / Services
8.8.3 Cambio CarSharing Primary Market Competitors 2018
8.8.4 Cambio CarSharing Key Developments
8.8.5 Cambio CarSharing’s Role in the Car Sharing Market
8.9 car2go NA, LLC
8.9.1 car2go NA, LLC - Company Overview
8.9.2 car2go NA, LLC Market Products / Services
8.9.3 car2go NA, LLC Primary Market Competitors 2018
8.9.4 car2go NA, LLC Key Developments
8.9.5 car2go NA, LLC’s Role in the Car Sharing Market
8.10 GoGet Carshare
8.10.1 GoGet Carshare - Company Overview
8.10.2 GoGet Carshare Market Products / Services
8.10.3 GoGet Carshare Primary Market Competitors 2018
8.10.4 GoGet Carshare Key Developments
8.10.5 GoGet Carshare’s Role in the Car Sharing Market
8.11 Uber Technologies, Inc.
8.11.1 Uber Technologies, Inc. - Company Overview
8.11.2 Uber Technologies, Inc. Market Products / Services
8.11.3 Uber Technologies, Inc. Primary Market Competitors 2018
8.11.4 Uber Technologies, Inc. Key Developments
8.11.5 Uber Technologies, Inc.’s Role in the Car Sharing Market
8.12 Cityhop
8.12.1 Cityhop - Company Overview
8.12.2 Cityhop Market Products / Services
8.12.3 Cityhop Primary Market Competitors 2018
8.12.4 Cityhop’s Role in the Car Sharing Market
9. Conclusion
9.1 Key Findings
10. Glossary
List of Tables
Table 3.1 Global Car Sharing Market Revenue Forecast 2019-2029 ($Mn, AGR %, CAGR %, Cumulative)
Table 3.2 Global Car Sharing Market Revenue Forecast by Region 2019-2029 ($Bn, AGR %, Cumulative)
Table 4.1: Global Car Sharing Market Revenue Forecast by Model 2019-2029 ($Bn, AGR %, Cumulative)
Table 4.2 Peer-to-peer Car Sharing Market Revenue Forecast 2019-2029 ($Bn, AGR %, CAGR %, Cumulative)
Table 4.3 Peer-to-peer Car Sharing Market Drivers and Restraints
Table 4.4 Point-to-point Car Sharing Market Revenue Forecast 2019-2029 ($Bn, AGR %, CAGR %, Cumulative)
Table 4.5 Point-to-point station-based Car Sharing Market Revenue Forecast 2019-2029 ($Bn, AGR %, CAGR %, Cumulative)
Table 5.1: Global Car Sharing Market Revenue Forecast by Application 2019-2029 ($Bn, AGR %, Cumulative)
Table 5.2 Business Car Sharing Market Revenue Forecast 2019-2029 ($Bn, AGR %, CAGR %, Cumulative)
Table 5.3 Private Car Sharing Market Revenue Forecast 2019-2029 ($Bn, AGR %, CAGR %, Cumulative)
Table 6.1: Global Car Sharing Market Revenue Forecast by Business Model 2019-2029 ($Bn, AGR %, Cumulative)
Table 6.2 Round Trip Car Sharing Market Revenue Forecast 2019-2029 ($Bn, AGR %, CAGR %, Cumulative)
Table 6.3 Round Trip Car Sharing Market Drivers and Restraints
Table 6.4 One Way Car Sharing Market Revenue Forecast 2019-2029 ($Bn, AGR %, CAGR %, Cumulative)
Table 7.1 North America Car Sharing Market Revenue Forecast 2019-2029 ($Bn, AGR %, CAGR %, Cumulative)
Table 7.2 U.S. Car Sharing Market Revenue Forecast 2019-2029 ($Mn, AGR %, CAGR %, Cumulative)
Table 7.3 Round Trip Car Sharing Market Drivers and Restraints
Table 7.4 Canada Car Sharing Market Revenue Forecast 2019-2029 ($Mn, AGR %, CAGR %, Cumulative)
Table 7.5 Canada Car Sharing Market Drivers and Restraints
Table 7.6 Mexico Car Sharing Market Revenue Forecast 2019-2029 ($Mn, AGR %, CAGR %, Cumulative)
Table 7.7 Mexico Car Sharing Market Drivers and Restraints
Table 7.8 Europe Car Sharing Market Revenue Forecast 2019-2029 ($Bn, AGR %, CAGR %, Cumulative)
Table 7.9 Germany Car Sharing Market Revenue Forecast 2019-2029 ($Mn, AGR %, CAGR %, Cumulative
Table 7.10 Germany Car Sharing Market Drivers and Restraints
Table 7.11 United Kingdom Car Sharing Market Revenue Forecast 2019-2029 ($Mn, AGR %, CAGR %, Cumulative)
Table 7.12 United Kingdom Car Sharing Market Drivers and Restraints
Table 7.13 France Car Sharing Market Revenue Forecast 2019-2029 ($Mn, AGR %, CAGR %, Cumulative)
Table 7.14 France Car Sharing Market Drivers and Restraints
Table 7.15 Italy Car Sharing Market Revenue Forecast 2019-2029 ($Mn, AGR %, CAGR %, Cumulative)
Table 7.16 Italy Car Sharing Market Drivers and Restraints
Table 7.17 Switzerland Car Sharing Market Revenue Forecast 2019-2029 ($Mn, AGR %, CAGR %, Cumulative)
Table 7.18 Switzerland Car Sharing Market Drivers and Restraints
Table 7.19 Austria Car Sharing Market Revenue Forecast 2019-2029 ($Mn, AGR %, CAGR %, Cumulative)
Table 7.20 Austria Car Sharing Market Drivers and Restraints
Table 7.21 Netherlands Car Sharing Market Revenue Forecast 2019-2029 ($Mn, AGR %, CAGR %, Cumulative)
Table 7.22 Sweden Car Sharing Market Revenue Forecast 2019-2029 ($Mn, AGR %, CAGR %, Cumulative)
Table 7.23 Sweden Car Sharing Market Drivers and Restraints
Table 7.24 Spain Car Sharing Market Revenue Forecast 2019-2029 ($Mn, AGR %, CAGR %, Cumulative)
Table 7.25 Spain Car Sharing Market Drivers and Restraints
Table 7.26 Belgium Car Sharing Market Revenue Forecast 2019-2029 ($Mn, AGR %, CAGR %, Cumulative)
Table 7.27 Belgium Car Sharing Market Drivers and Restraints
Table 7.28 Rest Of Europe Car Sharing Market Revenue Forecast 2019-2029 ($Mn, AGR %, CAGR %, Cumulative)
Table 7.29 Rest Of Europe Car Sharing Market Drivers and Restraints
Table 7.30 Asia Car Sharing Market Revenue Forecast 2019-2029 ($bn, AGR %, CAGR %, Cumulative)
Table 7.31 China Car Sharing Market Revenue Forecast 2019-2029 ($Mn, AGR %, CAGR %, Cumulative)
Table 7.32 China Car Sharing Market Drivers and Restraints
Table 7.33 India Car Sharing Market Revenue Forecast 2019-2029 ($Mn, AGR %, CAGR %, Cumulative)
Table 7.34 India Car Sharing Market Drivers and Restraints
Table 7.35 Japan Car Sharing Market Revenue Forecast 2019-2029 ($Mn, AGR %, CAGR %, Cumulative)
Table 7.36 Japan Car Sharing Market Drivers and Restraints
Table 7.37 South Korea Car Sharing Market Revenue Forecast 2019-2029 ($Mn, AGR %, CAGR %, Cumulative)
Table 7.38 South Korea Car Sharing Market Drivers and Restraints
Table 7.39 Rest of Asia Car Sharing Market Revenue Forecast 2019-2029 ($Mn, AGR %, CAGR %, Cumulative)
Table 7.40 Latin America Car Sharing Market Revenue Forecast 2019-2029 ($Mn, AGR %, CAGR %, Cumulative)
Table 7.41 Brazil Car Sharing Market Revenue Forecast 2019-2029 ($Mn, AGR %, CAGR %, Cumulative
Table 7.42 Brazil Car Sharing Market Drivers and Restraints
Table 7.43 Rest of Latin America Car Sharing Market Revenue Forecast 2019-2029 ($Mn, AGR %, CAGR %, Cumulative)
Table 7.44 Oceania Car Sharing Market Revenue Forecast 2019-2029 ($bn, AGR %, CAGR %, Cumulative)
Table 7.45 Australia Car Sharing Market Revenue Forecast 2019-2029 ($Mn, AGR %, CAGR %, Cumulative)
Table 7.46 Rest of Oceania Car Sharing Market Revenue Forecast 2019-2029 ($Mn, AGR %, CAGR %, Cumulative)
Table 8.1: DriveNow GmbH & Co. KG Profile 2018 (CEO, Strongest Business Region, Business Segment in the Market, Submarket Involvement, HQ, Founded, No. of Employees, Website)
Table 8.2: DriveNow GmbH & Co. KG. Car Sharing Market Products / Services (Product Segment, Product)
Table 8.3: DriveNow GmbH & Co. KG. Car Sharing Market Key Developments
Table 8.4: ORIX Corporation Profile 2018 (CEO, Total Company Sales US$m, Sales in the Market US$m, Strongest Business Region, Business Segment in the Market, Submarket Involvement, HQ, Founded, No. of Employees, Website)
Table 8.5: ORIX Corporation Income Statement Summary 2017-2018 (all in $Mn)
Table 8.6: ORIX Corporation Car Sharing Market Products / Services (Product Segment, Product) Table 8.7: ORIX Corporation. Car Sharing Market Key Developments
Table 8.8: Lyft, Inc. Profile 2016 (CEO, Total Company Sales US$m, Sales in the Market US$m, %, Strongest Business Region, Business Segment in the Market, Submarket Involvement, HQ, Founded, No. of Employees, Website)
Table 8.9: Lyft, Inc. Car Sharing Market Products / Services (Product Segment, Product)
Table 8.10: Lyft, Inc. Car Sharing Market Key Developments
Table 8.11: Zipcar, Inc. Profile 2018 (CEO , Strongest Business Region, Business Segment in the Market, Submarket Involvement, HQ, Founded, No. of Employees, Website)
Table 8.12: Zipcar, Inc.. Car Sharing Market Products / Services (Product Segment, Product)
Table 8.13: Zipcar, Inc. Car Sharing Market Key Developments
Table 8.14: Modo Co-operative Profile 2018 (CEO, Strongest Business Region, Business Segment in the Market, Submarket Involvement, HQ, Founded, No. of Employees, Website)
Table 8.15: Modo Co-operative. Car Sharing Market Products / Services (Product Segment, Product)
Table 8.16: Modo Co-operative. Car Sharing Market Key Developments
Table 8.17: Getaround, Inc. Profile 2018 (CEO, Strongest Business Region, Business Segment in the Market, Submarket Involvement, HQ, Founded, No. of Employees, Website)
Table 8.18: Getaround, Inc.. Car Sharing Market Products / Services (Product Segment, Product)
Table 8.19: Getaround, Inc. Car Sharing Market Key Developments
Table 8.20: The Hertz Corporation Profile 2018 (CEO, Total Company Sales US$m, Sales in the Market US$m, Strongest Business Region, Business Segment in the Market, Submarket Involvement, HQ, Founded, No. of Employees, Website)
Table 8.22: The Hertz Corporation. Car Sharing Market Products / Services (Product Segment, Product)
Table 8.23: The Hertz Corporation. Car Sharing Market Key Developments
Table 8.24: Cambio CarSharing Profile 2018 (CEO, Strongest Business Region, Business Segment in the Market, Submarket Involvement, HQ, Founded, No. of Employees, Website)
Table 8.25: Cambio CarSharing. Car Sharing Market Products / Services (Product Segment, Product)
Table 8.26: Cambio CarSharing. Car Sharing Market Key Developments
Table 8.27: car2go NA, LLC Profile 2018 (CEO, Strongest Business Region, Business Segment in the Market, Submarket Involvement, HQ, Founded, No. of Employees, Website)
Table 8.28: car2go NA, LLC. Car Sharing Market Products / Services (Product Segment, Product)
Table 8.29: car2go NA, LLC. Car Sharing Market Key Developments
Table 8.30: GoGet Carshare Profile 2018 (CEO, Strongest Business Region, Business Segment in the Market, Submarket Involvement, HQ, Founded, No. of Employees, Website)
Table 8.31: GoGet Carshare. Car Sharing Market Products / Services (Product Segment, Product)
Table 8.32: GoGet Carshare. Car Sharing Market Key Developments
Table 8.33: Uber Technologies, Inc. Profile 2016 (CEO, Strongest Business Region, Business Segment in the Market, Submarket Involvement, HQ, Founded, No. of Employees, Website)
Table 8.34: Uber Technologies, Inc.. Car Sharing Market Products / Services (Product Segment, Product)
Table 8.35: Uber Technologies, Inc. Car Sharing Market Key Developments
Table 8.36: Cityhop Profile 2018 (CEO, Strongest Business Region, Business Segment in the Market, Submarket Involvement, HQ, Founded, No. of Employees, Website)
Table 8.37: Cityhop. Car Sharing Market Products / Services (Product Segment, Product)
List of Figures
Figure 1.1: Car Sharing Market Segmentation
Figure 3.1: Global Car Sharing Market Revenue Forecast 2019-2029 ($Mn)
Figure 3.2 Car Sharing Market by Region Revenue Market Share Forecast 2019, 2024 and 2029 (% Share)
Figure 4.1 Car Sharing Market by Model Type Revenue Market Share Forecast 2019, 2024 and 2029 (% Share)
Figure 4.2 :Peer-to-peer Car Sharing Revenue Market Forecast 2019-2029 (USD Billion, AGR%)
Figure 4.3 :Point-to-point Car Sharing Revenue Market Forecast 2019-2029 (USD Billion, AGR%)
Figure 4.4 :Point-to-point station-based Car Sharing Revenue Market Forecast 2019-2029 (USD Billion, AGR%)
Figure 5.1 Car Sharing Market by Application Revenue Market Share Forecast 2019, 2024 and 2029 (% Share)
Figure 5.2 :Business Car Sharing Revenue Market Forecast 2019-2029 (USD Billion, AGR%)
Figure 5.3 Private Car Sharing Revenue Market Forecast 2019-2029 (USD Billion, AGR%)
Figure 6.1 Car Sharing Market by Business Model Revenue Market Share Forecast 2019, 2024 and 2029 (% Share)
Figure 6.2 Round Trip Car Sharing Revenue Market Forecast 2019-2029 (USD Billion, AGR%)
Figure 6.3 One Way Car Sharing Revenue Market Forecast 2019-2029 (USD Billion, AGR%)
Figure 7.1 An Overview of the Leading Regional Car Sharing Markets Revenue (USD Billion) 2019, 2024 and 2029
Figure 7.2 North America Car Sharing Revenue Market Forecast 2019-2029 (USD Billion, AGR%)
Figure 7.3 North America Car Sharing Market by Countries, Revenue Market Share Forecast 2019, 2024 and 2029 (% Share)
Figure 7.4: North America Car Sharing Revenue Market Share (%) By Country Forecast 2019-2029
Figure 7.5: U.S. Car Sharing Revenue Market Forecast 2019-2029 (USD Million, AGR%)
Figure 7.6: Canada Car Sharing Revenue Market Forecast 2019-2029 (USD Million, AGR%)
Figure 7.7: Mexico Car Sharing Revenue Market Forecast 2019-2029 (USD Billion, AGR%)
Figure 7.8 Europe Car Sharing Revenue Market Forecast 2019-2029 (USD Billion, AGR%)
Figure 7.9 Europe Car Sharing Market by Countries Revenue Market Share Forecast 2019, 2024 and 2029 (% Share)
Figure 7.10: Europe Car Sharing Revenue Market Share (%) By Country Forecast 2019-2029
Figure 7.11: Germany Car Sharing Revenue Market Forecast 2019-2029 (USD Million, AGR%)
Figure 7.12: United Kingdom Car Sharing Revenue Market Forecast 2019-2029 (USD Million, AGR%)
Figure 7.13: France Car Sharing Revenue Market Forecast 2019-2029 (USD Million, AGR%)
Figure 7.14: Italy Car Sharing Revenue Market Forecast 2019-2029 (USD Million, AGR%)
Figure 7.15: Switzerland Car Sharing Revenue Market Forecast 2019-2029 (USD Million, AGR%)
Figure 7.16: Austria Car Sharing Revenue Market Forecast 2019-2029 (USD Million, AGR%)
Figure 7.17: Netherlands Car Sharing Revenue Market Forecast 2019-2029 (USD Million, AGR%)
Figure 7.18: Sweden Car Sharing Revenue Market Forecast 2019-2029 (USD Million, AGR%)
Figure 7.19: Spain Car Sharing Revenue Market Forecast 2019-2029 (USD Million, AGR%)
Figure 7.20: Belgium Car Sharing Revenue Market Forecast 2019-2029 (USD Million, AGR%)
Figure 7.21: Rest Of Europe Car Sharing Revenue Market Forecast 2019-2029 (USD Million, AGR%)
Figure 7.22: Asia Car Sharing Revenue Market Forecast 2019-2029 (USD Billion, AGR%)
Figure 7.23 Asia Car Sharing Market by Countries Revenue Market Share Forecast 2019, 2024 and 2029 (% Share)
Figure 7.24: Asia Car Sharing Revenue Market Share (%) By Country Forecast 2019-2029
Figure 7.25: China Car Sharing Revenue Market Forecast 2019-2029 (USD Million, AGR%)
Figure 7.26: India Car Sharing Revenue Market Forecast 2019-2029 (USD Million, AGR%)
Figure 7.27: Japan Car Sharing Revenue Market Forecast 2019-2029 (USD Million, AGR%)
Figure 7.28: South Korea Car Sharing Revenue Market Forecast 2019-2029 (USD Million, AGR%)
Figure 7.29: Rest of Asia Car Sharing Revenue Market Forecast 2019-2029 (USD Million, AGR%)
Figure 7.30: Latin America Car Sharing Revenue Market Forecast 2019-2029 (USD Million, AGR%)
Figure 7.31 Car Sharing Revenue Market Share Forecast 2019, 2024 and 2029 (% Share)
Figure 7.32: Latin America Car Sharing Revenue Market Share (%) By Country Forecast 2019-2029
Figure 7.33: Brazil Car Sharing Revenue Market Forecast 2019-2029 (USD Million, AGR%)
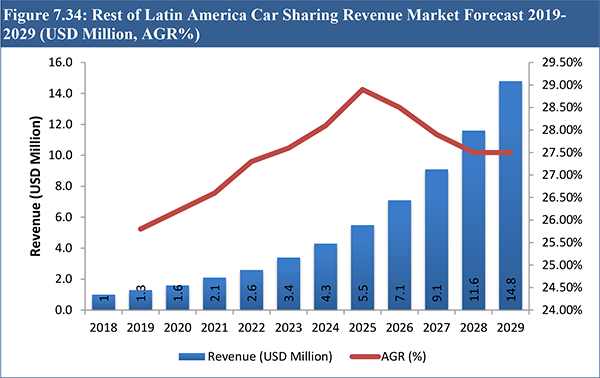
Figure 7.34: Rest of Latin America Car Sharing Revenue Market Forecast 2019-2029 (USD Million, AGR%)
Figure 7.35: Oceania Car Sharing Revenue Market Forecast 2019-2029 (USD Billion, AGR%)
Figure 7.36 Car Sharing Revenue Market Share Forecast 2019, 2024 and 2029 (% Share)
Figure 7.37: Australia Car Sharing Revenue Market Forecast 2019-2029 (USD Million, AGR%)
Figure 7.38: Rest of Oceania Car Sharing Revenue Market Forecast 2019-2029 (USD Million, AGR%)
Figure 8.1: DriveNow GmbH & Co. KG. Primary Market Competitors 2018
Figure 8.2: ORIX Corporation. Car Sharing Market Revenue Share by Region, By Business Segment (2018)
Figure 8.3: ORIX Corporation. Primary Market Competitors 2018
Figure 8.4: Lyft, Inc. Primary Market Competitors 2018
Figure 8.5: Zipcar, Inc.. Primary Market Competitors 2018
Figure 8.6: Modo Co-operative. Primary Market Competitors 2018
Figure 8.7: Getaround, Inc. Primary Market Competitors 2018
Figure 8.8: The Hertz Corporation. Car Sharing Market Revenue Share by Region, By Business Segment (2017)
Figure 8.9: The Hertz Corporation. Primary Market Competitors 2018
Figure 8.10: Cambio CarSharing. Primary Market Competitors 2018
Figure 8.11: car2go NA, LLC. Primary Market Competitors 2018
Figure 8.12: GoGet Carshare. Primary Market Competitors 2018
Figure 8.13: Uber Technologies, Inc.. Primary Market Competitors 2018
Figure 8.14: Cityhop. Primary Market Competitors 2018
Avis Budget Group, Inc.
Blue Vision Labs,
Bluely
BMW AG
Budget
Cambio CarSharing
Car Next Door
car2go
car2go Europe GmbH
car2go North America LLC
CarSharing Service GmbH (CSS)
Chailease Auto Rental Co., Ltd.
Citroen
Cityhop
Curb
Daimler AG
Sixt SE
Daimler
Daimler North America Corporation
Dollar
Drive My Car
DriveNow GmbH & Co. KG
Drivy
Enterprise holdings
Events DC
Flexicar
FlightCar
Ford
Gensler
Getaround, Inc..
GLM Co., Ltd.
GoGet Carshare
Grab
GreenShareCar
Greenwheels
Hitch Car Rentals
Hyundai
InDriver
Jetblue
LeasePlan
Localiza
Lyft, Inc.
Microsoft
Mitsubishi
Modo Co-operative
Netflix
Nissan
Ola
ORIX Auto Corporation
ORIX Corporation.
Partago
Popcar
Silvercar
Sky Team
Tesla
The Hertz Corporation
Thrifty
Toyota Motor Corporation
Turo
Uber Technologies, Inc..
Volecars
Voler car pvt. limited
VW
Yescapa
Yourdrive
Z Energy
Zipcar
Zoomcar
Organisations mentioned
Coastal Community Credit Union (CCCU)
European Automobile Manufacturers Associations (ACEA)
Northern Arizona University (NAU)
Download sample pages
Complete the form below to download your free sample pages for Car Sharing Market Report 2019-2029
Related reports
-

Battery Electric Vehicle (BEV) Market Report 2019-2029
The increasing need to reduce vehicular emissions, decreasing battery prices, and the introduction of stringent regulations by government bodies, has...Full DetailsPublished: 20 November 2018 -

Electric Vehicle Supply Equipment (EVSE) Market Report 2019-2029
Read on to discover how this definitive report can transform your own research and save you time.
...Full DetailsPublished: 31 December 2018 -

Top 20 Connected Car Companies 2019
Visiongain calculates that the connected car market will reach $42.99bn in 2019. ...Full DetailsPublished: 20 November 2018 -

Connected Car Market Report 2019-2029
The latest report from business intelligence provider Visiongain offers comprehensive analysis of the global connected car market. Visiongain assesses that...
Full DetailsPublished: 03 December 2018 -

Automotive Usage-Based Insurance (UBI) Market Report 2018-2028
The rising share of digital distribution of automotive insurance sales and arrival of connected cars, has led Visiongain to publish...
Full DetailsPublished: 11 May 2018 -

Autonomous Vehicle (AV) Market Analysis Report 2017-2027
This report presents the realistic outlook for autonomous vehicles (AV) and provides the expected timelines for the implementation of 3...
Full DetailsPublished: 19 May 2017 -

Commercial Vehicle Telematics Market Report 2018-2028
The latest report from business intelligence provider company name offers comprehensive analysis of the global Commercial Vehicle Telematics market. Visiongain...
Full DetailsPublished: 28 June 2018 -

Hybrid Powertrain Systems Market Report 2019-2029
The latest report from business intelligence provider Visiongain offers a comprehensive analysis of the global Hybrid powertrain systems market. Visiongain...
Full DetailsPublished: 31 July 2019 -

Top 20 Companies Developing Autonomous Vehicles (AV) Technologies 2018
This report independently evaluates the top 20 players developing autonomous vehicles technologies providing the reader with an objective overview of...Full DetailsPublished: 16 October 2018 -

E-hailing Market Outlook Report 2019-2029
Visiongain evaluates the E-hailing market at $15.12bn in 2019.
...Full DetailsPublished: 07 March 2019
Download sample pages
Complete the form below to download your free sample pages for Car Sharing Market Report 2019-2029
Do you have any custom requirements we can help you with?
Any specific country, geo region, market segment or specific company information?
Email us today, we can discuss your needs and see how we can help: jamie.roberts@visiongain.com
Would you like a free report overview of the report of your choice?
If so, please drop an email to Jamie Roberts stating your chosen report title to jamie.roberts@visiongain.com
Visiongain automotive reports are compiled using a broad and rich mixture of both primary and secondary information to produce an overall industry outlook. In order to provide our clients with the best product possible product, we do not rely on any one single source of information. Visiongain analysts reach out to market-leading vendors and automotive industry experts but also review a wealth of financial data and product information from a vast range of sources. To find out more about our reports methodology please email jamie.roberts@visiongain.com
Would you like to get the latest Visiongain automotive reports catalogue?
What are the dynamic growth sectors? where are the regional business opportunities?
Which technologies will prevail and who are the leading companies succeeding in these sectors and why?
If you want definitive answers to business critical questions, discover Visiongain’s full range of business intelligence reports.
If so, please email Jamie Roberts on jamie.roberts@visiongain.com or call her today on +44 207 336 6100
Alliance of Automobile Manufacturers (USA)
Association of Russian Automakers
Audio Video Bridging (AVB)
China Association Of Automoblie Manufacturers
European Association of Automotive Suppliers
European Automobile Manufacturers’ Association
European Council for Automotive Research and Development
Former Society of Automotive Engineers
German Association of the Automotive Industry
International Organization of Motor Vehicle Manufacturers
In-Vehicle Infotainment (IVI)
Italian Association of the Automotive Industry
Japan Automobile Manufacturers Association
One-Pair Ether-Net
Society of Indian Automobile Manufacturers (SIAM)
Society of Motor Manufacturers and Traders
The International Council For Clean Transport
US National Highway Traffic Safety Administration
Don’t Miss Out!
Subscribe to receive the latest Industry news, trending insight and analysis straight to your inbox.Choose your preferences:
Latest Automotive news
Hydrogen Vehicle Market
The global Hydrogen Vehicle market was valued at US$23.34 billion in 2023 and is projected to grow at a CAGR of 22.7% during the forecast period 2024-2034.
17 May 2024
Autonomous Vehicle Market
The global Autonomous Vehicle market was valued at US$35.4 billion in 2023 and is projected to grow at a CAGR of 22.7% during the forecast period 2024-2034.
16 May 2024
Automotive Infotainment Market
The global Automotive Infotainment market is estimated at US$20.2 billion in 2023 and is projected to grow at a CAGR of 6.3% during the forecast period 2024-2034.
14 May 2024
Automotive Cyber Security Market
The global Automotive Cyber Security market was valued at US$2,991.6 million in 2024 and is projected to grow at a CAGR of 19.4% during the forecast period 2024-2034.
13 May 2024


