Visiongain’s comprehensive new 215 page report reveals that the automotive aftermarket parts market will achieve revenues of $388.8bn in 2017.
Rising vehicle sales combined with increasing average vehicle age is primarily driving the market for the global automotive aftermarket parts market. Moreover, increase in the number of authorized repair shops and independent repair / maintenance service stations will lead to increase in the demand for aftermarket components in the near future.
Are you involved in the Automotive Aftermarket Parts market or intend to be? If so, then you must read this report
It’s vital that you keep your knowledge up to date. You need this report.
The Automotive Aftermarket Parts Market Report 2017-2027 report responds to your need for definitive market data:
Global Automotive Aftermarket Parts Forecast 2017-2027
Automotive Aftermarket Parts By Component Forecast 2017-2027
• Tires Forecast 2017-2027
• Battery Forecast 2017-2027
• Filters Forecast 2017-2027
• Braking Products Forecast 2017-2027
• Lighting Products Forecast 2017-2027
• Spark Plugs Forecast 2017-2027
• Collision Body Parts Forecast 2017-2027
• Starters & Alternators Forecast 2017-2027
• Exhausts Components Forecast 2017-2027
• Wheels Forecast 2017-2027
• Others Forecast 2017-2027
Automotive Aftermarket Parts By Vehicle Type Forecast 2017-2027
• Passenger Cars Aftermarket Parts Forecast 2017-2027
• Commercial Vehicle Aftermarket Parts Forecast 2017-2027
What are the prospects in the leading regions and countries?
Americas Automotive Aftermarket Parts Forecast 2017-2027
• US Automotive Aftermarket Parts Forecast 2017-2027
• Canada Automotive Aftermarket Parts Forecast 2017-2027
• Mexico Automotive Aftermarket Parts Forecast 2017-2027
• Brazil Automotive Aftermarket Parts Forecast 2017-2027
• Rest of North & South America Automotive Aftermarket Parts Forecast 2017-2027
Europe Automotive Aftermarket Parts Forecast 2017-2027
• Germany Automotive Aftermarket Parts Forecast 2017-2027
• UK Automotive Aftermarket Parts Forecast 2017-2027
• Spain Automotive Aftermarket Parts Forecast 2017-2027
• Italy Automotive Aftermarket Parts Forecast 2017-2027
• Russia Automotive Aftermarket Parts Forecast 2017-2027
• Rest of Europe Automotive Aftermarket Parts Forecast 2017-2027
Asia-Oceania Automotive Aftermarket Parts Forecast 2017-2027
• China Automotive Aftermarket Parts Forecast 2017-2027
• India Automotive Aftermarket Parts Forecast 2017-2027
• Japan Automotive Aftermarket Parts Forecast 2017-2027
• South Korea Automotive Aftermarket Parts Forecast 2017-2027
• Rest of Asia-Oceania Automotive Aftermarket Parts Forecast 2017-2027
Rest of the World Automotive Aftermarket Parts Forecast 2017-2027
Profiles of the leading Automotive Aftermarket Parts Companies
• Continental AG
• Denso Corporation
• ZF Friedrichshafen AG
• Magna International
• Aisin Seiki Co., Ltd.
• Valeo Group
• Delphi Automotive PLC
• Schaeffler AG
• MAHLE GmbH
• Tenneco Inc.
Who should read this report: Directors of
• Automotive component manufacturers
• Automotive consultants
• Vehicle manufacturers
• Automotive component distributors
• Automotive component retailers
• E-commerce marketers
• Automotive industry analyst
• Automotive Industry Consultants
Get our report today Automotive Aftermarket Parts Market Report 2017-2027. Avoid missing out – order our report now.
Visiongain is a trading partner with the US Federal Government
CCR Ref number: KD4R6
1. Report Overview
1.1 Automotive Aftermarket Parts Market Definition and Research Scope
1.2 Why You Should Read This Report
1.3 How This Report Delivers
1.4 Key Questions Answered by This Analytical Report Include:
1.5 Who is This Report For?
1.6 Methodology
1.7 Frequently Asked Questions (FAQ)
1.8 Associated Visiongain Reports
1.9 About Visiongain
2. Introduction to Automotive Aftermarket Parts
2.1 Factors Driving Demand for Global Automotive Aftermarket Parts Market
2.1.1 Three Action Viz. Service Events, High Presence Of Service & Parts Providers And Customers Segments Are Driving The Growth Of The Global Automotive Aftermarket Parts Market
2.1.2 Steady Growth of Global Vehicle Production and Sales Anticipated to Supplement Growth of Automotive Aftermarket Market
2.1.3 Healthy Growth Of Economy Particularly In Developing Economy And Increase In Average Disposable Income
2.1.4 Increase In The Used-Car Market Giving Rise To Growth In Average Vehicle Age Which Is Further Expected To Increase The Demand For Aftermarket Components
2.1.5 Increasing Trend On Vehicle Customization Particularly With Respect To Vehicle Aesthetics Is Anticipated To Drive The Demand For Automotive Aftermarket Parts
2.2 Growth Challenges / Restraints Faced by Global Automotive Aftermarket Parts Market
2.2.1 Lacking Know-How And Investment Barriers Are Some Of Major Challenges Identified For Small Repair Shops
2.2.2. Investments In Product Quality Improvement From Major Oems Is Slowing Down The Revenue Growth Rate In The Global Aftermarket Parts Market
2.3 Global Automotive Aftermarket Parts Market Existing Trends
2.3.1 Utilization Of Remotely Diagnostic Equipment And Other Revenue Generating Services At OEM Or Authorized Repair Shops
2.3.2 Changing Consumer Buying Preferences
2.4 Global Automotive Aftermarket Parts Market Opportunities
2.4.1 Growth In Demand For Remanufactured Parts Creates Significant Revenue Opportunities For Players In The Automotive Aftermarket
3. Global Automotive Aftermarket Parts Market, 2017–2027
3.1 Global Automotive Aftermarket Parts Market Forecast 2017–2027
3.2 Global Automotive Aftermarket Parts Market Forecast 2017–2027
4. Global Automotive Aftermarket Parts Market by Geography 2017–2027
4.1 Global Automotive Aftermarket Submarket Forecast by Geography, 2017–2027
4.2 Global Automotive Aftermarket Parts Forecast by Geography, 2017–2027
4.2.1 Asia Oceania Automotive Aftermarket Parts Market Forecast 2017-2027
4.2.2 Europe Automotive Aftermarket Parts Market Forecast 2017-2027
4.2.3 Americas Automotive Aftermarket Parts Market Forecast 2017-2027
4.2.4 Rest of World Automotive Aftermarket Parts Market Forecast 2017-2027
5. Global Automotive Aftermarket Parts Market by Component 2017–2027
5.1 Global Automotive Aftermarket Parts Submarket Forecast by Component, 2017–2027
5.2 Global Automotive Aftermarket Parts Submarket Forecast by Tire, 2017–2027
5.2.1 Global Automotive Aftermarket Parts Market Forecast by Tire, 2017-2027
5.3 Global Automotive Aftermarket Parts Submarket Forecast by Battery, 2017–2027
5.3.1 Global Automotive Aftermarket Parts Market Forecast by Battery, 2017–2027
5.4 Global Automotive Aftermarket Parts Submarket Forecast by Filters, 2017–2027
5.4.1 Global Automotive Aftermarket Filters Market Forecast 2017-2027
5.5 Global Automotive Aftermarket Parts Submarket Forecast by Braking Products, 2017–2027
5.5.1 Global Automotive Aftermarket Braking Products Market Forecast 2017-2027
5.6 Global Automotive Aftermarket Parts Submarket Forecast by Lighting Parts, 2017–2027
5.6.1 Global Automotive Aftermarket Lighting Parts Market Forecast 2017-2027
5.7 Global Automotive Aftermarket Parts Submarket Forecast by Spark Plugs, 2017–2027
5.7.1 Global Automotive Aftermarket Spark Plugs Market Forecast 2017-2027
5.8 Global Automotive Aftermarket Parts Submarket Forecast by Collision Body, 2017–2027
5.8.1 Global Automotive Aftermarket Collision Body Market Forecast 2017-2027
5.9 Global Automotive Aftermarket Parts Submarket Forecast by Starters & Alternators, 2017–2027
5.9.1 Global Automotive Aftermarket Starters & Alternators Market Forecast 2017-2027
5.10 Global Automotive Aftermarket Parts Submarket Forecast by Exhaust Components, 2017–2027
5.10.1 Global Automotive Aftermarket Exhaust Components Market Forecast 2017-2027
5.11 Global Automotive Aftermarket Parts Submarket Forecast by Wheels, 2017–2027
5.11.1 Global Automotive Aftermarket Wheels Market Forecast 2017-2027
5.12 Global Automotive Aftermarket Parts Submarket Forecast by Others, 2017–2027
5.12.1 Global Automotive Aftermarket Parts Others Market Forecast 2017-2027
6. Global Automotive Aftermarket Parts Submarket Forecast by Vehicle Type, 2017–2027
6.1 Global Automotive Aftermarket Parts Submarket Forecast by Vehicle Type, 2017–2027
6.2 Global Automotive Aftermarket Submarket Forecast by Vehicle Type, 2017–2027
6.2.1 Passenger Cars Automotive Aftermarket Parts Market Forecast 2017-2027
6.2.2 Commercial Vehicle Automotive Aftermarket Parts Market Forecast 2017-2027
7. Americas Automotive Aftermarket Parts Market 2017–2027
7.1 Americas Automotive Aftermarket Market Forecast Overview 2017–2027
7.2 Americas Automotive Aftermarket Market Forecast by Country, 2017–2027
7.2.1 U.S. Automotive Aftermarket Parts Market Forecast 2017-2027
7.2.2 Canada Automotive Aftermarket Parts Market Forecast 2017-2027
7.2.3 Mexico Automotive Aftermarket Parts Market Forecast 2017-2027
7.3 Americas Automotive Aftermarket Parts Market by Component 2017–2027
7.4 Americas Automotive Aftermarket Parts Market by Vehicle Type 2017–2027
8. Asia Oceania Automotive Aftermarket Parts Market 2017–2027
8.1 Asia Oceania Automotive Aftermarket Market Forecast by Country, 2017–2027
8.2 Asia Oceania Automotive Aftermarket Market Forecast by Country, 2017–2027
8.2.1 China Automotive Aftermarket Parts Market Forecast 2017-2027
8.2.2 India Automotive Aftermarket Parts Market Forecast 2017-2027
8.2.3 Japan Automotive Aftermarket Parts Market Forecast 2017-2027
8.2.4 South Korea Automotive Aftermarket Parts Market Forecast 2017-2027
8.2.5 Rest of Asia Oceania Automotive Aftermarket Parts Market Forecast 2017-2027
8.3 Asia Oceania Automotive Aftermarket Parts Market by Component 2017–2027
8.4 Asia Oceania Automotive Aftermarket Parts Market by Vehicle Type 2017–2027
9. Europe Automotive Aftermarket Parts Market 2017–2027
9.1 Europe Automotive Aftermarket Market Forecast by Country, 2017–2027
9.1.1 Germany Automotive Aftermarket Parts Market Forecast 2017-2027
9.1.2 Spain Automotive Aftermarket Parts Market Forecast 2017-2027
9.1.3 U.K. Automotive Aftermarket Parts Market Forecast 2017-2027
9.1.4 Italy Automotive Aftermarket Parts Market Forecast 2017-2027
9.1.5 Russia Automotive Aftermarket Parts Market Forecast 2017-2027
9.1.6 Rest of Europe Automotive Aftermarket Parts Market Forecast 2017-2027
9.2 Europe Automotive Aftermarket Parts Market by Component 2016–2027
9.3 Europe Automotive Aftermarket Parts Market by Vehicle Type 2017–2027
10. Rest of World Automotive Aftermarket Parts Market 2017–2027
10.1 Rest of World Automotive Aftermarket Parts Market by Component 2017–2027
10.2 Rest of World Automotive Aftermarket Parts Market by Vehicle Type 2017–2027
11. Leading 10 Automotive Aftermarket Parts Market Companies
11.1 Continental AG
11.1.1 Continental AG - Company Overview
11.1.2 Continental AG Revenue Share by Region, By Business Segment 2016
11.1.3 Continental AG Automotive Aftermarket Parts Market Products / Services
11.1.4 Continental AG Primary Market Competitors 2016
11.1.5 Continental AG Key Developments
11.2 Denso Corporation
11.2.1 Denso Corporation - Company Overview
11.2.2 Denso Corporation Revenue Share by Region, By Business Segment 2016
11.2.3 Denso Corporation Automotive Aftermarket Parts Market Products / Services
11.2.4 Denso Corporation Primary Market Competitors 2016
11.2.5 Denso Corporation Key Developments
11.3 ZF Friedrichshafen AG
11.3.1 ZF Friedrichshafen AG - Company Overview
11.3.2 ZF Friedrichshafen AG Revenue Share by Region, By Business Segment 2016
11.3.3 ZF Friedrichshafen AG Automotive Aftermarket Parts Market Products / Services
11.3.4 ZF Friedrichshafen AG Primary Market Competitors 2016
11.3.5 ZF Friedrichshafen AG Key Developments
11.4 Magna International
11.4.1 Magna International - Company Overview
11.4.2 Magna International Revenue Share By Region, By Business Segment 2016
11.4.3 Magna International Automotive Aftermarket Parts Market Products / Services
11.4.4 Magna International Primary Market Competitors 2016
11.4.5 Magna International Key Developments
11.5 Aisin Seiki Co., Ltd.
11.5.1 Aisin Seiki Co., Ltd. - Company Overview
11.5.2 Aisin Seiki Co., Ltd. Total Company Sales 2010-2014
11.5.3 Aisin Seiki Co., Ltd. Automotive Aftermarket Parts Market Products / Services
11.5.4 Aisin Seiki Co., Ltd. Primary Market Competitors 2016
11.5.5 Aisin Seiki Co., Ltd. Key Developments
11.6 Valeo Group
11.6.1 Valeo Group - Company Overview
11.6.2 Valeo Group Total Company Sales 2010-2014
11.6.3. Valeo Group Automotive Aftermarket Parts Market Products / Services
11.6.4. Valeo Group Primary Market Competitors 2016
11.6.5 Valeo Group Key Developments
11.7 Delphi Automotive PLC
11.7.1 Delphi Automotive PLC - Company Overview
11.7.2 Delphi Automotive Plc Total Company Sales 2010-2014
11.7.3 Delphi Automotive PLC Automotive Aftermarket Parts Market Products / Services
11.7.4 Delphi Automotive PLC Primary Market Competitors 2016
11.7.5 Delphi Automotive PLC Key Developments
11.8 Schaeffler AG
11.8.1 Schaeffler AG - Company Overview
11.8.2 Schaeffler AG Revenue Share by Region, By Business Segment 2016
11.8.3 Schaeffler AG Automotive Aftermarket Parts Market Products / Services
11.8.4 Schaeffler AG Primary Market Competitors 2016
11.8.5 Schaeffler AG Key Developments
11.9 MAHLE GmbH
11.9.1 MAHLE GmbH - Company Overview
11.9.2 MAHLE GmbH Revenue Share by Region, By Business Segment 2016
11.9.3 MAHLE GmbH Automotive Aftermarket Parts Market Products / Services
11.9.4 MAHLE GmbH Primary Market Competitors 2016
11.9.5 MAHLE GmbH Key Developments
11.10 Tenneco Inc.
11.10.1 Tenneco Inc. - Company Overview
11.10.2 Tenneco Inc. Automotive Aftermarket Parts Market Products / Services
11.10.3 Tenneco Inc. Total Company Sales 2010-2014
11.10.4 Tenneco Inc. Primary Market Competitors 2016
11.10.5 Tenneco Inc. Key Developments
11.11 Other Companies Involved in the Automotive Aftermarket Parts Market 2016
12. Strategic Recommendations
12.1 What Is The Present Market Scenario?
12.2 Which Region should be targeted?
12.3 Which Vehicle Category should be targeted?
12.4 Which Component should be targeted?
13. Conclusions
13.1 Key Research Findings
13.2 Conclusion by Country
13.3 Conclusion by Vehicle Type
13.4 Conclusion by Component
10. Glossary
List of Tables
Table 1.1: Automotive Aftermarket Parts Market (US$ Bn) – Research Scope
Table 2.1: Categories of Automotive Aftermarket Parts
Table 3.1: Global Automotive Aftermarket Parts Market Forecast 2017-2027 (US$Bn, AGR %, CAGR %)
Table 4.1: Global Automotive Aftermarket Parts Market Forecast by Geography 2017-2027 (US$Bn, AGR %)
Table 4.2: Asia Oceania Automotive Aftermarket Parts Market Forecast 2017-2027 (US$Bn, AGR %)
Table 4.3: Europe Automotive Aftermarket Parts Market Forecast 2017-2027 (US$Bn, AGR %,)
Table 4.4: Americas Automotive Aftermarket Parts Market Forecast 2017-2027 (US$Bn, AGR %)
Table 4.5: Rest of World Automotive Aftermarket Parts Market Forecast 2017-2027 (US$Bn, AGR %)
Table 5.1: Global Automotive Aftermarket Parts Submarket Forecast by Component, 2017-2027 (US$Bn, AGR %)
Table 5.2: Global Automotive Aftermarket Tire Forecast 2017-2027 (US$Bn, AGR %)
Table 5.3: Global Automotive Aftermarket Battery Forecast 2017-2027 (US$Bn, AGR %)
Table 5.4: Global Automotive Aftermarket Filters Forecast 2017-2027 (US$Bn, AGR %)
Table 5.5: Global Automotive Aftermarket Braking Products Forecast 2017-2027 (US$Bn, AGR %)
Table 5.6: Global Automotive Aftermarket Lighting Parts Forecast 2017-2027 (US$Bn, AGR %)
Table 5.7: Global Automotive Aftermarket Spark Parks Forecast 2017-2027 (US$Bn, AGR %)
Table 5.8: Global Automotive Aftermarket Parts Collision Body Forecast 2017-2027 (US$Bn, AGR %)
Table 5.9: Global Automotive Aftermarket Parts Starters & Alternators Forecast 2017-2027 (US$Bn, AGR %)
Table 5.10: Global Automotive Aftermarket Exhaust Components Forecast 2017-2027 (US$Bn, AGR %)
Table 5.11: Global Automotive Aftermarket Wheels Forecast 2017-2027 (US$Bn, AGR %)
Table 5.12: Global Automotive Aftermarket Others Forecast 2017-2027 (US$Bn, AGR %)
Table 6.1: Global Automotive Aftermarket Parts Submarket Forecast by Vehicle Type 2017-2027 (US$Bn, AGR %)
Table 6.2: Global Automotive Aftermarket Parts Submarket Forecast By Passenger Car 2017-2027 (US$Bn, AGR %,)
Table 6.3: Global Automotive Aftermarket Parts Submarket Forecast By CV 2017-2027 (US$Bn, AGR %,)
Table 7.1: Americas Automotive Aftermarket Parts Market Forecast by Country, 2017-2027 (US$Bn, AGR %)
Table 7.2: U.S. Automotive Aftermarket Parts Market Forecast 2017-2027 (US$Bn, AGR %)
Table 7.3: Canada Automotive Aftermarket Parts Market Forecast 2017-2027 (US$Bn, AGR %)
Table 7.4: Mexico Automotive Aftermarket Parts Market Forecast 2017-2027 (US$Bn, AGR %)
Table 7.5: Brazil Automotive Aftermarket Parts Market Forecast 2017-2027 (US$Bn, AGR %)
Table 7.6: Rest of Americas Automotive Aftermarket Parts Market Forecast 2017-2027 (US$Bn, AGR %)
Table 7.7: Americas Automotive Aftermarket Parts Submarket Forecast by Component, 2017-2027 (US$Bn, AGR %,)
Table 7.8: Americas Automotive Aftermarket Parts Submarket Forecast by Vehicle Type, 2017-2027 (US$Bn, AGR %)
Table 8.1: Asia Oceania Automotive Aftermarket Parts Market Forecast by Country, 2017-2027 (US$Bn, AGR %)
Table 8.2: China Automotive Aftermarket Parts Market Forecast 2017-2027 (US$Bn, AGR %)
Table 8.3: India Automotive Aftermarket Parts Market Forecast 2017-2027 (US$Bn, AGR %)
Table 8.4: Japan Automotive Aftermarket Parts Market Forecast 2017-2027 (US$Bn, AGR %)
Table 8.5: South Korea Automotive Aftermarket Parts Market Forecast 2017-2027 (US$Bn, AGR %)
Table 8.6: Rest of Asia Oceania Automotive Aftermarket Parts Market Forecast 2017-2027 (US$Bn, AGR %)
Table 8.7: Asia Oceania Automotive Aftermarket Parts Submarket Forecast by Component, 2017-2027 (US$Bn, AGR %,)
Table 8.8: Asia Oceania Automotive Aftermarket Parts Submarket Forecast by Vehicle Type, 2017-2027 (US$Bn, AGR %)
Table 9.1: Europe Automotive Aftermarket Parts Market Forecast by Country, 2017-2027 (US$Bn, AGR %)
Table 9.2: Germany Automotive Aftermarket Parts Market Forecast 2017-2027 (US$Bn, AGR %,)
Table 9.3: Spain Automotive Aftermarket Parts Market Forecast 2017-2027 (US$Bn, AGR %)
Table 9.4: U.K Automotive Aftermarket Parts Market Forecast 2017-2027 (US$Bn, AGR %)
Table 9.5: Italy Automotive Aftermarket Parts Market Forecast 2017-2027 (US$Bn, AGR %)
Table 9.6: Russia Automotive Aftermarket Parts Market Forecast 2017-2027 (US$Bn, AGR %)
Table 9.7: Rest of Europe Automotive Aftermarket Parts Market Forecast 2017-2027 (US$Bn, AGR %)
Table 9.8: Europe Automotive Aftermarket Parts Submarket Forecast by Component, 2017-2027 (US$Bn, AGR %)
Table 9.9: Europe Automotive Aftermarket Parts Submarket Forecast by Vehicle Type, 2017-2027 (US$Bn, AGR %)
Table 10.1: Rest of World Automotive Aftermarket Parts Submarket Forecast by Component, 2017-2027 (US$Bn, AGR %)
Table 10.2: Rest of World Automotive Aftermarket Parts Submarket Forecast by Vehicle Type, 2017-2027 (US$Bn, AGR %)
Table 11.1: Continental AG Profile 2016 (CEO, Total Company Sales US$m, Share of Company Sales from Automotive Aftermarket Parts Market %, Business Segment in the Market, Submarket Involvement, HQ, Founded, No. of Employees, Website)
Table 11.2: Continental AG Income Statement Summary 2015-2016 (all in $ml except EPS)
Table 11.3: Continental AG Automotive Aftermarket Parts Market Products / Services (Product Segment, Product)
Table 11.4: Continental AG Automotive Aftermarket Parts Market Key Developments
Table 11.5: Denso Corporation Profile 2016 (CEO, Total Company Sales US$m, Business Segment in the Market, Submarket Involvement, HQ, Founded, No. of Employees, Website)
Table 11.6: Denso Corporation Income Statement Summary 2012-2016 (all in $Bn except EPS)
Table 11.7: Denso Corporation Automotive Aftermarket Parts Market Products / Services (Product Segment, Product)
Table 11.8: Denso Corporation Automotive Aftermarket Parts Market Key Developments
Table 11.9: ZF Friedrichshafen AG Profile 2016 (CEO, Total Company Sales US$m, Sales in the Market US$m, Submarket Involvement, HQ, Founded, No. of Employees, Website)
Table 11.10: ZF Friedrichshafen AG Income Statement Summary 2014 and 2015 (all in $ml except EPS)
Table 11.11: ZF Friedrichshafen AG Automotive Aftermarket Parts Market Products / Services (Product Segment, Product)
Table 11.12: ZF Friedrichshafen AG Automotive Aftermarket Parts Market Key Developments
Table 11.13: Magna International Profile 2016 (CEO, Total Company Sales US$m, Business Segment in the Market, Submarket Involvement, HQ, Founded, No. of Employees, Website)
Table 11.14: Magna International Income Statement Summary 2012-2016 (all in $ml except EPS)
Table 11.15: Magna International Automotive Aftermarket Parts Market Products / Services (Product Segment, Product)
Table 11.16: Magna International Automotive Aftermarket Parts Market Key Developments
Table 11.17: Aisin Seiki Co., Ltd. Profile 2016 (CEO, Total Company Sales US$m, Strongest Business Region, Business Segment in the Market, Submarket Involvement, HQ, Founded, No. of Employees, Website)
Table 11.18: Aisin Income Statement Summary 2015, 2016 (all in $mn except EPS)
Table 11.19: Aisin Seiki Co., Ltd. Automotive Aftermarket Parts Market Products / Services (Product Segment, Product)
Table 11.20: Aisin Seiki Co., Ltd. Automotive Aftermarket Parts Market Key Developments
Table 11.21: Valeo Group Profile 2016 (CEO, Total Company Sales US$m, Business Segment in the Market, Submarket Involvement, HQ, Founded, No. of Employees, Website)
Table 11.22: Valeo Group Income Statement Summary 2012-2016 (all in $ml)
Table 11.23: Valeo Group Automotive Aftermarket Parts Market Products / Services (Product Segment, Product)
Table 11.24: Valeo Group Automotive Aftermarket Parts Market Key Developments
Table 11.25: Delphi Automotive PLC Profile 2016 (CEO, Total Company Sales US$m, Business Segment in the Market, Submarket Involvement, HQ, Founded, No. of Employees, Website)
Table 11.26: Delphi Automotive Plc Income Statement Summary 2014-2016 (all in $ml)
Table 11.27: Delphi Automotive PLC Automotive Aftermarket Parts Market Products / Services (Product Segment, Product)
Table 11.28: Delphi Automotive PLC Automotive Aftermarket Parts Market Key Developments
Table 11.29: Schaeffler AG Profile 2016 (CEO, Total Company Sales US$m, Business Segment in the Market, Submarket Involvement, HQ, Founded, No. of Employees, Website)
Table 11.30: Schaeffler AG Income Statement Summary 2014 and 2015 (all in $ml)
Table 11.31: Schaeffler AG Automotive Aftermarket Parts Market Products / Services (Product Segment, Product)
Table 11.32: Schaeffler AG Automotive Aftermarket Parts Market Key Developments
Table 11.33: MAHLE GmbH Profile 2016 (CEO, Total Company Sales US$m, Sales in the Market US$m, Business Segment in the Market, Submarket Involvement, HQ, Founded, No. of Employees, Website)
Table 11.34: MAHLE GmbH Income Statement Summary 2012-2016 (all in $ml except EPS)
Table 11.35: MAHLE GmbH Automotive Aftermarket Parts Market Products / Services (Product Segment, Product)
Table 11.36: MAHLE GmbH Automotive Aftermarket Parts Market Key Developments
Table 11.37: Tenneco Inc. Profile 2016 (CEO, Total Company Sales US$m, Business Segment in the Market, Submarket Involvement, HQ, Founded, No. of Employees, Website)
Table 11.38: Changzhou Xingyu Automotive Lighting Systems Co., Ltd. Income Statement Summary 2012-2016 (all in $ml)
Table 11.39: Tenneco Inc. Automotive Aftermarket Parts Market Products / Services (Product Segment, Product)
Table 11.40: Tenneco Inc. Automotive Aftermarket Parts Market Key Developments
List of Figures
Figure 2.1: Vehicle Production (Units) Historical Data,2006-2016
Figure 2.2: Global Vehicle Sales (Units) Historical Data, 2006-2016
Figure 3.1: Global Automotive Aftermarket Parts Market Forecast 2017-2027 (US$Bn, AGR %)
Figure 4.1: Global Automotive Aftermarket Parts Market AGR Forecast by Geography 2017-2027 (AGR %)
Figure 4.2: Global Automotive Aftermarket Parts Market Forecast by Geography 2017-2027 ($Bn)
Figure 4.3: Global Automotive Aftermarket Parts Market Share Forecast by Geography 2017 (% Share)
Figure 4.4: Global Automotive Aftermarket Parts Market Share Forecast by Geography 2022 (% Share)
Figure 4.5: Global Automotive Aftermarket Parts Market Share Forecast by Geography 2027 (% Share)
Figure 4.6: Asia Oceania Automotive Aftermarket Parts Market Forecast 2017-2027 (US$Bn, AGR %)
Figure 4.7: Asia Oceania Automotive Aftermarket Parts Market Share Forecast 2017 (% Share)
Figure 4.8: Europe Automotive Aftermarket Parts Market Forecast 2017-2027 (US$Bn, AGR %)
Figure 4.9: Europe Automotive Aftermarket Parts Market Share 2017 (% Share)
Figure 4.10: Americas Automotive Aftermarket Parts Market Forecast 2017-2027 (US$Bn, AGR %)
Figure 4.11: Americas Automotive Aftermarket Parts Market Share Forecast by Geography 2017 (% Share)
Figure 4.12: Rest of World Automotive Aftermarket Parts Market Forecast 2017-2027 (US$Bn, AGR %)
Figure 4.13: Rest of World Automotive Aftermarket Parts Market Share Forecast by Geography 2017 (% Share)
Figure 5.1: Global Automotive Aftermarket Parts Submarket AGR Forecast by Component 2017-2027 (AGR %)
Figure 5.2: Global Automotive Aftermarket Parts Submarket by Component 2017-2027 ($Bn)
Figure 5.3: Global Automotive Aftermarket Parts Submarket Share Forecast by Component 2017 (% Share)
Figure 5.4: Global Automotive Aftermarket Parts Submarket Share Forecast by Component 2022 (% Share)
Figure 5.5: Global Automotive Aftermarket Parts Submarket Share Forecast by Component 2027 (% Share)
Figure 5.6: Global Automotive Aftermarket Tire Market Forecast 2017-2027 (US$Bn, AGR %)
Figure 5.7: Automotive Aftermarket Parts Tires Market Share 2017 (% Share)
Figure 5.8: Automotive Aftermarket Parts Battery Market Forecast 2017-2027 (US$Bn, AGR %)
Figure 5.9: Global Automotive Aftermarket Parts Battery Market Share 2017 (% Share)
Figure 5.10: Global Automotive Aftermarket Filters Market Forecast 2017-2027 (US$Bn, AGR %)
Figure 5.11: Global Automotive Aftermarket Filters Market Share 2017 (% Share)
Figure 5.12: Global Automotive Aftermarket Braking Products Market Forecast 2017-2027 (US$Bn, AGR %)
Figure 5.13: Global Automotive Aftermarket Braking Products Market Share Forecast by Geography 2017 (% Share)
Figure 5.14: Global Automotive Aftermarket Lighting Parts Market Forecast 2017-2027 (US$Bn, AGR %)
Figure 5.15: Global Automotive Aftermarket Lighting Parts Market Share 2017 (% Share)
Figure 5.16: Global Automotive Aftermarket Spark Plugs Market Forecast 2017-2027 (US$Bn, AGR %)
Figure 5.17: Global Automotive Aftermarket Spark Plugs Market Share 2017 (% Share)
Figure 5.18: Global Automotive Aftermarket Parts Collision Body Market Forecast 2017-2027 (US$Bn, AGR %)
Figure 5.19: Global Automotive Aftermarket Parts Collision Body Market Share Forecast 2017 (% Share)
Figure 5.20: Global Automotive Aftermarket Parts Starters & Alternators Market Forecast 2017-2027 (US$Bn, AGR %)
Figure 5.21: Global Automotive Aftermarket Parts Starter & Alternators Market Share 2017 (% Share)
Figure 5.22: Global Automotive Aftermarket Exhaust Components Market Forecast 2017-2027 (US$Bn, AGR %)
Figure 5.23: Global Automotive Aftermarket Parts Exhaust Components Market Share 2017 (% Share)
Figure 5.24: Global Automotive Aftermarket Wheels Market Forecast 2017-2027 (US$Bn, AGR %)
Figure 5.25: Global Automotive Aftermarket Parts Wheels Market Share 2017 (% Share)
Figure 5.26: Global Automotive Aftermarket Others Market Forecast 2017-2027 (US$Bn, AGR %)
Figure 5.27: Global Automotive Aftermarket Parts Others Market Share 2017 (% Share)
Figure 6.1: Global Automotive Aftermarket Parts Submarket AGR Forecast by Vehicle Type 2017-2027 (AGR %)
Figure 6.2: Global Automotive Aftermarket Parts Submarket Forecast by Vehicle Type 2017-2027 ($Bn)
Figure 6.3: Global Automotive Aftermarket Parts Submarket Share Forecast by Vehicle Type 2017 (% Share)
Figure 6.4: Global Automotive Aftermarket Parts Submarket Share Forecast by Vehicle Type 2022 (% Share)
Figure 6.5: Global Automotive Aftermarket Parts Submarket Share Forecast by Vehicle Type 2027 (% Share)
Figure 6.6 Global Automotive Aftermarket Parts Submarket Forecast By Passenger Car 2017-2027 (US$Bn, AGR %)
Figure 6.7: Global Automotive Aftermarket Parts Submarket Share Forecast Passenger Cars 2017 (% Share)
Figure 6.8: Global Automotive Aftermarket Parts Submarket Forecast By Commercial Vehicle 2017-2027 (US$Bn, AGR %)
Figure 6.9: Global Automotive Aftermarket Parts Submarket Commercial Vehicles Market Share 2017 (% Share)
Figure 7.1: Americas Automotive Aftermarket Parts Market AGR Forecast by Country 2017-2027 (AGR %)
Figure 7.2: Americas Automotive Aftermarket Parts Market Forecast by Country 2017-2027 (AGR %)
Figure 7.3: Americas Automotive Aftermarket Parts Market Share Forecast by Country 2017 (% Share
Figure 7.4: Americas Automotive Aftermarket Parts Market Share Forecast by Country 2022 (% Share)
Figure 7.5: Americas Automotive Aftermarket Parts Market Share Forecast by Country 2027 (% Share)
Figure 7.6 U.S. Automotive Aftermarket Parts Market Forecast 2017-2027 (US$Bn, AGR %)
Figure 7.7: U.S. Automotive Aftermarket Parts Market Share Forecast 2017 (% Share)
Figure 7.8: Canada Automotive Aftermarket Parts Market Forecast 2017-2027 (US$Bn, AGR %)
Figure 7.9: Canada Automotive Aftermarket Parts Market Share 2017 (% Share)
Figure 7.10: Mexico Automotive Aftermarket Parts Market Forecast 2017-2027 (US$Bn, AGR %)
Figure 7.11: Mexico Automotive Aftermarket Parts Market Share Forecast by Country 2017 (% Share)
Figure 7.12: Brazil Automotive Aftermarket Parts Market Forecast 2017-2027 (US$Bn, AGR %)
Figure 7.13: Brazil Automotive Aftermarket Parts Market Share Forecast by Country 2017 (% Share)
Figure 7.14: Rest of Americas Automotive Aftermarket Parts Market Forecast 2017-2027 (US$Bn, AGR %)
Figure 7.15: Rest of Americas Automotive Aftermarket Parts Market Share Forecast by Country 2017 (% Share)
Figure 7.16: Americas Automotive Aftermarket Parts Submarket AGR Forecast by Component 2017-2027 (AGR %)
Figure 7.17: Americas Automotive Aftermarket Parts Submarket Forecast by Component 2017-2027 ($Bn)
Figure 7.18: Americas Automotive Aftermarket Parts Submarket Share Forecast by Component 2017 (% Share)
Figure 7.19: Americas Automotive Aftermarket Parts Submarket Share Forecast by Component 2022 (% Share)
Figure 7.20: Americas Automotive Aftermarket Parts Submarket Share Forecast by Component 2027 (% Share)
Figure 7.21: Americas Automotive Aftermarket Parts Submarket AGR Forecast by Vehicle Type 2017-2027 (AGR %)
Figure 7.22: Americas Automotive Aftermarket Parts Submarket Forecast By Vehicles Type 2017-2027
Figure 7.23: Americas Automotive Aftermarket Parts Submarket Share Forecast by Vehicle Type 2017 (% Share)
Figure 7.24: Americas Automotive Aftermarket Parts Submarket Share Forecast by Vehicle Type 2022 (% Share)
Figure 7.25: Americas Automotive Aftermarket Parts Submarket Share Forecast by Vehicle Type 2027 (% Share)
Figure 8.1: Asia Oceania Automotive Aftermarket Parts Market AGR Forecast by Country 2017-2027 (AGR %)
Figure 8.2: Asia Oceania Automotive Aftermarket Parts Market Forecast by Country 2017-2027 ($Bn)
Figure 8.3: Asia Oceania Automotive Aftermarket Parts Market Share Forecast by Country 2017 (% Share)
Figure 8.4: Asia Oceania Automotive Aftermarket Parts Market Share Forecast by Country 2022 (% Share)
Figure 8.5: Asia Oceania Automotive Aftermarket Parts Market Share Forecast by Country 2027 (% Share)
Figure 8.6: China Automotive Aftermarket Parts Market Forecast 2017-2027 (US$Bn, AGR %)
Figure 8.7: China Automotive Aftermarket Parts Market Share Forecast 2017 (% Share)
Figure 8.8: India Automotive Aftermarket Parts Market Forecast 2017-2027 (US$Bn, AGR %)
Figure 8.9: India Automotive Aftermarket Parts Market Share 2017 (% Share)
Figure 8.10: Japan Automotive Aftermarket Parts Market Forecast 2017-2027 (US$Bn, AGR %)
Figure 8.11: Japan Automotive Aftermarket Parts Market Share Forecast by Country 2017 (% Share)
Figure 8.12: South Korea Automotive Aftermarket Parts Market Forecast 2017-2027 (US$Bn, AGR %)
Figure 8.13: South Korea Automotive Aftermarket Parts Market Share Forecast by Country 2017 (% Share)
Figure 8.14: Rest of Asia Oceania Automotive Aftermarket Parts Market Forecast 2017-2027 (US$Bn, AGR %)
Figure 8.15: Rest of Asia Oceania Automotive Aftermarket Parts Market Share Analysis (% Share)
Figure 8.16: Asia Oceania Automotive Aftermarket Parts Submarket AGR Forecast by Component 2017-2027 (AGR %)
Figure 8.17: Asia Oceania Automotive Aftermarket Parts Submarket AGR Forecast by Component 2017-2027 ($Bn)
Figure 8.18: Asia Oceania Automotive Aftermarket Parts Submarket Share Forecast by Component 2017 (% Share)
Figure 8.19: Asia Oceania Automotive Aftermarket Parts Submarket Share Forecast by Component 2022 (% Share)
Figure 8.20: Asia Oceania Automotive Aftermarket Parts Submarket Share Forecast by Component 2027 (% Share)
Figure 8.21: Asia Oceania Automotive Aftermarket Parts Submarket AGR Forecast by Vehicle Type 2017-2027 (AGR %)
Figure 8.22: Asia Oceania Automotive Aftermarket Parts Submarket Value Forecast by Vehicle Type 2017-2027 ($Bn)
Figure 8.23: Asia Oceania Automotive Aftermarket Parts Submarket Share Forecast by Vehicle Type 2017 (% Share)
Figure 8.24: Asia Oceania Automotive Aftermarket Parts Submarket Share Forecast by Vehicle Type 2022 (% Share)
Figure 8.25: Asia Oceania Automotive Aftermarket Parts Submarket Share Forecast by Vehicle Type 2027 (% Share)
Figure 9.1: Europe Automotive Aftermarket Parts Market AGR Forecast by Country 2017-2027 (AGR %)
Figure 9.2: Europe Automotive Aftermarket Parts Market AGR Forecast by Country 2017-2027 ($Bn)
Figure 9.3: Europe Automotive Aftermarket Parts Market Share Forecast by Country 2017 (% Share)
Figure 9.4: Europe Automotive Aftermarket Parts Market Share Forecast by Country 2022 (% Share)
Figure 9.5: Europe Automotive Aftermarket Parts Market Share Forecast by Country 2027 (% Share)
Figure 9.6 Germany Automotive Aftermarket Parts Market Forecast 2017-2027 (US$Bn, AGR %)
Figure 9.7: Germany Automotive Aftermarket Parts Market Share Forecast 2017 (% Share)
Figure 9.8: Spain Automotive Aftermarket Parts Market Forecast 2017-2027 (US$Bn, AGR %)
Figure 9.9: Spain Automotive Aftermarket Parts Market Share 2017 (% Share)
Figure 9.10: U.K Automotive Aftermarket Parts Market Forecast 2017-2027 (US$Bn, AGR %)
Figure 9.11: U.K Automotive Aftermarket Parts Market Share Forecast by Country 2017 (% Share)
Figure 9.12: Italy Automotive Aftermarket Parts Market Forecast 2017-2027 (US$Bn, AGR %)
Figure 9.13: Russia Automotive Aftermarket Parts Market Forecast 2017-2027 (US$Bn, AGR %)
Figure 9.14: Russia Automotive Aftermarket Parts Submarket Share Forecast by Country 2017 (% Share)
Figure 9.15: Rest of Europe Automotive Aftermarket Parts Market Forecast 2017-2027 (US$Bn, AGR %)
Figure 9.16: Rest of Europe Automotive Aftermarket Parts Market Share Forecast by Country 2017 (% Share)
Figure 9.17: Europe Automotive Aftermarket Parts Submarket AGR Forecast by Component 2017-2027 (AGR %)
Figure 9.18: Europe Automotive Aftermarket Parts Submarket AGR Forecast by Component, 2017-2027 ($Bn)
Figure 9.19: Europe Automotive Aftermarket Parts Submarket Share Forecast by Component 2017 (% Share)
Figure 9.20: Europe Automotive Aftermarket Parts Submarket Share Forecast by Component 2022 (% Share)
Figure 9.21: Europe Automotive Aftermarket Parts Submarket Share Forecast by Component 2027 (% Share)
Figure 9.22: Europe Automotive Aftermarket Parts Submarket AGR Forecast by Vehicle Type 2017-2027 (AGR %)
Figure 9.23: Europe Automotive Aftermarket Parts Submarket Value Forecast by Vehicle Type 2017-2027 ($Bn)
Figure 9.24: Europe Automotive Aftermarket Parts Submarket Share Forecast by Vehicle Type 2017 (% Share)
Figure 9.25: Europe Automotive Aftermarket Parts Submarket Share by Vehicle Type 2022 (% Share)
Figure 9.26: Europe Automotive Aftermarket Parts Submarket Share by Vehicle Type 2027 (% Share)
Figure 10.1: Rest of World Automotive Aftermarket Parts Submarket AGR Forecast by Component 2017-2027 (AGR %)
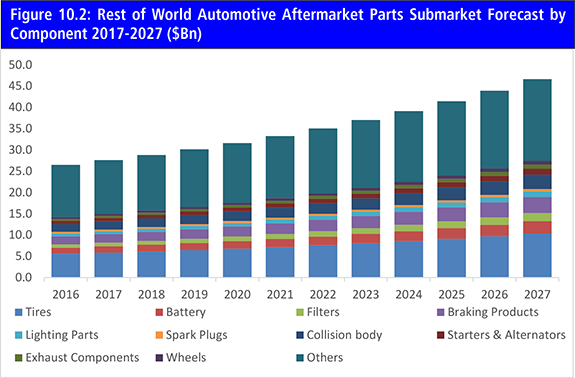
Figure 10.2: Rest of World Automotive Aftermarket Parts Submarket Forecast by Component 2017-2027 ($Bn)
Figure 10.3: Rest of World Automotive Aftermarket Parts Submarket Share Forecast by Component 2017 (% Share)
Figure 10.4: Rest of World Automotive Aftermarket Parts Submarket Share Forecast by Component 2022 (% Share)
Figure 10.5: Rest of World Automotive Aftermarket Parts Submarket Share Forecast by Component 2027 (% Share)
Figure 10.6: Rest of World Automotive Aftermarket Parts Submarket AGR Forecast by Vehicle Type 2017-2027 (AGR %)
Figure 10.7: Rest of World Automotive Aftermarket Parts Submarket Value Forecast by Vehicle Type 2017-2027 (US$ Bn)
Figure 10.8: Rest of World Automotive Aftermarket Parts Submarket Share Forecast by Vehicle Type 2017 (% Share)
Figure 10.9: Rest of World Automotive Aftermarket Parts Submarket Share Forecast by Vehicle Type 2022 (% Share)
Figure 10.10: Rest of World Automotive Aftermarket Parts Submarket Share Forecast by Vehicle Type 2027 (% Share)
Figure 11.1: Continental AG Automotive Aftermarket Parts Market Revenue Share By Region, By Business Segment (2016)
Figure 11.2: Continental AG Primary Market Competitors 2016
Figure 11.3: Denso Corporation Automotive Aftermarket Parts Market Revenue Share By Region, By Business Segment (2016)
Figure 11.4: Denso Corporation Primary Market Competitors 2016
Figure 11.5: ZF Friedrichshafen AG Automotive Aftermarket Parts Market Revenue Share By Region, By Business Segment (2016)
Figure 11.6: ZF Friedrichshafen AG Primary Market Competitors 2016
Figure 11.7: Magna International Automotive Aftermarket Parts Market Revenue Share By Region, By Business Segment (2016)
Figure 11.8: Magna International Primary Market Competitors 2016
Figure 11.9: Aisin Seiki Co., Ltd. Automotive Aftermarket Parts Market Revenue Share By Region, By Business Segment (2016)
Figure 11.10: Aisin Seiki Co., Ltd. Primary Market Competitors 2016
Figure 11.11: Valeo Group Automotive Aftermarket Parts Market Revenue Share By Region, By Business Segment (2016)
Figure 11.12: Valeo Group Primary Market Competitors 2016
Figure 11.13: Delphi Automotive Plc Revenue Share By Region, By Business Segment (2016)
Figure 11.14: Delphi A4utomotive PLC Primary Market Competitors 2016
Figure 11.15: Schaeffler AG Automotive Aftermarket Parts Market Revenue Share By Region, by Business segment (2016)
Figure 11.16: Schaeffler AG Primary Market Competitors 2016
Figure 11.17: MAHLE GmbH Automotive Aftermarket Parts Market Revenue Share By Region, By Business Segment, By Product Ratio (2016)
Figure 11.18: MAHLE GmbH Primary Market Competitors 2016
Figure 11.19: Tenneco Inc. Automotive Aftermarket Parts Market Revenue Share By Region, By Business Segment (2016)
Figure 11.20: Tenneco Inc. Primary Market Competitors 2016