Industries > Automotive > Electric Bus / Coaches Market Report 2019-2029
Electric Bus / Coaches Market Report 2019-2029
Forecasts and Analysis by Technology (Full Battery Electric Buses (BEB), Hybrid Electric Buses (HEB) and Fuel Cell Electric Buses (FCEB) and Geography (America, Europe, Asia Pacific and MEA) PLUS Profiles of Leading Companies With Recent Contracts and Partnerships in Electric Buses / Coaches Market
The latest report from business intelligence provider Visiongain offers comprehensive analysis of the global Electric Bus / Coaches market. Visiongain assesses that this market will generate revenues of US$ 39,623mn in 2019.
How this report will benefit you
Read on to discover how you can exploit the future business opportunities emerging in this sector.
In this brand-new report, you find over 130 in-depth tables, charts and graphs – all unavailable elsewhere.
The 162-page report provides clear detailed insight into the global Electric Bus/ Coach Market. Discover the key drivers and challenges affecting the market.
By ordering and reading our brand-new report today you stay better informed and ready to act.
Report Scope
• Global Electric Bus / Coaches market forecasts from 2019-2029
• Regional Electric Bus / Coaches market forecasts from 2019-2029 covering Asia Pacific, America, Europe, and Middle East and Africa
• Country Electric Bus / Coaches forecasts from 2019-2029 covering China, the US, the UK, Germany, India, Canada, South Africa, and Brazil
• Electric Bus / Coaches submarket forecasts from 2019-2029
• Full Battery Electric Buses (BEB) Forecast 2019-2029
• Hybrid Electric Buses (HEB Forecast 2019-2029
• Fuel Cell Electric Buses (FCEB) Forecast 2019-2029
• Analysis of the key factors driving growth in the global, regional and country level Electric Bus / Coaches markets from 2019-2029
• Forecast data for Electric Bus / Coaches during the 2019–2029 period; technology type is provided at a global level, regional level, and leading country level
• Detailed tables containing 130 contracts / projects and programmes in the Electric Bus / Coaches by country
• Profiles of the leading Electric Bus / Coaches in 2019 at a global level and for leading countries
How will you benefit from this report?
• Keep your knowledge base up to speed. Don’t get left behind
• Reinforce your strategic decision-making with definitive and reliable market data
• Learn how to exploit new technological trends
• Realise your company’s full potential within the market
• Understand the competitive landscape and identify potential new business opportunities & partnerships
Who should read this report?
• Anyone within the Electric Bus / Coaches value chain.
• Business development managers
• Automotive OEM’s
• Bus and Coach Manufacturers
• Electric Vehicle Specialists
• Battery manufacturers
• Component Suppliers
• Charging Infrastructure Providers
• Bus / Coach Operating Companies
• Public Transport Bodies
• Marketing Managers
• Technologists
• Suppliers
• Investors
• Banks
• Government agencies
• Contractors
Visiongain’s study is intended for anyone requiring commercial analyses for the Electric Bus / Coaches market and leading companies. You find data, trends and predictions.
Electric Bus & Coaches Market Analysis : Forecasts and Analysis by Technology (Full Battery Electric Buses (BEB), Hybrid Electric Buses (HEB) and Fuel Cell Electric Buses (FCEB) and Geography (America, Europe, Asia Pacific and MEA) PLUS Profiles of Leading Companies With Recent Contracts and Partnerships in Electric Buses / Coaches Market. Avoid missing out by staying informed – get our report now.
Visiongain is a trading partner with the US Federal Government
CCR Ref number: KD4R6
1. Report Overview
1.1. Electric Bus / Coaches Market Definition and Research Scope
1.2. Why You Should Read This Report
1.3. How This Report Delivers
1.4. Key Questions Answered by This Analytical Report Include:
1.5. Who is This Report for?
1.6. Methodology
1.7. Frequently Asked Questions (FAQ)
1.8. Associated Visiongain Reports
1.9. About Visiongain
2. Introduction to the Electric Bus / Coaches Market
2.1. Market Dynamics
3. Global Electric Bus / Coaches Market, 2019–2029
3.1. Global Electric Bus / Coaches Market forecast 2019–2029
3.2. Global Electric Bus / Coaches Market forecast 2019–2029
4. Global Electric Bus / Coaches Market, By Technology 2019-2029
4.1. Global Electric Bus / Coaches Market Forecast, By Technology 2019–2029
4.2. Global Electric Bus / Coaches Submarket forecast, By Full Battery, Operated Segment 2019-2029
4.2.1. Global Electric Bus / Coaches Market Forecast, By Hybrid Model Segment
4.3. Global Electric Bus / Coaches Submarket forecast, By Fuel Cell Operated Segment 2019-2029
5. Global Electric Bus / Coaches Market, By Length 2019-2029
5.1. Global Electric Bus / Coaches Market Forecast, By Length 2019–2029
5.2. Global Electric Bus / Coaches Submarket forecast, By Below 8 Metre Segment 2019-2029
5.2.1. Global Electric Bus / Coaches Market forecast, By 8-12 Metre Segment
5.2.2. Global Electric Bus / Coaches Submarket forecast, By Above 12 Metre Segment 2019-2029
6. Global Electric Bus / Coaches Market, by Geography 2019–2029
6.1. America Electric Bus / Coaches Market forecast 2019–2029
6.1.1. America Electric Bus / Coaches Market Forecast, By Technology 2019-2029
6.1.2. America Electric Bus / Coaches Market forecast, By Length 2019-2029
6.1.3. America Electric Bus / Coaches Market Forecast, By Country 2019-2029
6.1.3.1. U.S. Electric Bus / Coaches Market forecast 2019–2029
6.1.3.2. Canada Electric Bus / Coaches Market forecast 2019–2029
6.1.3.3. Mexico Electric Bus / Coaches Market forecast 2019–2029
6.1.3.4. Brazil Electric Bus / Coaches Market forecast 2019–2029
6.1.3.5. Rest of America Electric Bus / Coaches Market forecast 2019–2029
6.2. Europe Electric Bus / Coaches Market forecast 2019–2029
6.2.1. Europe Electric Bus / Coaches Market Forecast, By Technology 2019-2029
6.2.2. Europe Electric Bus / Coaches Market forecast, By Length 2019-2029
6.2.3. Europe Electric Bus / Coaches Market Forecast, By Country 2019-2029
6.2.3.1. UK Electric Bus / Coaches Market forecast 2019–2029
6.2.3.2. Germany Electric Bus / Coaches Market forecast 2019–2029
6.2.3.3. Netherlands Electric Bus / Coaches Market forecast 2019–2029
6.2.3.4. Poland Electric Bus / Coaches Market forecast 2019–2029
6.2.3.5. Rest of Europe Electric Bus / Coaches Market forecast 2019–2029
6.3. Asia Pacific Electric Bus / Coaches Market forecast 2019–2029
6.3.1. Asia Pacific Electric Bus / Coaches Market Forecast, By Technology 2019-2029
6.3.2. Asia Pacific Electric Bus / Coaches Market forecast, By Length 2019-2029
6.3.3. Asia Pacific Electric Bus / Coaches Market Forecast, By Country 2019-2029
6.3.3.1. China Electric Bus / Coaches Market forecast 2019–2029
6.3.3.2. India Electric Bus / Coaches Market forecast 2019–2029
6.3.3.3. Australia Electric Bus / Coaches Market forecast 2019–2029
6.3.3.4. Rest of Asia Pacific Electric Bus / Coaches Market forecast 2019–2029
6.4. Middle East and Africa (MEA) Electric Bus / Coaches Market forecast 2019–2029
6.4.1. Middle East and Africa (MEA) Electric Bus / Coaches Market Forecast, By Technology 2019-2029
6.4.2. Middle East and Africa (MEA) Electric Bus / Coaches Market forecast, By Length 2019-2029
6.4.3. Middle East and Africa (MEA) Electric Bus / Coaches Market Forecast, By Country 2019-2029
6.4.3.1. Saudi Arabia Electric Bus / Coaches Market forecast 2019–2029
6.4.3.2. UAE Electric Bus / Coaches Market forecast 2019–2029
7. Company Profiles – Electric Bus / Coaches Market 2019 – 2029
7.1. BYD Co. Ltd.
7.1.1. BYD Co. Ltd. Revenue 2014 - 2018
7.1.2. BYD Co. Ltd. Revenue Share by Business Segment, 2017
7.1.3. BYD Co. Ltd. Revenue Share by Region, 2017
7.1.4. BYD Co. Ltd. Recent Electric Bus Related Contracts and Programmes (2014-2018)
7.2. Daimler AG
7.2.1. Daimler AG Revenue 2014 - 2017
7.2.2. Daimler AG Revenue Share by Business Segment, 2017
7.2.3. Daimler AG Revenue Share by Region, 2017
7.2.4. Daimler AG Recent Electric Bus Related Contracts and Programmes (2014-2018)
7.2.5. Daimler AG Recent Electric Bus Related Products and Services
7.3. Golden Dragon
7.3.1. Golden Dragon Recent Electric Bus Related Contracts and Programmes (2014-2018)
7.3.2. Golden Dragon Recent Electric Bus Related Products and Services
7.4. NFI Group, Inc.
7.4.1. NFI Group, Inc. Revenue 2014 - 2018
7.4.2. NFI Group, Inc. Revenue Share by Business Segment, 2017
7.4.3. NFI Group, Inc. Revenue Share by Region, 2017
7.4.4. NFI Group, Inc. Recent Electric Bus Related Contracts and Programmes (2016-2018)
7.4.5. NFI Group, Inc. Recent Electric Bus Related Products and Services
7.5. Proterra Inc.
7.5.1. Proterra Inc. Current and Future Deployment of Electric Bus in the United States 2010 - 2020
7.5.2. Proterra Inc. Recent Electric Bus Related Contracts and Programmes (2015-2018)
7.5.3. Proterra Inc. Recent Electric Bus Related Products and Services
7.6. Solaris Bus & Coach S.A. (Acquired by CAF)
7.6.1. Solaris Bus & Coach S.A. Recent Electric Bus Related Contracts and Programmes (2016-2018)
7.6.2. Solaris Bus & Coach S.A. Recent Electric Bus Related Products and Services
7.7. VDL Bus & Coach bv
7.7.1. VDL Bus & Coach bv Recent Electric Bus Related Contracts and Programmes (2014-2018)
7.7.2. VDL Bus & Coach bv Recent Electric Bus Related Products and Services
7.8. Volvo AB
7.8.1. Volvo AB Revenue 2014 - 2018
7.8.2. Volvo AB Revenue Share by Business Segment, 2017
7.8.3. Volvo AB Revenue Share by Region, 2017
7.8.4. Volvo AB Recent Electric Bus Related Contracts and Programmes (2014-2018)
7.8.5. Volvo AB Recent Electric Bus Related Products and Services
7.9. Zhengzhou Yutong Bus Co., Ltd.
7.9.1. Zhengzhou Yutong Bus Co., Ltd. Revenue 2014 - 2018
7.9.2. Zhengzhou Yutong Bus Co., Ltd. Revenue Share by Business Segment, 2017
7.9.3. Zhengzhou Yutong Bus Co., Ltd. Revenue Share by Region, 2017
7.9.4. Zhengzhou Yutong Bus Co., Ltd. Recent Electric Bus Related Contracts and Programmes (2017-2018)
7.9.5. Zhengzhou Yutong Bus Co., Ltd. Recent Electric Bus Related Products and Services
7.10. Zhongtong Bus & Holding Co., Ltd.
7.10.1. Zhongtong Bus & Holding Co., Ltd. Revenue 2014 - 2018
7.10.2. Zhongtong Bus & Holding Co., Ltd. Revenue Share by Business Segment, 2017
7.10.3. Zhongtong Bus & Holding Co., Ltd. Revenue Share by Region, 2017
7.10.4. Zhongtong Bus & Holding Co., Ltd. Recent Electric Bus Related Contracts and Programmes (2017-2018)
7.10.5. Zhongtong Bus & Holding Co., Ltd. Recent Electric Bus Related Products and Services
8. Other companies operating in the Global Electric Bus / Coaches Market 2018
9. Conclusions and Recommendations
9.1. Key Research finding
9.2. Conclusion by Geography
9.3. Conclusion by Technology
9.4. Conclusion by Length
9.5. Strategic Recommendations
10. Glossary
Associated Visiongain Reports
Visiongain Report Sales Order Form
Appendix A
About Visiongain
Appendix B
Visiongain report evaluation form
List of Tables included in this report
Table 3.1: Global Electric Bus / Coaches Market forecast 2019–2029 (US$ Mn, AGR %, CAGR %, Cumulative)
Table 4.1: Global Electric Bus / Coaches Submarket forecast by Technology, 2019-2029 (US$ Mn, AGR %, CAGR %)
Table 4.2: Global Electric Bus / Coaches Market forecast 2019–2029 (US$ Mn, AGR %, CAGR %, Cumulative), By Full Battery Operated Segment
Table 4.3: Global Electric Bus / Coaches Market forecast 2019–2029 (US$ Mn, AGR %, CAGR %), By Hybrid Model Segment
Table 4.4: Global Electric Bus / Coaches Market forecast 2019–2029 (US$ Mn, AGR %, CAGR %, Cumulative), By Fuel Cell Operated Segment
Table 5.1: Global Electric Bus / Coaches Submarket forecast by Length, 2019-2029 (US$ Mn, AGR %, CAGR %)
Table 5.2: Global Electric Bus / Coaches Market forecast 2019–2029 (US$ Mn, AGR %, CAGR %, Cumulative), By Below 8 Metre Segment
Table 5.3: Global Electric Bus / Coaches Market forecast 2019–2029 (US$ Mn, AGR %, CAGR %), By 8-12 Metre Segment
Table 5.4: Global Electric Bus / Coaches Market forecast 2019–2029 (US$ Mn, AGR %, CAGR %, Cumulative), By Above 12 Metre Segment
Table 6. 1: Global Electric Bus / Coaches Market forecast by Geography 2019-2029 (US$ Mn, AGR %, CAGR %)
Table 6. 2: America Electric Bus / Coaches Market forecast, By Technology, 2019-2029 (US$ Mn, AGR %, CAGR %)
Table 6. 3: America Electric Bus / Coaches Market forecast, By Length, 2019-2029 (US$ Mn, AGR %, CAGR %)
Table 6. 4: America Electric Bus / Coaches Market Forecast, By Country, 2019-2029 (US$ Mn, AGR %, CAGR %)
Table 6. 5: U.S. Electric Bus / Coaches Market forecast 2019–2029 (US$ Mn, AGR %, CAGR %)
Table 6. 6: Canada Electric Bus / Coaches Market forecast 2019–2029 (US$ Mn, AGR %, CAGR %)
Table 6. 7: Mexico Electric Bus / Coaches Market forecast 2019–2029 (US$ Mn, AGR %, CAGR %)
Table 6. 8: Brazil Electric Bus / Coaches Market forecast 2019–2029 (US$ Mn, AGR %, CAGR %)
Table 6. 9: Rest of America Electric Bus / Coaches Market forecast 2019–2029 (US$ Mn, AGR %, CAGR %)
Table 6.10: Europe Electric Bus / Coaches Market Forecast, By Technology, 2019-2029 (US$ Mn, AGR %, CAGR %)
Table 6.11: Europe Electric Bus / Coaches Market forecast, By Length, 2019-2029 (US$ Mn, AGR %, CAGR %)
Table 6.12: Europe Electric Bus / Coaches Market Forecast, By Country, 2019-2029 (US$ Mn, AGR %, CAGR %)
Table 6.13: UK Electric Bus / Coaches Market forecast 2019–2029 (US$ Mn, AGR %, CAGR %)
Table 6.14: Germany Electric Bus / Coaches Market forecast 2019–2029 (US$ Mn, AGR %, CAGR %),
Table 6.15: Netherlands Electric Bus / Coaches Market forecast 2019–2029 (US$ Mn, AGR %, CAGR %)
Table 6.16: Poland Electric Bus / Coaches Market forecast 2019–2029 (US$ Mn, AGR %, CAGR %)
Table 6.17: Rest of Europe Electric Bus / Coaches Market forecast 2019–2029 (US$ Mn, AGR %, CAGR %)
Table 6.18: Asia Pacific Electric Bus / Coaches Market Forecast, By Technology, 2019-2029 (US$ Mn, AGR %, CAGR %)
Table 6.19: Asia Pacific Electric Bus / Coaches Market forecast, By Length, 2019-2029 (US$ Mn, AGR %, CAGR %)
Table 6.20: Asia Pacific Electric Bus / Coaches Market Forecast, By Country, 2019-2029 (US$ Mn, AGR %, CAGR %)
Table 6.21: China Electric Bus / Coaches Market forecast 2019–2029 (US$ Mn, AGR %, CAGR %)
Table 6.22: India Electric Bus / Coaches Market forecast 2019–2029 (US$ Mn, AGR %, CAGR %)
Table 6.23: Australia Electric Bus / Coaches Market forecast 2019–2029 (US$ Mn, AGR %, CAGR %)
Table 6.24: Rest of Asia Pacific Electric Bus / Coaches Market forecast 2019–2029 (US$ Mn, AGR %, CAGR %)
Table 6.25: Middle East and Africa (MEA) Electric Bus / Coaches Market Forecast, By Technology, 2019-2029 (US$ Mn, AGR %, CAGR %)
Table 6.26: Middle East and Africa (MEA) Electric Bus / Coaches Market forecast, By Length, 2019-2029 (US$ Mn, AGR %, CAGR %)
Table 6.27: Middle East and Africa (MEA) Electric Bus / Coaches Market Forecast, By Country, 2019-2029 (US$ Mn, AGR %, CAGR %)
Table 6.28: Saudi Arabia Electric Bus / Coaches Market forecast 2019–2029 (US$ Mn, AGR %, CAGR %)
Table 6.29: UAE Electric Bus / Coaches Market forecast 2019–2029 (US$ Mn, AGR %, CAGR %)
Table 7.1: BYD Co. Ltd. 2017 (CEO, Total Company Sales US$m, Strongest Business Region, HQ, Founded, No. of Employees)
Table 7.2: BYD Co. Ltd. Recent Electric Bus Related Contracts and Programmes
Table 7.3: Daimler AG 2017 (CEO, Total Company Sales US$m, Strongest Business Region, HQ, Founded, No. of Employees)
Table 7.4: Daimler AG Recent Electric Bus Related Contracts and Programmes
Table 7.5: Daimler AG Recent Electric Bus Related Products and Services
Table 7.6: Golden Dragon 2017 (CEO, Strongest Business Region, HQ, Founded, No. of Employees)
Table 7.7: Golden Dragon Recent Electric Bus Related Contracts and Programmes
Table 7.8: Golden Dragon Recent Electric Bus Related Products and Services
Table 7.9: NFI Group, Inc. 2017 (CEO, Total Company Sales US$m, Strongest Business Region, HQ, Founded, No. of Employees)
Table 7.10: NFI Group, Inc. Recent Electric Bus Related Contracts and Programmes
Table 7.11: NFI Group, Inc. Recent Electric Bus Related Products and Services
Table 7.12: Proterra Inc. 2017 (CEO, Total Company Sales US$m, Strongest Business Region, HQ, Founded, No. of Employees)
Table 7.13: Proterra Inc. Current and Future Deployment of Electric Bus in the United States
Table 7.14: Proterra Inc. Recent Electric Bus Related Contracts and Programmes
Table 7.15: Proterra Inc. Recent Electric Bus Related Products and Services
Table 7.16: Solaris Bus & Coach S.A. 2017 (CEO, Total Company Sales US$m, Strongest Business Region, HQ, Founded, No. of Employees)
Table 7.17: Solaris Bus & Coach S.A. Recent Electric Bus Related Contracts and Programmes
Table 7.18: Solaris Bus & Coach S.A. Recent Electric Bus Related Products and Services
Table 7.19: VDL Bus & Coach bv 2017 (CEO, Total Company Sales US$m, Strongest Business Region, HQ, Founded, No. of Employees)
Table 7.20: VDL Bus & Coach bv Recent Electric Bus Related Contracts and Programmes
Table 7.21: VDL Bus & Coach bv Recent Electric Bus Related Products and Services
Table 7.22: Volvo AB 2017 (CEO, Total Company Sales US$m, Strongest Business Region, HQ, Founded, No. of Employees)
Table 7.23: Volvo AB Recent Electric Bus Related Contracts and Programmes
Table 7.24: Volvo AB Recent Electric Bus Related Products and Services
Table 7.25: Zhengzhou Yutong Bus Co., Ltd. 2017 (CEO, Total Company Sales US$m, Strongest Business Region, HQ, Founded, No. of Employees)
Table 7.26: Zhengzhou Yutong Bus Co., Ltd. Recent Electric Bus Related Contracts and Programmes
Table 7.27: Zhengzhou Yutong Bus Co., Ltd. Recent Electric Bus Related Products and Services
Table 7.28: Zhongtong Bus & Holding Co., Ltd. 2017 (CEO, Total Company Sales US$m, Strongest Business Region, HQ, Founded, No. of Employees)
Table 7.29: Zhongtong Bus & Holding Co., Ltd. Recent Electric Bus Related Contracts and Programmes
Table 7.30: Zhongtong Bus & Holding Co., Ltd. Recent Electric Bus Related Products and Services
Table 8.1: Other Companies
Table 9.1 Global Electric Bus / Coaches Market Summary 2019,2024, 2029 ($m, CAGR%)
Table 9.2 Global Electric Bus / Coaches Market Summary, By Geography (2019)
Table 9.3 Global Electric Bus / Coaches Market Summary, By Technology (2019, 2029)
Table 9.4 Global Electric Bus / Coaches Market Summary, By Length (2019, 2029)
Table 10.1 Global Electric Bus / Coaches Market Summary, Glossary
List of Figures included in this report
Figure 3.1: Global Electric Bus / Coaches Market forecast 2019–2029 (US$ Mn, AGR %)
Figure 4.1: Global Electric Bus / Coaches Market AGR forecast by Technology 2019-2029 (AGR %)
Figure 4.2: Global Electric Bus / Coaches Submarket forecast by Technology 2019-2029 (Revenue US$Mn)
Figure 4.3: Global Electric Bus / Coaches Market Share forecast by Technology 2019 (% Share)
Figure 4.4: Global Electric Bus / Coaches Market Share Forecast by Technology 2024 (% Share)
Figure 4.5: Global Electric Bus / Coaches Submarket Share forecast by Technology 2029 (% Share)
Figure 4.6: Global Electric Bus / Coaches Market forecast 2019–2029 (US$ Mn), By Full Battery Operated Segment
Figure 4.7: Global Electric Bus / Coaches Market forecast 2019–2029 (US$ Mn), By Hybrid Model Segment
Figure 4.8: Global Electric Bus / Coaches Market forecast 2019–2029 (US$ Mn), By Fuel Cell Operated Segment
Figure 5.1: Global Electric Bus / Coaches Market AGR forecast by Length 2019-2029 (AGR %)
Figure 5.2: Global Electric Bus / Coaches Submarket forecast by Length 2019-2029 (Revenue US$Mn)
Figure 5.3: Global Electric Bus / Coaches Market Share forecast by Length 2019 (% Share)
Figure 5.4 Global Electric Bus / Coaches Market Share forecast by Length 2024 (% Share)
Figure 5.5: Global Electric Bus / Coaches Submarket Share forecast by Length 2029 (% Share)
Figure 5.6: Global Electric Bus / Coaches Market forecast 2019–2029 (US$ Mn), By Below 8 Metre Segment
Figure 5.7: Global Electric Bus / Coaches Market forecast 2019–2029 (US$ Mn), By 8-12 Metre Segment
Figure 5.8: Global Electric Bus / Coaches Market forecast 2019–2029 (US$ Mn), By Above 12 Metre Segment
Figure 6.1: Global Electric Bus / Coaches Market forecast by Geography 2019-2029
Figure 6.2: Global Electric Bus / Coaches Market AGR forecast by Geography 2019-2029 (AGR %)
Figure 6.3: Global Electric Bus / Coaches Market Share forecast by Geography 2019 (% Share)
Figure 6.4: Global Electric Bus / Coaches Market Share forecast by Geography 2029 (% Share)
Figure 6.5: America Electric Bus / Coaches Market Forecast, By Technology, 2019-2029 (Revenue US$Mn)
Figure 6.6: America Electric Bus / Coaches Market Share, By Technology, 2019 (% Share)
Figure 6.7: America Electric Bus / Coaches Market Share, By Technology, 2029 (% Share)
Figure 6.8: America Electric Bus / Coaches Market forecast, By Length, 2019-2029 (Revenue US$Mn)
Figure 6.9: America Electric Bus / Coaches Market Share, By Length, 2019 (% Share)
Figure 6.10: America Electric Bus / Coaches Market Share, By Length, 2029 (% Share)
Figure 6.11: America Electric Bus / Coaches Market Forecast, By Country, 2019-2029 (Revenue US$Mn)
Figure 6.12: America Electric Bus / Coaches Market Share, By Country, 2019 (% Share)
Figure 6.13: America Electric Bus / Coaches Market Share, By Country, 2029 (% Share)
Figure 6.14: U.S. Electric Bus / Coaches Market forecast 2019–2029 (US$ Mn)
Figure 6.15: Canada Electric Bus / Coaches Market forecast 2019–2029 (US$ Mn)
Figure 6.16: Mexico Electric Bus / Coaches Market forecast 2019–2029 (US$ Mn)
Figure 6.17: Brazil Electric Bus / Coaches Market forecast 2019–2029 (US$ Mn)
Figure 6.18: Rest of America Electric Bus / Coaches Market forecast 2019–2029 (US$ Mn)
Figure 6.19: Europe Electric Bus / Coaches Market Forecast, By Technology, 2019-2029 (Revenue US$Mn)
Figure 6.20: Europe Electric Bus / Coaches Market Share, By Technology, 2019 (% Share)
Figure 6.21: Europe Electric Bus / Coaches Market Share, By Technology, 2029 (% Share)
Figure 6.22: Europe Electric Bus / Coaches Market forecast, By Length, 2019-2029 (Revenue US$Mn)
Figure 6.23: Europe Electric Bus / Coaches Market Share, By Length, 2019 (% Share)
Figure 6.24: Europe Electric Bus / Coaches Market Share, By Length, 2029 (% Share)
Figure 6.25: Europe Electric Bus / Coaches Market Forecast, By Country, 2019-2029 (Revenue US$Mn)
Figure 6.26: Europe Electric Bus / Coaches Market Share, By Country, 2019 (% Share)
Figure 6.27: Europe Electric Bus / Coaches Market Share, By Country, 2029 (% Share)
Figure 6.28: UK Electric Bus / Coaches Market forecast 2019–2029 (US$ Mn)
Figure 6.29: Germany Electric Bus / Coaches Market forecast 2019–2029 (US$ Mn)
Figure 6.30: Netherlands Electric Bus / Coaches Market forecast 2019–2029 (US$ Mn)
Figure 6.31: Poland Electric Bus / Coaches Market forecast 2019–2029 (US$ Mn)
Figure 6.32: Rest of Europe Electric Bus / Coaches Market forecast 2019–2029 (US$ Mn)
Figure 6.33: Asia Pacific Electric Bus / Coaches Market Forecast, By Technology, 2019-2029 (Revenue US$Mn)
Figure 6.34: Asia Pacific Electric Bus / Coaches Market Share, By Technology, 2019 (% Share)
Figure 6.35: Asia Pacific Electric Bus / Coaches Market Share, By Technology, 2029 (% Share)
Figure 6.36: Asia Pacific Electric Bus / Coaches Market forecast, By Length, 2019-2029 (Revenue US$Mn)
Figure 6.37: Asia Pacific Electric Bus / Coaches Market Share, By Length, 2019 (% Share)
Figure 6.38: Asia Pacific Electric Bus / Coaches Market Share, By Length, 2029 (% Share)
Figure 6.39: Asia Pacific Electric Bus / Coaches Market Forecast, By Country, 2019-2029 (Revenue US$Mn)
Figure 6.40: Asia Pacific Electric Bus / Coaches Market Share, By Country, 2019 (% Share)
Figure 6.42: Asia Pacific Electric Bus / Coaches Market Share, By Country, 2029 (% Share)
Figure 6.43: China Electric Bus / Coaches Market forecast 2019–2029 (US$ Mn)
Figure 6.44: India Electric Bus / Coaches Market forecast 2019–2029 (US$ Mn)
Figure 6.45: Australia Electric Bus / Coaches Market forecast 2019–2029 (US$ Mn)
Figure 6.46: Rest of Asia Pacific Electric Bus / Coaches Market forecast 2019–2029 (US$ Mn)
Figure 6.47: Middle East and Africa (MEA) Electric Bus / Coaches Market Forecast, By Technology, 2019-2029 (Revenue US$Mn)
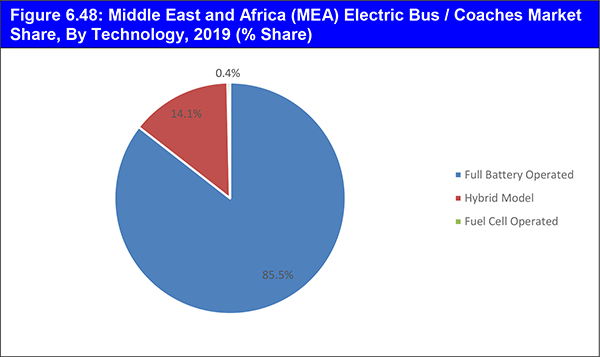
Figure 6.48: Middle East and Africa (MEA) Electric Bus / Coaches Market Share, By Technology, 2019 (% Share)
Figure 6.49: Middle East and Africa (MEA) Electric Bus / Coaches Market Share, By Technology, 2029 (% Share)
Figure 6.50: Middle East and Africa (MEA) Electric Bus / Coaches Market forecast, By Length, 2019-2029 (Revenue US$Mn)
Figure 6.51: Middle East and Africa (MEA) Electric Bus / Coaches Market Share, By Length, 2019 (% Share)
Figure 6.52: Middle East and Africa (MEA) Electric Bus / Coaches Market Share, By Length, 2029 (% Share)
Figure 6.53: Middle East and Africa (MEA) Electric Bus / Coaches Market Forecast, By Country, 2019-2029 (Revenue US$Mn)
Figure 6.54: Middle East and Africa (MEA) Electric Bus / Coaches Market Share, By Country, 2019 (% Share)
Figure 6.55: Middle East and Africa (MEA) Electric Bus / Coaches Market Share, By Country, 2029 (% Share)
Figure 6.56: Saudi Arabia Electric Bus / Coaches Market forecast 2019–2029 (US$ Mn)
Figure 6.57: UAE Electric Bus / Coaches Market forecast 2019–2029 (US$ Mn)
Figure 7.1: BYD Co. Ltd. Revenue (US$ Mn) 2014 - 2018
Figure 7.2: BYD Co. Ltd. Revenue Share by Business Segment, 2017 (%)
Figure 7.3: BYD Co. Ltd. Revenue Share by Region, 2017 (%)
Figure 7.4: Daimler AG Revenue (US$ Mn) 2014 - 2017
Figure 7.5: Daimler AG Revenue Share by Business Segment, 2017 (%)
Figure 7.6: Daimler AG Revenue Share by Region, 2017 (%)
Figure 7.7: NFI Group, Inc. Revenue (US$ Mn) 2014 - 2018
Figure 7.8: NFI Group, Inc. Revenue Share by Business Segment, 2017 (%)
Figure 7.9: NFI Group, Inc. Revenue Share by Region, 2017 (%)
Figure 7.10: Volvo AB Revenue (US$ Mn) 2014 - 2018
Figure 7.11: Volvo AB Revenue Share by Business Segment, 2017 (%)
Figure 7.12: Volvo AB Revenue Share by Region, 2017 (%)
Figure 7.13: Zhengzhou Yutong Bus Co., Ltd. Revenue (US$ Mn) 2014 - 2018
Figure 7.14: Zhengzhou Yutong Bus Co., Ltd. Revenue Share by Business Segment, 2017 (%)
Figure 7.15: Zhengzhou Yutong Bus Co., Ltd. Revenue Share by Region, 2017 (%)
Figure 7.16: Zhongtong Bus & Holding Co., Ltd. Revenue (US$ Mn) 2014 - 2018
Figure 7.17: Zhongtong Bus & Holding Co., Ltd. Revenue Share by Business Segment, 2017 (%)
Figure 7.18: Zhongtong Bus & Holding Co., Ltd. Revenue Share by Region, 2017 (%)
ADL
AESC
Anhui Ankai Automobile Company
Arts Energy
Ashok Leyland
BAE
BMZ
Bollore Group
Bozankaya
Bustech
Carrosserie Hess
Coach Concepts
Coach Design
Coachwork Centra
DCGT
Denning Manufacturing
DesignLine Bus Pacific
Deutche Accumotive GmbH
Ebusco
E-Traction
Evopro
Express Coach Builders
GAZ OAO
Gillig Corporation
Heinzmann Gmbh
Heuliez Bus
Hino Motors
Hoppecke
Hybricon Bus System
Irisbus Iveco
Irizar
Isuzu Motors
Kiwi Bus Builders
Leclanche
LG Chem
Li-Tec
Magna Steyr
MAN Truck & Bus
Marcopolo
Optare
P&D Coachworks
Panasonic
Robert Bosch
Rockwood Lithium Gmbh
Saft
Samsung
Scania AB
Siemens AG
Tata Motors
TOST
Valence
Van Hool
Voith Turbo
Volgren
Vossoloh Kiepe
Xiamen Golden Dragon Bus Co
ZF Friedrichshafen AG
Ziehl-Abegg
Other Organisations Mentioned in This Report
UITP Union Internationale des Transports Publics
NAPT National Association for Pupil Transportation
CBA Califronia Bus Association
EESI Environmental and Energy Study Institute
EDTA Electric Drive Transportation Association
CTA California Transit Association
ACEA European Automobile Manufacturers Association
OICA International Organization of Motor Vehicle Manufacturers
Download sample pages
Complete the form below to download your free sample pages for Electric Bus / Coaches Market Report 2019-2029
Related reports
-
Van Market Outlook Report 2019-2029
The $40bn van market is expected to flourish in the next few years because of Increasing demand for vans especially...
Full DetailsPublished: 13 November 2018 -
Electric Truck Market Report 2019-2029
Are you looking for a definitive report on the emerging $37.2bn electric truck market?
...Full DetailsPublished: 14 January 2019 -
Electric Vehicle Supply Equipment (EVSE) Market Report 2019-2029
Read on to discover how this definitive report can transform your own research and save you time.
...Full DetailsPublished: 31 December 2018 -
Electric Bike Market Report 2019-2029
Battery-powered vehicles are a growing alternative to traditional gasoline, diesel, and alternative fuel. ...Full DetailsPublished: 24 July 2019 -

Battery Electric Vehicle (BEV) Market Report 2019-2029
The increasing need to reduce vehicular emissions, decreasing battery prices, and the introduction of stringent regulations by government bodies, has...Full DetailsPublished: 20 November 2018 -

Power Bank Market Report 2017-2027
Visiongain’s comprehensive new 138 page report reveals that power bank technologies will achieve revenues of $15.1bn in 2017.
...Full DetailsPublished: 07 February 2017 -
Commercial Vehicle Telematics Market Report 2018-2028
The latest report from business intelligence provider company name offers comprehensive analysis of the global Commercial Vehicle Telematics market. Visiongain...
Full DetailsPublished: 28 June 2018 -
Second Life Electric Vehicle Battery Market Report 2019-2029
Visiongain evaluates the second-life electric vehicle battery market at $367.2m in 2019.
...Full DetailsPublished: 28 June 2019 -

Top 20 Lithium-Ion Battery Manufacturing Companies 2018
The development of the automotive battery market is important for the automotive sector as batteries serve different automotive applications in...Full DetailsPublished: 09 August 2018 -
Electric Vehicle Supply Equipment (EVSE) Market Report 2018-2028
The growing acceptance and adoption of Battery Electric Vehicles (BEV) & Plug-In Hybrid Electric Vehicles (PHEV) by customers is gradually...
Full DetailsPublished: 23 February 2018
Download sample pages
Complete the form below to download your free sample pages for Electric Bus / Coaches Market Report 2019-2029
Do you have any custom requirements we can help you with?
Any specific country, geo region, market segment or specific company information?
Email us today, we can discuss your needs and see how we can help: jamie.roberts@visiongain.com
Would you like a free report overview of the report of your choice?
If so, please drop an email to Jamie Roberts stating your chosen report title to jamie.roberts@visiongain.com
Visiongain automotive reports are compiled using a broad and rich mixture of both primary and secondary information to produce an overall industry outlook. In order to provide our clients with the best product possible product, we do not rely on any one single source of information. Visiongain analysts reach out to market-leading vendors and automotive industry experts but also review a wealth of financial data and product information from a vast range of sources. To find out more about our reports methodology please email jamie.roberts@visiongain.com
Would you like to get the latest Visiongain automotive reports catalogue?
What are the dynamic growth sectors? where are the regional business opportunities?
Which technologies will prevail and who are the leading companies succeeding in these sectors and why?
If you want definitive answers to business critical questions, discover Visiongain’s full range of business intelligence reports.
If so, please email Jamie Roberts on jamie.roberts@visiongain.com or call her today on +44 207 336 6100
Alliance of Automobile Manufacturers (USA)
Association of Russian Automakers
Audio Video Bridging (AVB)
China Association Of Automoblie Manufacturers
European Association of Automotive Suppliers
European Automobile Manufacturers’ Association
European Council for Automotive Research and Development
Former Society of Automotive Engineers
German Association of the Automotive Industry
International Organization of Motor Vehicle Manufacturers
In-Vehicle Infotainment (IVI)
Italian Association of the Automotive Industry
Japan Automobile Manufacturers Association
One-Pair Ether-Net
Society of Indian Automobile Manufacturers (SIAM)
Society of Motor Manufacturers and Traders
The International Council For Clean Transport
US National Highway Traffic Safety Administration
Don’t Miss Out!
Subscribe to receive the latest Industry news, trending insight and analysis straight to your inbox.Choose your preferences:
Latest Automotive news
Hydrogen Vehicle Market
The global Hydrogen Vehicle market was valued at US$23.34 billion in 2023 and is projected to grow at a CAGR of 22.7% during the forecast period 2024-2034.
17 May 2024
Autonomous Vehicle Market
The global Autonomous Vehicle market was valued at US$35.4 billion in 2023 and is projected to grow at a CAGR of 22.7% during the forecast period 2024-2034.
16 May 2024
Automotive Infotainment Market
The global Automotive Infotainment market is estimated at US$20.2 billion in 2023 and is projected to grow at a CAGR of 6.3% during the forecast period 2024-2034.
14 May 2024
Automotive Cyber Security Market
The global Automotive Cyber Security market was valued at US$2,991.6 million in 2024 and is projected to grow at a CAGR of 19.4% during the forecast period 2024-2034.
13 May 2024
