The growing acceptance and adoption of Battery Electric Vehicles (BEV) & Plug-In Hybrid Electric Vehicles (PHEV) by customers is gradually making electric vehicles viable as a concept and the electrification of the world’s vehicle fleet an inevitability. It remains just a question of time, and for the supporting charging infrastructure to be put in place.
Therefore, the main hurdle is the commensurate roll-out of the charging infrastructure to support this migration to this electric future. The electric vehicle supply equipment (EVSE) infrastructure is vital to the future success of personal mobility and the automotive industry.
Visiongain has assessed that the global EVSE market will reach 4.39 million units in in 2018.
These developments have led Visiongain to publish this timely report. If you want to be part of this growing industry, then read on to discover how you can maximise your investment potential.
Read on to discover how this definitive report can transform your own research and save you time.
Report highlights
• 147 tables, charts, and graphs
• Analysis of key players in Electric Vehicle Supply Equipment (EVSE) technologies
• AeroVironment
• Bosch Automotive Service Solutions Inc
• Chargemaster PLC
• ChargePoint
• Circontrol
• ClipperCreek
• Elektromotive
• FullCharger
• General Electric
• Leviton
• Liberty Plugins
• NRG EVgo
• Schneider Electric
• Siemens
• Tesla Motors
• Global Electric Vehicle Supply Equipment (EVSE) Market Forecast (Units) And Analysis From 2018-2028
• Electric Vehicle Supply Equipment (EVSE) By Charger Type Forecasts And Analysis From 2018-2028 (Units)
• Private Chargers Forecast 2018-2028
• Public (Slow Chargers) Forecast 2018-2028
• Public (Fast Chargers) Forecast 2018-2028
• Regional Electric Vehicle Supply Equipment (EVSE) Market Forecasts From 2018-2028 (Units)
• North America Electric Vehicle Supply Equipment Market 2018-2028 (Units)
• U.S. EVSE Market 2018-2028 Market Forecast
• Rest of North America EVSE Market 2018-2028
• Europe Electric Vehicle Supply Equipment Market 2018-2028 (Units)
• U.K. EVSE Market Forecast 2018-2028
• Germany EVSE Market Forecast 2018-2028
• France EVSE Market Forecast 2018-2028
• Rest of Europe EVSE Market Forecast 2018-2028
• APAC Electric Vehicle Supply Equipment Market 2018-2028 (Units)
• China EVSE Market Forecast 2018-2028
• India EVSE Market Forecast 2018-2028
• Japan EVSE Market Forecast 2018-2028
• Rest of APAC EVSE Market Forecast 2018-2028
• MEA Electric Vehicle Charging Infrastructure Market 2018-2028 (Units)
• UAE EVSE Market Forecast 2018-2028
• South Africa EVSE Market Forecast 2018-2028
• Rest of MEA EVSE Market Forecast 2018-2028
• LATAM Electric Vehicle Supply Equipment Market Forecast 2018-2028 (Units)
• Brazil EVSE Market Forecast 2018-2028
• Rest of LATAM EVSE Market Forecast 2018-2028
• Key Questions Answered
• What does the future hold for the EVSE industry?
• Where should you target your business strategy?
• Which EVSE applications should you focus upon?
• Which disruptive EVSE technologies should you invest in?
• Which companies should you form strategic alliances with?
• Which EVSE company is likely to success and why?
• What business models should you adopt?
• What EVSE industry trends should you be aware of?
• Target Audience
• Electric vehicle supply equipment manufacturers
• Battery electric vehicle manufacturers
• Plug-in hybrid electric vehicles manufacturers
• Private charger manufacturers
• Public charger manufacturers
• Battery suppliers
• Technology providers
• R&D staff
• Engineers
• CEOs
• Heads of strategic development
• Procurement staff,
• Marketing staff
• Market analysts
• Consultants
• Product managers
• Investors
• Banks
• Regulators
• Industry associations
• Governmental departments & agencies
Visiongain is a trading partner with the US Federal Government
CCR Ref number: KD4R6
1. Report Overview
1.1. Electric Vehicle Charging Station Definition and Levels of Charging
1.2. Why You Should Read This Report
1.3. How This Report Delivers
1.4. Key Questions Answered by This Analytical Report Include:
1.5. Who is This Report For?
1.6. Methodology
1.7. Frequently Asked Questions (FAQ)
1.8. Associated Visiongain Reports
1.9. About Visiongain
2. Introduction to Electric Vehicle Supply Equipment
2.1. Safety in Charging Stations
2.2. Standards for EV Charging
2.2.1. Standards for Charging Modes
2.2.2. Car Model and Plug Types Compatibility
2.3. Charging Time
2.4. Installation of Public Charging Stations
2.5. Renewable Energy Charging Station
2.5.1. Solar Power Automotive Recharging Station (SPARC)
2.5.2. Wind Charging Station
2.5.3. E-Transportation Centre (Prototype)
2.6. Inductive Charging
2.6.1. Charging Lanes
2.6.1.1. Online Electric Vehicle (OLEV)
2.7. Vehicle-to-Grid (V2G) Communication
2.8. EV Charging Infrastructure Regulatory Incentive
2.9. EVSE Installation Targets
2.10. Market Definition of the EV Supply Equipment Market
2.11. Segmentation of the EV Supply Equipment Market
2.11.1. Private EVSEs
2.11.2. Public EVSEs
3. Global EV Supply Equipment Market 2018-2028
3.1. Global EV Supply Equipment Market Overview
3.2. Global EV Supply Equipment Market Trends
3.3. Global EV Supply Equipment Market Forecast 2018-2028
3.3.1. Global EVSE 2018-2028 Market Forecast
3.4. Global EVSE Market by Charger Type 2018-2028 Market Forecast
3.4.1. Global Private Chargers Submarket Forecast 2018-2028
3.4.2. Global Public Chargers Submarket Forecast 2018-2028
3.4.2.1. Global Public Fast Chargers Submarket Forecast 2018-2028
3.4.2.2. Global Public Slow Chargers Submarket Forecast 2018-2028
4. North America EV Supply Equipment Market 2018-2028
4.1.1. North America EVSE Market Forecast 2018-2028
4.2. North America EVSE Market Charger Type 2018-2028 Market Forecast
4.2.1. North America Private Chargers Submarket Forecast 2018-2028
4.2.2. North America Public Chargers Submarket Forecast 2018-2028
4.2.2.1. North America Public Fast Chargers Submarket Forecast 2018-2028
4.2.2.2. North America Public Slow Chargers Submarket Forecast 2018-2028
4.3. North America EVSE Market by Country 2018-2028 Market Forecast
4.3.1. U.S. EVSE Market 2018-2028 Market Forecast
4.3.2. Rest of North America EVSE Market 2018-2028 Market Forecast
5. Europe EV Supply Equipment Market
5.1.1. Europe EVSE 2018-2028 Market Forecast
5.2. Europe EVSE Market by Charger Type Market Forecast 2018-2028
5.2.1. Europe Private Chargers Submarket Forecast 2018-2028
5.2.2. Europe Public Chargers Submarket Forecast 2018-2028
5.2.2.1. Europe Public Fast Chargers Submarket Forecast 2018-2028
5.2.2.2. Europe Public Slow Chargers Submarket Forecast 2018-2028
5.2.3. U.K. EVSE Market Forecast 2018-2028
5.2.4. Germany EVSE Market Forecast 2018-2028
5.2.5. France EVSE Market Forecast 2018-2028
5.2.6. Rest of Europe EVSE Market Forecast 2018-2028
6. APAC EV Supply Equipment Market 2018-2028
6.1.1. APAC EVSE Market Forecast 2018-2028
6.2. APAC EVSE Market by Charger Type Market Forecast 2018-2028
6.2.1. APAC Private Chargers Submarket Forecast 2018-2028
6.2.2. APAC Public Chargers Submarket Forecast 2018-2028
6.2.2.1. APAC Public Fast Chargers Submarket Forecast 2018-2028
6.2.2.2. APAC Public Slow Chargers Submarket Forecast 2018-2028
6.3. APAC EVSE Stock by Country Market Forecast 2018-2028
6.3.1. China EVSE Market Forecast 2018-2028
6.3.2. India EVSE Market Forecast 2018-2028
6.3.3. Japan EVSE Market Forecast 2018-2028
6.3.4. Rest of APAC EVSE Market Forecast 2018-2028
7. MEA EV Supply Equipment Market 2018-2028
7.1. MEA EVSE Market Forecast 2018-2028
7.2. MEA EVSE Market by Charger Type Market Forecast 2018-2028
7.2.1. MEA Private Chargers Submarket Forecast 2018-2028
7.2.2. MEA Public Chargers Submarket Forecast 2018-2028
7.2.2.1.MEA Public Fast Chargers Submarket Forecast 2018-2028
7.2.2.2. MEA Public Slow Chargers Submarket Forecast 2018-2028
7.3. MEA EVSE Market by Country Market Forecast 2018-2028
7.3.1.UAE EVSE Market Forecast 2018-2028
7.3.2. South Africa EVSE Market Forecast 2018-2028
7.3.3. Rest of MEA EVSE Market Forecast 2018-2028
8. LATAM EV Supply Equipment Market Forecast 2018-2028
8.1. LATAM EVSE Market Forecast 2018-2028
8.2. LATAM EVSE by Charger Type Market Forecast 2018-2028
8.2.1. LATAM Private Chargers Submarket Forecast 2018-2028
8.2.2. LATAM Public Chargers Submarket Forecast 2018-2028
8.2.2.1. LATAM Public Fast Chargers Submarket Forecast 2018-2028
8.2.2.2. LATAM Public Slow Chargers Submarket Forecast 2018-2028
8.3. LATAM EVSE Market by Country Market Forecast 2018-2028
8.3.1. Brazil EVSE Market Forecast 2018-2028
8.3.2. Rest of LATAM EVSE Market Forecast 2018-2028
9. PESTEL Analysis Fused With Opportunities And Threats Of The Global EV Supply Equipment Market
10. Leading Companies in The EVSE Market
10.1. Liberty Plugins
10.1.1. HYDRA-R Multi-Charger Control System
10.1.2. HYDRA-RX High Power Charger Control System
10.2. Chargemaster PLC
10.2.1. Business Charging Stations
10.2.2. Rapid Charging
10.2.3. Home Charging
10.2.4. Workplace Charging
10.3. ClipperCreek
10.4. NRG EVgo
10.4.1. EVgo Home Charging Solutions
10.4.2. EVgo Workplace Charging Solutions
10.4.3. EVgo Charge Away From Home
10.5. ChargePoint
10.5.1. ChargePoint Home
10.5.2. ChargePoint Smart Charging Stations
10.6. FullCharger
10.6.1. Compact Charging Station
10.6.2. Compact Mini Charging Station
10.6.3. Twin Charging Station
10.6.4. EVe Charging Station
10.6.5. Tube Charging Station
10.6.6. Quick Charging Station
10.7. Elektromotive
10.7.1. Elektrobay Charging Station Range
10.8. Bosch Automotive Service Solutions Inc
10.8.1. Power Xpress
10.8.2. Power Max
10.8.3. Power Max 2 and 2Plus
10.8.4. Power Xpress Bollards
10.8.5. Power DC Plus
10.9. Circontrol
10.9.1. WallBox
10.9.2. Charging Posts
10.9.3. Multipoint
10.9.4. Quick Charge
10.10. Tesla Motors
10.10.1. Tesla Supercharger
10.11. Siemens
10.11.1. VersiCharge and VersiCharge SG Residential Charger
10.12. General Electric
10.12.1. WattStation and DuraStation
10.13. Schneider Electric
10.13.1. Schneider EVLink Family Chargers
10.14. AeroVironment
10.14.1.TurboDock
10.14.2. TurboCord
10.14.3. EVSE RS
10.15. Leviton
10.15.1. Leviton Charging Station Range
10.16. Other Leading Companies in The Electric Vehicle Supply Equipment Market
11. Conclusions
11.1. Charging Infrastructure Market Trends
11.2. Implications
11.2.1. EV OEMs and Suppliers
11.2.2. Charging Infrastructure
11.2.3. Grid
11.2.4. New Business Models
12. Glossary
12.1. Standards
List of Tables
Table 1.1 Electric Vehicle Charging Levels (miles per time charge, connector, description)
Table 1.2 Factors That Drive The Demand Of EV Charging Stations
Table 2.1 Categories of Electric Vehicle Charging
Table 2.2 Electric Vehicle Charging Levels (miles per time charge, connector, description)
Table 2.3 SAE Standards for EV Charging (AC Charging Level, DC Charging Level, Specs)
Table 2.4 Modes of Electric Vehicle Charging
Table 2.5 Connection Cases Associated with the Modes of Electric Vehicle Charging
Table 2.6 Types of Plugs Used for EV Charging
Table 2.7 Car Model Compatibility with Charging Plugs/Cables
Table 2.8 Charging Time Under Different Charging Conditions (kW, V, AC/DC, A, min)
Table 2.9 Utility Charging Stations Actions
Table 2.10 Government Charging Stations Actions
Table 2.11 Automakers Charging Stations Actions
Table 3.1 Global EV Supply Equipment Market Forecast 2018-2028 (Units in millions, AGR%)
Table 3.2 Global EVSE Market Volume Analysis & Forecast (Mn Units, %YoY), 2018-2028
Table 3.3 Global EVSE Market by Charger Type 2018-2028 (private, slow and fast, YoY %)
Table 3.4 Global Private Charger EVSE Market 2018-2028 (Mn units, YoY%)
Table 3.5 Global Public Charger EVSE Market 2018-2028 (Mn units, YoY%)
Table 3.6 Global Public Fast Chargers EVSE Market 2018-2028 (Mn units, YoY%)
Table 3.7 Global Public Slow Charger EVSE Market 2018-2028 (Mn Units, YoY%)
Table 4.1 North America EVSE Market Volume Analysis & Forecast (Mn Units, YoY%), 2018-2028
Table 4.2 North America EVSE Market by Charger Type 2018-2028 (private, slow and fast, , Mn Units, YoY %)
Table 4.3 North America Private EVSE Market 2018-2028 (Mn units, YoY%)
Table 4.4 North America Public EVSE Market 2018-2028 (Mn units, YoY%)
Table 4.5 North America Public Fast Charger EVSE Market 2018-2028 (Mn Units, YoY%)
Table 4.6 North America Public Slow Charger EVSE Market 2018-2028 (Mn units, YoY %)
Table 4.7 U.S. EVSE Market Forecast 2018-2028 (in million units, YoY %)
Table 4.8 Rest of North America EVSE Market Forecast 2018-2028 (in million units, YoY%)
Table 5.1 Europe EVSE Market Volume Analysis & Forecast 2018-2028 (Mn Units, YoY%)
Table 5.2 Europe EVSE Deployment by Charging Type 2018-2028 (private, slow and fast, AGR %)
Table 5.3 Europe Private EVSE Market Forecast 2018-2028 (Mn units, YoY %)
Table 5.4 Europe Public EVSE Market Forecast 2018-2028 (Mn units, YoY %)
Table 5.5 Europe Public Fast Charger EVSE Market 2018-2028 (Mn units, YoY %)
Table 5.6 Europe Public Slow EVSE Market Forecast 2018-2028 (in million units, YoY %)
Table 5.7 U.K. EVSE Market Forecast 2018-2028 (Mn units, YoY%)
Table 5.8 Germany EVSE Market Forecast 2018-2028 (Mn units, YoY %)
Table 5.9 France EVSE Market Forecast 2087-2028 (Mn units, AGR %, CAGR %)
Table 5.10 Rest of Europe EVSE Market Forecast 2018-2028 (Mn units, YoY %)
Table 6.1 APAC EVSE Market Volume Analysis & Forecast 2018-2028 (Mn Units, YoY%)
Table 6.2 APAC EVSE Market by Charger Type 2018-2028 (private, slow and fast, YoY %)
Table 6.3 APAC Private EVSE Market Forecast 2018-2028 (Mn units, YoY %)
Table 6.4 APAC Public EVSE Market Forecast 2018-2028 (Mn units, YoY %)
Table 6.5 APAC Public Fast Charger EVSE Market Forecast 2018-2028 (Mn units, YoY %)
Table 6.6 APAC Public Slow Charger EVSE Market Forecast 2018-2028 (Mn units, YoY %)
Table 6.7 China EVSE Market Forecast 2018-2028 (Mn units, YoY %)
Table 6.8 India EVSE Market Forecast 2018-2028 (Mn units, YoY %)
Table 6.9 Japan EVSE Market Forecast 2018-2028 (Mn units, YoY %)
Table 6.10 Rest of APAC EVSE Market Forecast 2018-2028 (in million units, YoY%)
Table 7.1 MEA EVSE Market Volume Analysis & Forecast 2018-2028 (Mn Units, YoY%)
Table 7.2 MEA EVSE Market by Charger Type Forecast 2018-2028 (private, slow and fast, YoY %)
Table 7.3 MEA Private Charger EVSE Market Forecast 2018-2028 (Mn units, YoY %)
Table 7.4 MEA Public Charger EVSE Market Forecast 2018-2028 (Mn units, YoY %)
Table 7.5 MEA Public Fast Charger EVSE Market Forecast 2018-2028 (Mn units, YoY %)
Table 7.6 MEA Public Slow Charger EVSE Market Forecast 2018-2028 (Mn units, YoY %)
Table 7.7 UAE EVSE Market Forecast 2018-2028 (Mn units, AGR %, CAGR %)
Table 7.8 South Africa EVSE Market Forecast 2018-2028 (Mn units, YoY %)
Table 7.9 Rest of MEA EVSE Market Forecast 2018-2028 (Mn units, YoY %)
Table 8.1 LATAM EVSE Market Volume Analysis & Forecast 2018-2028 (Mn Units, YoY%)
Table 8.2 LATAM EVSE Market Charging Type Forecast 2018-2028 (private, slow and fast, YoY %)
Table 8.3 LATAM Private Charger EVSE Market Forecast 2018-2028 (Mn units, YoY %)
Table 8.4 LATAM Public Charger EVSE Market Forecast 2018-2028 (Mn units, YoY %)
Table 8.5 LATAM Public Fast Charger EVSE Market Forecast 2018-2028 (Mn units, YoY %)
Table 8.6 LATAM Public Slow Charger EVSE Market Forecast 2018-2028 (Mn units, YoY %)
Table 8.7 Brazil EVSE Market Forecast 2018-2028 (Mn units, YoY %)
Table 8.8 Rest of LATAM EVSE Market Forecast 2018-2028 (Mn units, YoY %)
Table 9.1 Global EVSE Market Pestel Analysis
Table 10.1 Level 1 - 120V, 12A+ (1.4kW-2.4kW) Charging, ACS-20
Table 10.2 Level 2 - 240V, 40A+ (9.6kW-19.2kW) Charging, HCS-50
Table 10.3 Level 2 - 240V, 12A-15A (2.8kW-3.6kW) Charging, LCS-20
Table 10.4 Level 2 - 240V, 24A-32A (5.7kW-7.7kW) Charging
Table 10.5 Level 2 EVgo Charger Compared to Standard Outlet
Table 10.7 Chargepoint CT, CPE and CPF Station Families Comparison
Table 10.8 Compact Charger Technical Specification
Table 10.9 Twin Charger Technical Specification
Table 10.10 Tube Charger Technical Specification
Table 10.11 Quick Charging Station Technical Specification
Table 10.12 Elektrobay Charging Stations Range Technical Specification
Table 10.13 Bosch Power Xpress Charging Stations Range Technical Specification
Table 10.14 Bosch Power Max Charging Stations Range Technical Specification
Table 10.15 Bosch Power Max 2 and 2Plus Charging Stations Range Technical Specification
Table 10.16 Bosch Power Xpress Bollards Charging Stations Range Technical Specification
Table 10.17 Bosch Power DC Plus Charging Stations Range Technical Specification
Table 10.18 Circontrol WallBox Range Charging Stations Technical Specifications
Table 10.19 Circontrol Charging Posts Range Charging Stations Technical Specifications
Table 10.20 Circontrol Multipoint Solutions Technical Specifications
Table 10.21 Circontrol Quick Charge Stations Technical Specifications
Table 10.22 VersiCharge and VersiCharge SG (Smart Grid) Technical Specifications
Table 10.23 WattStation and DuraStation Technical Specifications
Table 10.24 EVLink Family Chargers Technical Specifications
Table 10.25 TurboDock Charger Technical Specifications
Table 10.26 TurboCord Charging Time 120V vs 240V by Car Make and Model
Table 10.27 Leviton Charging Station Range Technical Specifications
Table 10.28 Other Leading Companies in Electric Vehicle Supply Equipment Market
List of Figures
Figure 2.1 Modes of Electric Vehicle Charging
Figure 2.2 Types of Plugs Used for EV Charging
Figure 2.3 Distribution Of Charging Stations
Figure 3.1 Global EV Supply Equipment Market Forecast 2087-2028 (Units in millions, AGR%)
Figure 3.2 Global EV Supply Equipment Market Forecast 2018-2028 (Mn Units, YoY%)
Figure 3.3 Global Private Charger EVSE Market 2018-2028 (in million units, YoY %)
Figure 3.4 Global Public Charger EVSE Market 2018-2028 (in million units, AGR %)
Figure 3.5 Global Public Fast Charger EVSE Market 2018-2028 (in million units, YoY %)
Figure 3.6 Global Public Slow Charger EVSE Market 2018-2028 (in million units, YoY %)
Figure 4.1 North America EVSE Market Forecast 2018-2028 (in million units, YoY%)
Figure 4.2 North America Private EVSE market 2018-2028 (in million units, YoY %)
Figure 4.3 North America Public EVSE Market 2018-2028 (in million units, AGR %)
Figure 4.4 North America Public Fast Charger EVSE Market 2018-2028 (in million units, YoY %)
Figure 4.5 North America Public Slow Charger EVSE Market 2018-2028 (in million units, YoY %)
Figure 4.6 U.S. EVSE Market Forecast 2018-2028 (in million units, YoY %)
Figure 4.7 Rest of North America EVSE Market Forecast 2018-2028 (in million units, YoY %)
Figure 5.1 Europe EVSE Market Volume Analysis & Forecast 2018-2028 (in million units, YoY%)
Figure 5.2 Europe Private EVSE Market Forecast 2018-2028 (in million units, YoY %)
Figure 5.3 Europe Public EVSE Market Forecast 2018-2028 (in million units, YoY %)
Figure 5.4 Europe Public Fast Charger EVSE Market 2018-2028 (in million units, AGR %)
Figure 5.5 Europe Public Slow EVSE Market Forecast 2018-2028 (in million units, AGR %)
Figure 5.6 U.K. EVSE Market Forecast 2018-2028 (in million units, AGR %)
Figure 5.7 Germany EVSE Market Forecast 2018-2028 (in million units, AGR %)
Figure 5.8 France EVSE Market Forecast 2018-2028 (in million units, AGR %)
Figure 5.9 Rest of Europe EVSE Market Forecast 2018-2028 (in million units, YoY %)
Figure 6.1 APAC EVSE Market Forecast 2018-2028 (in million units, YoY%)
Figure 6.2 APAC Private EVSE Market Forecast 2018-2028 (in million units, AGR %)
Figure 6.3 APAC Public EVSE Market Forecast 2018-2028 (in million units, AGR %)
Figure 6.4 APAC Public Fast Charger EVSE Market Forecast 2018-2028 (in million units, AGR %)
Figure 6.5 APAC Public Slow Charger EVSE Market Forecast 2018-2028 (in million units, AGR %)
Figure 6.6 China EVSE Market Forecast 2018-2028 (in million units, AGR %)
Figure 6.7 India EVSE Market Forecast 2018-2028 (in million units, AGR %)
Figure 6.8 Japan Pacific EVSE Market Forecast 2018-2028 (in million units, AGR %)
Figure 6.9 Rest of APAC EVSE Market Forecast 2018-2028 (in million units, YoY %)
Figure 7.1 MEA EVSE Market Forecast 2018-2028 (in million units, YoY%)
Figure 7.2 MEA Private Charger EVSE Market Forecast 2018-2028 (in million units, AGR %)
Figure 7.3 MEA Public Charger EVSE Market Forecast 2018-2028 (in million units, AGR %)
Figure 7.4 MEA Public Fast Charger EVSE Market Forecast 2018-2028 (in million units, AGR %)
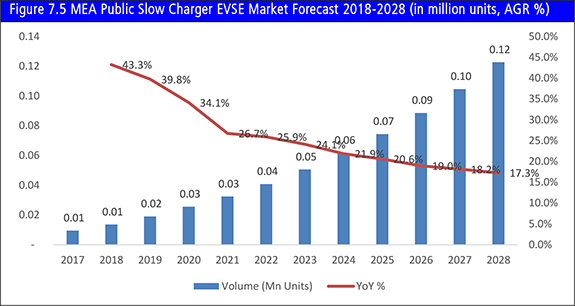
Figure 7.5 MEA Public Slow Charger EVSE Market Forecast 2018-2028 (in million units, AGR %)
Figure 7.6 UAE EVSE Market Forecast 2018-2028 (in million units, AGR %)
Figure 7.7 South Africa EVSE Market Forecast 2018-2028 (in million units, AGR %)
Figure 7.8 Rest of MEA EVSE Market Forecast 2018-2028 (in million units, AGR %)
Figure 8.1 LATAM EVSE Market Forecast 2018-2028 (Units in millions, AGR%)
Figure 8.2 LATAM Private Charger EVSE Market Forecast 2018-2028 (in million units, AGR %)
Figure 8.3 LATAM Public Charger EVSE Market Forecast 2018-2028 (in million units, AGR %)
Figure 8.4 LATAM Public Fast Charger EVSE Market Forecast 2018-2028 (in million units, AGR %)
Figure 8.5 LATAM Public Slow Charger EVSE Market Forecast 2018-2028 (in million units, AGR %)
Figure 8.6 Brazil EVSE Market Forecast 2018-2028 (in million units, AGR %)
Figure 8.7 Rest of LATAM EVSE Market Forecast 2018-2028 (in million units, AGR %)
Figure 10.1 Siemens Revenue Analysis 2015-2017 (US$ Mn)
Figure 10.2 General Electric Revenue Analysis 2015-2017 (US$ Mn)
Figure 10.3 Schneider Electric Revenue Analysis 2014-2016 (US$ Mn)
Figure 10.4 AeroVironment Revenue Analysis 2015-2017 (US$ Mn)

