The latest report from business intelligence provider Visiongain offers comprehensive analysis of the global Automotive Composites market. Visiongain assesses that this market will generate revenues of $15.7 Bn in 2018.
Now: ”BMW look set to limit the use of carbon fibre, turning instead to lightweight steels to keep profits high.” This is an example of the business-critical headline that you need to know about – and more importantly, you need to read Visiongain’s objective analysis of how this will impact your company and the composites industry more broadly. How are you and your company reacting to this news? Are you sufficiently informed?
How this report will benefit you
Read on to discover how you can exploit the future business opportunities emerging in this sector. Visiongain’s new study tells you and tells you NOW.
In this brand-new report, you find 330 tables, charts – all unavailable elsewhere.
The 359-page report provides clear detailed insight into the global Automotive Composites market. Discover the key drivers and challenges affecting the market.
By ordering and reading our brand-new report today you stay better informed and ready to act.
Report Scope
• Global Automotive Composites Market Forecasts From 2018-2028 ($bn Market Value & Volume (KT))
• Automotive Composites Submarket Forecasts By Component 2018-2028 ($bn Market Value)
• Interior Market Forecast 2018-2028
• Body Market Forecast 2018-2028
• Engine & Drivetrain Market Forecast 2018-2028
• Other Market Forecast 2018-2028
• Automotive Composites Submarket Forecasts By Type 2018-2028 ($bn Market Value & Volume (KT))
• Polymer Matrix Composites (PMC) Market Forecast 2018-2028
• Metal Matrix Composites (MMC) Market Forecast 2018-2028
• Ceramic Matrix Composites (CMC) Market Forecast 2018-2028
• Automotive Composites Submarket Forecasts By Type 2018-2028 ($bn Market Value & Volume (KT))
• Carbon Fibre Reinforced Polymer (CFRP) Market Forecast 2018-2028
• Glass Fibre Reinforced Polymer (GFRP) Market Forecast 2018-2028
• Aramid Fibre Reinforced Polymer (AFRP) Market Forecast 2018-2028
• Automotive Composites Submarket Forecasts By Type 2018-2028 ($bn Market Value & Volume (KT))
• Thermoplastic Polymers Market Forecast 2018-2028
• Thermoset Polymers Market Forecast 2018-2028
• Automotive Composites Thermoplastics Submarket Forecasts By Type 2018-2028 ($bn Market Value & Volume (KT))
• PP Market Forecast 2018-2028
• PA Market Forecast 2018-2028
• HPP Market Forecast 2018-2028
• Other Market Forecast 2018-2028
• Automotive Composites Thermoset Submarket Forecasts By Type 2018-2028 ($bn Market Value & Volume (KT))
• Epoxy Market Forecast 2018-2028
• Polyurethane Market Forecast 2018-2028
• Polyester Market Forecast 2018-2028
• Vinyl Ester Market Forecast 2018-2028
• Phenolics Market Forecast 2018-2028
• Automotive Composites Raw Materials Market Forecast 2018-2028 ($bn Market Value)
• Polymer Matrix Composites (PMC) Market Forecast 2018-2028
• Metal Matrix Composites (MMC) Market Forecast 2018-2028
• Ceramic Matrix Composites (CMC) Market Forecast 2018-2028
• Automotive Composites Raw Materials Market Forecast 2018-2028 ($bn Market Value)
• Carbon Fibre Reinforced Polymer (CFRP) Market Forecast 2018-2028
• Glass Fibre Reinforced Polymer (GFRP) Market Forecast 2018-2028
• Aramid Fibre Reinforced Polymer (AFRP) Market Forecast 2018-2028
• Automotive Composites Raw Materials Market Forecast 2018-2028 ($bn Market Value)
• Polymer Matrix Composites (PMC) Market Forecast 2018-2028
• Metal Matrix Composites (MMC) Market Forecast 2018-2028
• Ceramic Matrix Composites (CMC) Market Forecast 2018-2028
• Regional Automotive Composites Market Forecasts From 2018-2028
• America Automotive Composites Market Forecasts 2018-2028
• US Automotive Composites Market Forecast 2018-2028
• Canada Automotive Composites Market Forecast 2018-2028
• Brazil Automotive Composites Market Forecast 2018-2028
• Rest of America Automotive Composites Market Forecast 2018-2028
• Asia-Pacific Automotive Composites Market Forecasts 2018-2028
• Chinese Automotive Composites Market Forecast 2018-2028
• Indian Automotive Composites Market Forecast 2018-2028
• Japanese Automotive Composites Market Forecasts 2018-2028
• South Korean Automotive Composites Market Forecast 2018-2028
• Rest of Asia-Pacific Automotive Composites Market Forecast 2018-2028
• European Automotive Composites Market Forecasts 2018-2028
• UK Automotive Composites Market Forecast 2018-2028
• German Automotive Composites Market Forecast 2018-2028
• French Automotive Composites Market Forecast 2018-2028
• Italian Automotive Composites Market Forecast 2018-2028
• Spanish Automotive Composites Market Forecast 2018-2028
• Russian Automotive Composites Market Forecast 2018-2028
• Netherlands Automotive Composites Market Forecast 2018-2028
• Rest of Europe Automotive Composites Market Forecast 2018-2028
• Rest of the World (RoW) Automotive Composites Market Forecasts 2018-2028
• Analysis Of The Key Factors Driving Growth In The Global, Regional And Country Level Automotive Composites Markets From 2018-2028
• Profiles Of The Leading Automotive OEMs Using Automotive Composites
• BMW AG
• Daimler AG
• Fiat Chrysler Automobiles (FCA)
• Ford Motor Company
• General Motors (GM)
• Hyundai-Kia
• PSA Peugeot-Citroen
• Toyota Motor Corporation
• Volkswagen Group
• Profiles Of The Leading Automotive Composites Companies
• AGY Overview
• Cytec Industries Inc.
• Dow Automotive Systems
• DuPont
• Gurit Holding AG
• Johnson Controls Company
• Saertex
• Scott Bader
• SGL Group
• Teijin (Toho Tenax)
• TenCate
• Toray Industries
Who should read this report?
• Automotive OEMs
• Composites suppliers
• Materials engineers
• Design engineers
• R&D staff
• Technologists
• Market analysts
• Consultants
• Business development managers
• Marketing managers
• Product managers
• Investors
• Banks
• Government agencies
• Industry associations
Visiongain’s study is intended for anyone requiring commercial analyses for the automotive composites market and leading companies. You find data, trends and predictions.
Buy our report today Automotive Composites Market Report 2018-2028: Forecasts & Analysis by Component (Interior, Body, Engine & Drivetrain, Other), by Type of Polymer Matrix Composites (PMC), (Carbon Fibre Reinforced Polymer (CFRP), Glass Fibre Reinforced Polymer (GFRP), Aramid Fibre Reinforced Polymer (AFRP), Metal Matrix Composites (MMC), Ceramic Matrix Composites (CMC), by Thermoplastic Polymers (PP, PA, HPP, Other) & Thermoset Polymers (Epoxy, Polyurethane, Vinyl Ester, Phenolics) Plus Leading Companies. Avoid missing out by staying informed – get our report now.
Visiongain is a trading partner with the US Federal Government
CCR Ref number: KD4R6
1. Report Overview
1.1 Global Automotive Composites Market 2018-2028 Overview
1.2 Why You Should Read This Report
1.3 How This Report Delivers
1.4 Key Questions Answered By This Analytical Report Include
1.5 Who is This Report For?
1.6 Methodology
1.7 Frequently Asked Questions (FAQs)
1.8 Associated Visiongain Reports
1.9 About Visiongain
2. Introduction to the Automotive Composites Market
2.1 Opportunities for the Automotive Composites Market: Light-weighting, Fuel Efficiency, Durability& Emission Reduction
2.1.1 CO2 Emission Regulations in the EU and the US
2.2 Automotive Composites-Applications in High End Vehicles
2.3 Automotive Composites Market Definition
2.3.1 Composite Materials Definition
2.3.2 Global Automotive Composites Market Definition
2.4 Automotive Composites Market Segmentation
2.4.1 Automotive Composites Market Segmentation-By Type of Composite Materials
2.4.2 Automotive Composites Market Segmentation-By Type of Composite Components
3. Global Automotive Composites Market Forecast 2018-2028
3.1 Global Automotive Composites Market Overview
3.1.1 Learn What Drives the Growth of the Automotive Composites Market Between 2016 and 2027
3.1.2 Why the Automotive Composites Market will Grow Faster than the Global Car Market
3.1.3 What is Restraining the Global Automotive Composites Market
3.1.4 Discover the Drivers & Restraints of the Global Automotive Composites Market
3.1.5 The Challenges that the Global Automotive Composites Market Will Face For the Period 2018-2028
3.2 Global Automotive Composites Market Size Forecast 2018-2028 by Composite Materials
3.2.1 Automotive Polymer Matrix Composites (PMC) Submarket Forecast 2018-2028
3.2.2 Automotive Polymer Matrix Composites Submarket Overview 2018-2028
3.2.3 Automotive Metal Matrix Composites (MMC) Submarket Forecast 2018-2028
3.2.4 Automotive Ceramic Matrix Composites (CMC) Submarket Forecast 2018-2028
3.3 Global Automotive Composites Market Revenue Forecast 2018-2028 by Composite Components
3.3.1 Automotive Composite Interior Components Submarket Forecast 2018-2028
3.3.2 Automotive Composite Body Components Submarket Forecast 2018-2028
3.3.3 Automotive Composite Engine & Drivetrain Components Submarket Forecast 2018-2028
3.3.4 Other Automotive Composite Components Submarket Forecast 2018-2028
3.4 Automotive Composites Raw Materials Forecast 2018-202
3.4.1 Global Automotive Composites Raw Materials Market Revenue Forecast 2018-2028 by Composite Materials
3.4.2 Automotive Polymer Matrix Composites (PMC) Raw Materials Submarket Forecast 2018-2028
3.4.3 Automotive Composites Raw Materials Submarket Forecast 2018-2028 Metal Matrix Composites (MMC)
3.4.4 Automotive Ceramic Matrix Composites (CMC) Raw Materials Submarket Forecast 2018-2028
4. Regional & Leading National Automotive Composites Market Forecasts 2018-2028
4.1 Regional and Leading National Automotive Composites Market Forecasts 2018-2028
4.2 Overview of the Rankings of the Leading National Automotive Composites Markets 2018, 2023, 2028
4.3 Leading National Automotive Composites Markets Share Forecasts 2018, 2023, 2028
4.4 Automotive Composites Market-Comparison Between Growth in BRICs and G7 2017, 2022,2027
4.5 Regional Automotive Composites Market Forecasts 2018-2028
4.5.1 Regional Automotive Composites Market Share Forecasts 2018, 2023, 2028
4.6 Regional Automotive Market – Passenger Car Sales by Region Share Forecasts 2018, 2023, 2028
4.6.1 Americas Automotive Composites Market Forecasts 2018-2028
4.6.1.1. Americas Automotive Market Sales - Historical Data and Forecasts 2005-2015
4.6.1.1.1 Overview - Americas Automotive Market Sales– Historical Data and Forecast 2005-2015
4.6.1.2.USA Automotive Composites Market Forecasts 2018-2028
4.6.1.2.1 Overview of the USA Automotive Composites Market 2018-2028
4.6.1.2.2 Drivers & Restraints of the USA Automotive Composites Market
4.6.1.2.3 How Global Fuel Efficiency Requirements Shape the USA Automotive Composites Market
4.6.1.2.4 U.S. Automotive Market - Passenger Car Sales Historical Data 2005-2015 and Forecast 2017-2028
4.6.1.2.5 Overview-U.S. Automotive Market - Passenger Car Sales – Historical Data and Forecast 2017-2028
4.6.1.2.6 Find out Which Two Factors are Putting Pressure on Growth in the US Automotive Composites Market
4.6.1.3 Canadian Automotive Composites Market Forecasts 2018-2028
4.6.1.3.1. Overview of the Canadian Automotive Composites Market 2018-2028
4.6.1.3.2 The Technological Focus of the Canadian Automotive Composites Market
4.6.1.3.3 Canadian Passenger Car Sales – Historical Data 2005-2015 and Forecast for the period 2017-2028
4.6.1.3.4 Overview - Canadian Passenger Car Sales – Historical Data and Forecast for the period 2016-2026
4.6.1.3.5 Drivers & Restraints of the Canadian Automotive Composites Market
4.6.1.4 Brazilian Automotive Composites Market Forecast 2018-2028
4.6.1.4.1 Overview of the Brazilian Automotive Composites Market 2018-2028
4.6.1.4.2 Brazilian Automotive Market - Car Passenger Sales – Historical Data 2005-2015 and Forecast 2017 - 2028
4.6.1.4.3 Overview of Brazilian Car Passenger Sales – Historical Data and Forecast for the period 2016-2026
4.6.1.4.4 Drivers & Restraints of the Brazilian Automotive Composites Market
4.6.1.4.5 How the Economic Climate is Responsible for the Brazilian Automotive Composites Market
4.6.1.4.6 Why Brazil’s Natural Resources are Relevant for More than Just Bio-Fuels
4.6.1.5 Rest of Americas Automotive Composites Market Forecasts 2018-2028
4.6.1.5.1 Overview of the Rest of Americas Automotive Composites Market 2018-2028
4.6.1.5.2 How US Emission Standards Keep Mexican CAGR at Above Average Levels Until 2018
4.6.2 Asia-Pacific Automotive Composites Market Forecasts 2018-2028
4.6.2.1 Asia-Pacific Automotive Market – Passenger Car Sales - Historical Data 2005-2015 and Forecast 2017-2028
4.6.2.1.1 Overview - Asia-Pacific Automotive Market – Passenger Car Sales - Historical Data 2005-2015 and Forecast for the period 2017-2028
4.6.2.2 Chinese Automotive Composites Market Forecasts 2018-2028
4.6.2.2.1 Overview of the Chinese Automotive Composites Market 2018-2028
4.6.2.2.2 Chinese Automotive Market- Passenger Car Sales – Historical Data 2005-2015 and Forecast 2017-2028
4.6.2.2.3 Overview - Chinese Automotive Market- Passenger Car Sales – Historical Data 2005-2015 and Forecast 2017-2028
4.6.2.2.4 Drivers & Restraints of the Chinese Automotive Composites Market 2018-2028
4.6.2.2.5 How Domestic Manufacturers Shape the Chinese Automotive Composites Market
4.6.2.2.6 Potential Chinese Emission Standards
4.6.2.2.7 Why Low Labour Costs will Drive the Chinese Automotive Composites Market
4.6.2.3 Indian Automotive Composites Market Forecasts 2018-2028
4.6.2.3.1 Overview of the Indian Automotive Composites Market 2018-2028
4.6.2.3.2 Indian Automotive Market – Passenger Car Sales – Historical Data 2005-2015 and Forecast for the period 2017-2028
4.6.2.3.3 Overview of Indian Automotive Market – Passenger Car Sales – Historical Data 2005-2015 and Forecast for the period 2016-2026
4.6.2.3.4 Drivers & Restraints of the Indian Automotive Composites Market
4.6.2.3.5 How Economic Growth and a Prosperous Middle Class will Shape the Indian Automotive Composites Market
4.6.2.3.6 Why a Quick Transition to Prosperity is also Restraining the Indian Automotive Composites Market
4.6.2.4 Japanese Automotive Composites Market Forecasts 2018-2028
4.6.2.4.1 Overview of the Japanese Automotive Composites Market 2018-2028
4.6.2.4.2 Japanese Automotive Market – Passenger Car Sales - Historical Data and Forecast for the period 2018-2028
4.6.2.4.3 Overview of Japanese Automotive Market – Passenger Car Sales – Historical Data 2005-2015 and Forecast for the period 2016-2026
4.6.2.4.4 Drivers & Restraints of the Japanese Automotive Composites Market
4.6.2.4.5 The Role of Sustainability, Emission Regulations and Hybrid Cars in the Japanese Automotive Composites Market
4.6.2.4.6 Find Out About Japan’s Domestic CFRP Production
4.6.2.5 South Korean Automotive Composites Market Forecasts 2018-2028
4.6.2.5.1 Overview of the South Korean Automotive Composites Market
4.6.2.5.2 South Korean Automotive Market – Passenger Car Sales – Historical Data 2005-2015 and Forecast for the period 2017-2028
4.6.2.5.3 Overview of South Korean Automotive Market – Passenger Car Sales – Historical Data 2005-2015 and Forecast for the period 2016-2026
4.6.2.5.4 How a Strong Domestic Car Industry will Drive the South Korean Market for Automotive Composites
4.6.2.5.5 Find out Whether Composite Components Can Reverse the Trend of De-Motorisation
4.6.2.5.6 Drivers & Restraints of the South Korean Automotive Composites Market
4.6.2.6 Rest of Asia-Pacific Automotive Composites Market Forecasts 2018-2028
4.6.2.6.1 Overview of the Rest of Asia Pacific Automotive Composites Market
4.6.2.6.2 How Import Taxes can have Negative as well as Positive Effects on the Thai Automotive Composites Market
4.6.2.6.3 Why Suzuki and Toyota are Expanding their Indonesian Operations
4.6.3 European Automotive Composites Market Forecasts 2018-2028
4.6.3.1 European Automotive Market – Passenger Car Sales – Historical Data 2005-2015 and Forecast for the period 2017-2028
4.6.3.1.1 Overview of European Automotive Market – Passenger Car Sales – Historical Data 2005-2015 and Forecast for the period 2016-2026
4.6.3.2 UK Automotive Composites Market Forecasts 2018-2028
4.6.3.2.2 UK Automotive Market – Passenger Car Sales – Historical Data 2005 -2015 and forecast for the period 2017-2028
4.6.3.2.3 Overview of UK Automotive Market – Passenger Car Sales – Historical Data 2005 -2015 and forecast for the period 2016-2026
4.6.3.2.4 Drivers & Restraints of the UK Automotive Composites Market
4.6.3.2.5 How 10.000 Electric Charging Stations will Boost Automotive Composite Usage by 2016
4.6.3.2.6 Supply-Side Factors Affecting the UK Automotive Composites Market
4.6.3.3 German Automotive Composites Market Forecasts 2018-2028
4.6.3.3.2 German Automotive Market – Passenger Car Sales - Historical Data 2005-2015 and Forecast for the period 2017-2028
4.6.3.3.3 Overview of German Automotive Market – Passenger Car Sales - Historical Data 2005-2015 and Forecast for the period 2018-2028
4.6.3.3.4 Drivers & Restraints of the German Automotive Composites Market
4.6.3.3.5 How Economic Recovery will Allow the Annual Growth Rate to Double in Two Years
4.6.3.3.6 Find out about the Role of Joint Ventures in the German Automotive Composites Industry
4.6.3.4 French Automotive Composites Market Forecasts 2018-2028
4.6.3.4.2 French Automotive Market – Passenger Car Sales – Historical Data 2005 2015 and forecast for the period 2017-2028
4.6.3.4.3 Overview of French Automotive Market – Passenger Car Sales – Historical Data 2005 2015 and forecast for the period 2016-2026
4.6.3.4.4 Drivers & Restraints of the French Automotive Composites Market
4.6.3.4.5 Read How the French Car Market and its Car Industry are Affected by the Economic and Euro Zone Crisis
4.6.3.5 Italian Automotive Composites Market Forecasts 2018-2028
4.6.3.5.2 Italian Automotive Market – Passenger Car Sales - Historical Data 2005-2015 and Forecast for the period 2017-2028
4.6.3.5.3 Overview - Italian Automotive Market – Passenger Car Sales - Historical Data 2005-2015 and Forecast for the period 2016-2026
4.6.3.5.4 Drivers & Restraints of the Italian Automotive Composites Market
4.6.3.5.5 How High Fuel Prices can Boost CAGR of the Italian Automotive Composites Market to More than 8% Between 2018-2028
4.6.3.5.6 Find out about the Role of the Supermini Segment in the Italian Automotive Composites Market
4.6.3.6 Spanish Automotive Composites Market Forecasts 2018-2028
4.6.3.6.2 Spanish Automotive Market – Passenger Car Sales – Historical Data 2005-2015 and Forecast for the period 2017-2028
4.6.3.6.3 Overview of Spanish Automotive Market – Passenger Car Sales – Historical Data 2005-2015 and Forecast for the period 2016-2026
4.6.3.6.4 Drivers & Restraints of the Spanish Automotive Composites Market
4.6.3.6.5 New Vehicle Sales at Less than 50% of Pre-Crisis Levels and its Effects on Automotive Composites
4.6.3.7 Russian Automotive Composites Market Forecasts 2018-2028
4.6.3.7.2 Russian Automotive Market – Passenger Car Sales –Historical Data 2005-2015 and Forecast for the period 2017-2028
4.6.3.7.3 Overview – Russian Automotive Market – Passenger Car Sales –Historical Data 2005-2015 and Forecast for the period 2016-2026
4.6.3.7.4 Drivers & Restraints of the Russian Automotive Composites Market
4.6.3.7.5 Read How Imported Cars as well as Government Initiative will Drive the Russian Automotive Composites Market
4.6.3.8 Netherlands Automotive Composites Market Forecasts 2018-2028
4.6.3.8.2 Netherlands Automotive Market – Passenger Car Sales – Historical Data 2005-2015 and Forecast for the period 2017-2028
4.6.3.8.3 Overview of Netherlands Automotive Market – Passenger Car Sales – Historical Data 2005-2015 and Forecast for the period 2016-2026
4.6.3.8.4 Drivers & Restraints of the Netherlands Automotive Composites Market
4.6.3.8.5 How the Small Size of The Netherlands will Benefit Composite Penetration Rates
4.6.3.9 Rest of Europe Automotive Composites Market Forecasts 2018-2028
4.6.3.9.2 Drivers & Restraints of the Rest of Europe Automotive Composites Market
4.6.3.9.3 How European Standardisation of Emission Regulations Can Stimulate the Automotive Composites Market
4.6.3.9.4 How Economic Recovery Will Aid the Automotive Composites Market in Belgium
4.6.4 Rest of The World (RoW) Automotive Composites Market Forecasts 2018-2028
4.6.4.2 Drivers & Restraints of the Rest of World Automotive Composites Market
4.6.4.3 How the Market Share of the RoW will Develop in the Next Ten Years
5. SWOT Analysis of the Automotive Composites Market 2018-2028
5.1 SWOT Analysis for the Automotive Composites Market-By Composite Materials
5.1.1 SWOT Analysis for the Polymer Matrix Composites Submarket 2018-2028
5.1.2 SWOT Analysis for the Metal Matrix Composites Submarket 2018-2028
5.1.3 SWOT Analysis for the Ceramic Matrix Composites Submarket 2018-2028
5.2 SWOT Analysis for the Polymer Matrix Composites Submarket - By Type of Polymer Material
5.2.1 SWOT Analysis for the Carbon Fibre Reinforced Polymer (CFRP) Matrix Composites Submarket 2018-2028
5.2.2 SWOT Analysis for the Glass Fibre Reinforced Polymer (GFRP) Matrix Composites Submarket 2018-2028
5.2.3 SWOT Analysis for the Aramid Fibre Reinforced Polymer (AFRP) Matrix Composites Submarket 2018-2028
5.3 SWOT Analysis for the Polymer Matrix Composites Submarket - By Thermoplastic or Thermosetting Polymer
5.3.1 SWOT Analysis for the Thermoplastic Polymer Matrix Composites Submarket 2018-2028.
5.3.2 SWOT Analysis for the Thermosetting Polymer Matrix Composites Submarket 2018-2028.
5.4 SWOT Analysis of the Automotive Components Market - By Composite Component
5.4.1 SWOT Analysis of the Interior Components Submarket 2018-2028
5.4.2 SWOT Analysis of the Body Components Submarket 2018-2028
5.4.3 SWOT Analysis of the Engine & Drivetrain Components Submarket 2018-2028
5.4.4 SWOT Analysis of the Other Components Submarket 2018-2028
5.5 Barriers to Entry Analysis for the Leading National Automotive Composites Markets 2018-2028
5.5.1 Find Out About The Important Barriers To Entry In High-Growth Markets
5.5.2 Find Out What Is Limiting Opportunities For New Entrants In The BRIC Countries
5.5.3 Which Countries have High Barriers to Entry, Despite High Penetration Rates?
5.5.4 Why European Markets are Interesting for New Entrants
6. Leading Companies in the Automotive Composites Market
6.1 Leading Vehicle Manufacturers in the Automotive Light Passenger Vehicles Market
6.2 BMW AG Overview.
6.2.1 BMW’s Role in the Automotive Composites Market
6.2.2 BMW M&A Activity-SGL Group
6.2.3 Read About BMW’si3, The First Mass-Produced Carbon-Fibre Car.
6.2.4 BMW To Open Autonomous Driving Development Center
6.3 Daimler AG Overview
6.3.1 Daimler’s Role in the Automotive Composites Market
6.3.2 Mercedes-Benz Vans Spends $150 Million In The Production Of The Next Generation Sprinter
6.3.3 Daimler’s Future Outlook
6.4 Fiat Chrysler Automobiles Overview
6.4.1 FCA’s Role in the Automotive Composites Market
6.4.2 FCA’s M&A Activity
6.5 Ford Motor Company Overview
6.5.1 Ford’s Role in the Automotive Composites Market
6.5.2 Ford invests C$500 mn for R&D in Canada
6.5.3 Ford’s Future Outlook
6.6 General Motors (GM)Overview
6.6.1 GM’s Role in the Automotive Composites Market
6.6.2 GM’s Future Outlook
6.7 Hyundai-Kia Overview
6.7.1 Hyundai-Kia’s Role in the Automotive Composites Market
6.7.2 Hyundai-Kia To Rely On Mexico To Achieve 2017 Sales Target
6.7.3 Hyundai-Kia’s Future Outlook
6.8 PSA Peugeot-Citroen Overview
6.8.1 PSA’s Role in the Automotive Composites Market
6.8.2 PSA’s Future Outlook
6.9 Toyota Motor Corporation Overview
6.9.1 Toyota’s Role in the Automotive Composites Market
6.9.2 Toyota Future Outlook
6.10 Volkswagen Group Overview.
6.10.1 Volkswagen’s Role in the Automotive Composites Market
6.10.2 Volkswagen M&A Activity
6.10.3 Volkswagen Future Outlook
6.11 Leading Composite Manufacturers in the Automotive Composites Market
6.12 AGY Overview
6.12.1 AGY’s Role in the Automotive Composites Market
6.13 Cytec Industries Inc. Overview
6.13.1 Cytec’s Role in the Automotive Composites Market
6.13.2 Cytec’s Regional Emphasis
6.14 Dow Automotive Systems Overview
6.14.1 Dow Automotive Systems’ Role in the Automotive Composites Market
6.15 DuPont Overview
6.15.1 DuPont’s Role in the Automotive Composites Market
6.15.2 DuPont’s Financial Situation
6.16 Gurit Holding AG Overview .
6.16.1 Gurit’s Role in the Automotive Composites Market .
6.17 Johnson Controls Company Overview
6.17.1 Johnson Controls’ Role in the Automotive Composites Market
6.18 Saertex Overview
6.18.1 Saertex’s Role in the Automotive Composites Market
6.19 Scott Bader Overview
6.19.1 Scott Bader’s Role in the Automotive Composites Market
6.20 SGL Group Overview
6.20.1 SGL’s Role in the Automotive Composites Market
6.20.2 SGL’s M&A Activity
6.20.3 SGL Group Key Developments in 2016
6.21 Teijin (Toho Tenax) Overview
6.21.1 Teijin’s Role in the Automotive Composites Market
6.21.2 Teijin (Toho Tenax) M&A Activity
6.22 TenCate Overview
6.22.1 TenCate’s Role in the Automotive Composites Market
6.22.2 TenCate M&A and Partnership Activity
6.23 Toray Industries Overview
6.23.1 Toray’s Role in the Automotive Composites Market
6.23.2 Toray’s Future Outlook
6.23.3 Agreements Between Composite Material Suppliers & Auto OEMs
6.24 Other Important Companies in the Automotive Composites Market
7. Drivers and Restraints
7.1 Discover the Drivers and Restraints of the Global Automotive Composites Market
7.2 Important Forces in the Global Automotive Composites Market
8. Glossary
List of Tables
Table 2.1 Automotive Composites Applications-Carbon Fibre in Modern Cars
Table 3.1 Global Automotive Composites Market Revenue Forecast 2018-2028($bn, AGR %, CAGR%)
Table 3.2 Global Automotive Composites Market Volume Forecast 2018-2028(KT, AGR %, CAGR%)
Table 3.3 Global Car Market vs Automotive Composites Market Growth 2018-2028 (AGR%, CAGR%)
Table 3.4 Global Automotive Composites Market Drivers & Restraints
Table 3.5 Global Automotive Composites Market Challenges
Table 3.6 Global Automotive Composites Submarket Revenue Forecast 2018-2028 by Composite Materials ($bn, AGR%)
Table 3.7 Global Automotive Composites Submarket Volume Forecast 2018-2028 by Composite Materials (KT, AGR%)
Table 3.8 Automotive Polymer Matrix Composites Submarket Revenue Forecast 2018-2028 ($bn, AGR%, CAGR%)
Table 3.9 Automotive Polymer Matrix Composites Submarket Volume Forecast 2018-2028 (KT, AGR%, CAGR%)
Table 3.10 Polymer Matrix Composites Submarket Drivers & Restraints
Table 3.11 Automotive Polymer Matrix Composites Submarket Revenue Forecast 2018-2028 ($bn) by Type of Polymer Fibre - AGR Comparison (%)
Table 3.12 Automotive Polymer Matrix Composites Submarket Volume Forecast 2018-2028 (KT) by Type of Polymer Fibre - AGR Comparison (%)
Table 3.13 Automotive Carbon Fibre Reinforced Polymer (CFRP) Submarket Revenue Forecast 2018-2028 ($bn, AGR%, CAGR%)
Table 3.14 Automotive Carbon Fibre Reinforced Polymer (CFRP) Submarket Volume Forecast 2018-2028 (KT, AGR%, CAGR%)
Table 3.15 Carbon Fibre Reinforced Polymer (CFRP)Revenue by Transport Segment 2016 ($bn)
Table 3.16 Automotive Carbon Fibre Reinforced Polymer (CFRP) Submarket Drivers & Restraints
Table 3.17 Automotive Glass Fibre Reinforced Polymer (GFRP) Submarket Revenue Forecast 2018-2028 ($bn, AGR%, CAGR%)
Table 3.18 Automotive Glass Fibre Reinforced Polymer (GFRP) Submarket Volume Forecast 2018-2028 (KT, AGR%)`
Table 3.19 Automotive Glass Fibre Reinforced Polymer (CFRP) Submarket Drivers & Restraints
Table 3.20 Automotive Aramid Fibre Reinforced Polymer (AFRP) Submarket Revenue Forecast 2018-2028 ($bn, AGR%, CAGR%)
Table 3.21 Automotive Aramid Fibre Reinforced Polymer (AFRP) Submarket Volume Forecast 2018-2028 (KT, AGR%, CAGR%)
Table 3.22 Automotive Aramid Fibre Reinforced Polymer (AFRP) Submarket Drivers & Restraints
Table 3.23 Automotive Polymer Matrix Composites Market Revenue Forecast 2018-2028 ($bn) by Thermoplastic or Thermosetting Polymer - AGR Comparison (%)
Table 3.24 Automotive Polymer Matrix Composites Market Volume Forecast 2018-2028 by Thermoplastic or Thermosetting Polymer - AGR Comparison (%)
Table 3.25 Automotive Thermoplastic Polymer Matrix Composites (PMC) Submarket Revenue Forecast 2018-2028 ($bn, AGR%, CAGR%)
Table 3.26 Automotive Thermoplastics Market Revenue and Volume Forecast 2018-2028 by Type (KT, AGR%)
Table 3.27 Breakdown of Thermoplastic PMC and their Automotive Applications
Table 3.28 Automotive Thermoset Polymer Matrix Composites (PMC) Submarket Revenue Forecast 2018-2028 ($bn, KT, AGR%)
Table 3.29 Automotive Thermoset Polymer Matrix Composites (PMC) Submarket Volume Forecast 2018-2028 (KT, AGR%, CAGR%)
Table 3.30 Automotive Thermoset Polymer Matrix Composites (PMC) Submarket Volume Forecast 2018-2028 (KT, AGR%, CAGR%)
Table 3.31 Automotive Thermosets Market Revenue and Volume Forecast 2018-2028 by Type ($bn, AGR%)
Table 3.32 Automotive Metal Matrix Composites Submarket Revenue Forecast 2018-2028 ($bn, AGR%, CAGR%)
Table 3.33 Automotive Metal Matrix Composites Submarket Volume Forecast 2018-2028 (KT, AGR%, CAGR%)
Table 3.34 Automotive Metal Matrix Composites Submarket Drivers & Restraints
Table 3.35 Automotive Ceramic Matrix Composites Submarket Revenue Forecast 2018-2028 ($bn, AGR%, CAGR%)
Table 3.36 Automotive Ceramic Matrix Composites Submarket Volume Forecast 2018-2028 (KT, AGR%, CAGR%)
Table 3.37 Automotive Ceramic Matrix Composites Submarket Drivers & Restraints
Table 3.38 Global Automotive Composites Market Revenue Forecast 2018-2028 by Composite Components ($bn, AGR%)
Table 3.39 Automotive Composites Interior Components Submarket Revenue Forecast 2018-2028 ($bn, AGR%, CAGR%)
Table 3.40 Automotive Composite Interior Components Submarket Drivers & Restraints
Table 3.41 Automotive Composite Body Components Submarket Forecast 2018-2028 ($bn, AGR%, CAGR%)
Table 3.42 Automotive Composites Body Components Submarket Drivers & Restraints
Table 3.43 Automotive Composite Engine & Drivetrain Components Submarket Forecast 2018-2028 ($bn, AGR%, CAGR%)
Table 3.44 Automotive Composite Engine & Drivetrain Components Submarket Drivers & Restraints
Table 3.45 Other Automotive Composite Components Submarket Forecast 2018-2028 ($bn, AGR%, CAGR%)
Table 3.46 Other Automotive Composites Components Submarket Drivers & Restraints
Table 3.47 Global Automotive Composites Raw Materials Market Forecast 2018-2028 by Composite Materials-AGR Comparison (%)
Table 3.48 Automotive Polymer Matrix Composites Raw Materials Submarket Forecast 2018-2028 ($bn, AGR%, CAGR%)
Table 3.49 Automotive Polymer Matrix Composites Raw Materials Market Size Forecast 2018-2028 by Type of Polymer Fibre ($bn, AGR%)
Table 3.50 Automotive Carbon Fibre Reinforced Polymer (CFRP) Raw Materials Submarket Forecast 2018-2028 ($bn, AGR%, CAGR%)
Table 3.51 Automotive Glass Fibre Reinforced Polymer (GFRP) Raw Materials Submarket Forecast 2018-2028 ($bn, AGR%, CAGR%)
Table 3.52 Glass Fibre Reinforced Polymer (GFRP) Raw Materials Submarket European Production Across All Sectors 2010-2014 (Million tonnes, AGR%)
Table 3.53 Automotive Aramid Fibre Reinforced Polymer (AFRP) Raw Materials Submarket Forecast 2018-2028 ($bn, AGR%, CAGR%),
Table 3.54 Automotive Composites Raw Materials Submarket Forecast 2018-2028 ($bn, AGR%, CAGR%)Metal Matrix Composites
Table 3.55 Aluminium Prices 2010-2016 ($ / Tonne, AGR%)
Table 3.56 Crude Oil Market Prices 2010-2016 ($ / Barrel, AGR%)
Table 3.57 Steel Market Prices 2010-2016 ($ / Tonne, AGR%)
Table 3.58 Ceramic Matrix Composites Raw Materials Submarket Forecast 2018-2028 ($bn, AGR%, CAGR%)
Table 4.1 Regional and Leading National Automotive Composites Market Revenue Forecasts 2018-2028 ($bn, AGR%)
Table 4.2 Automotive Composites Market-Comparison Between Growth in BRIC and G7 2017, 2022, 2027 ($bn, CAGR%)
Table 4.3 Regional Automotive Composites Markets Forecasts 2018-2028 ($bn, AGR%)
Table 4.4 Americas Automotive Composites Market Forecasts 2018-2028 ($bn, AGR%, CAGR%)
Table 4.5 Americas Automotive Market Passenger Car Sales Forecast 2015-2026 ($bn, AGR%, CAGR%)
Table 4.6 USA Automotive Composites Market Forecasts 2018-2028 ($bn, AGR%, CAGR%)
Table 4.7 USA Automotive Composites Market Drivers & Restraints
Table 4.8 USA Automotive Market Passenger Car Sales 2005-2015 (Units (mn), AGR%)
Table 4.9 USA Automotive Market Sales – Passenger Car Sales Forecast 2016-2026 (Units (mn), AGR%)
Table 4.10 Canadian Automotive Composites Market Forecasts 2018-2028 ($bn, AGR%, CAGR%)
Table 4.11 Canadian Automotive Market-Car Passenger Sales 2005-2015 (units/mn, AGR%)
Table 4.12 Canadian Automotive Market-Passenger Car Sales Forecast 2016-2026 (units/mn, AGR%, CAGR(%)
Table 4.13 Canadian Automotive Composites Market Drivers & Restraints
Table 4.14 Brazilian Automotive Composites Market Forecasts 2018-2028 ($bn, AGR%, CAGR%)
Table 4.15 Brazilian Automotive Market – Historical data – Passenger Car Sales 2005 – 2015 (millions, AGR(%), CAGR(%))
Table 4.16 Brazilian Automotive Market – Passenger Car Sales Forecast 2016 – 2026 (millions, CAGR (%), AGR(%))
Table 4.17 Brazilian Automotive Composites Market Drivers & Restraints
Table 4.18 Rest of Americas Automotive Composites Market Forecasts 2018-2028 ($bn, AGR%, CAGR%)
Table 4.19 Asia-Pacific Automotive Composites Market Forecasts 2018-2028 ($bn, AGR%, CAGR%)
Table 4.20 Asia-Pacific Automotive Market – Passenger Car Sales- Historical Data - 2005-2015(millions, AGR%, CAGR%)
Table 4.21 Asia-Pacific Automotive Market – Passenger Car Sales- Forecast for the period 2016-2026 (millions, AGR%, CAGR (%))
Table 4.22 Chinese Automotive Composites Market Forecasts 2018-2028($bn, AGR%, CAGR%)
Table 4.23 Chinese Automotive Market - Passenger Car Sales 2005-2015(Units(mn), AGR(%), CAGR (%))
Table 4.24 Chinese Automotive Market – Passenger Car Sales- Forecast for the period 2016-2026 (Units(mn), AGR(%),CAGR (%))
Table 4.25 Chinese Automotive Composites Market Drivers & Restraints
Table 4.26 Indian Automotive Composites Market Forecasts 2018-2028 ($bn, AGR%, CAGR%)
Table 4.27 Indian Automotive Market – Historical Data – Passenger Car Sales – 2005-2015 (Units(mn), AGR(%), CAGR (%))
Table 4.28 Indian Automotive Market – Passenger Car Sales – Forecast for the period 2017-2027 (Units(mn), AGR(%), GARG(%))
Table 4.29 Indian Automotive Composites Market Drivers & Restraints
Table 4.30 Japanese Automotive Composites Market Forecasts 2018-2028 ($bn, AGR%, CAGR%)
Table 4.31 Japanese Automotive Market – Passenger Car Sales- Historical Data 2005-2015 (units (mn), AGR(%), CAGR(%))
Table 4.32 Japanese Automotive Market – Passenger Car Sales- Forecast for the period 2016-2026 (units(mn), AGR(%), CAGR(%))
Table 4.33 Japanese Automotive Composites Market Drivers & Restraints
Table 4.34 South Korean Automotive Composites Market Forecasts 2018-2028($bn, AGR%, CAGR%)
Table 4.35 South Korean Automotive Market – Passenger Car Sales - Historical Data 2005-2015 (units(mn), AGR(%), CAGR(%))
Table 4.36 South Korean Automotive Market – Passenger Car Sales – Forecast for the period 2016-2026 (units(mn), AGR(%), CAGR(%))
Table 4.37 South Korean Automotive Composites Market Drivers & Restraints
Table 4.38 Rest of Asia-Pacific Automotive Composites Market Forecasts 2018-2028 ($bn, AGR%, CAGR%)
Table 4.39 European Automotive Composites Market Forecasts 2018-2028 ($bn, AGR%, CAGR%)
Table 4.40 European Automotive Market – Passenger Car Sales - Historical Data 2005-2015 (units(mn), AGR%, CAGR%)
Table 4.41 European Automotive Market – Passenger Car Sales – Forecast for the period 2016-2026 (units(mn), AGR%, CAGR (%))
Table 4.42 UK Automotive Composites Market Forecasts 2018-2028 ($bn, AGR%, CAGR%)
Table 4.43 UK Automotive Market-Passenger Car Sales – Historical Data 2005-2015(units(mn), AGR%, CAGR(%)
Table 4.44 UK Automotive Market- Passenger Car Sales – Forecast for the period 2016-2026 (units(mn), AGR%, CAGR(%))
Table 4.45 UK Automotive Composites Market Drivers & Restraints
Table 4.46 German Automotive Composites Market Forecasts 2018-2028($bn, AGR%, CAGR%)
Table 4.47 German Automotive Market – Passenger Car Sales – Historical Data 2005-2015 (units(mn), AGR%, CAGR(%))
Table 4.48 German Automotive Market – Passenger Car Sales – Forecast for the period 2016-2026 (units(mn), AGR%, CAGR(%))
Table 4.49 German Automotive Composites Market Drivers & Restraints
Table 4.50 French Automotive Composites Market Forecasts 2018-2028 ($bn, AGR%, CAGR%)
Table 4.51 French Automotive Market – Passenger Car Sales – Historical Data 2005-2015 (units(mn), AGR%, CAGR%)
Table 4.52 French Automotive Market – Passenger Car Sales – Forecast for the period 2016-2026 (units(mn), AGR%, CAGR(%))
Table 4.53 French Automotive Composites Market Drivers & Restraints
Table 4.54 Italian Automotive Composites Market Forecasts 2018-2028($bn, AGR%, CAGR%)
Table 4.55 Italian Automotive Market – Passenger Car Sales - Historical Data 2005-2015 (units(mn), AGR%, CAGR%)
Table 4.56 Italian Automotive Market – Passenger Car Sales – Forecast for the period 2016-2026 (units(mn), AGR%, CAGR(%))
Table 4.57 Italian Automotive Composites Market Drivers & Restraints
Table 4.58 Spanish Automotive Composites Market Forecasts 2018-2028($bn, AGR%, CAGR%)
Table 4.59 Spanish Automotive Market – Passenger Car Sales – Historical Data 2005-2015(Units(mn), AGR%, CAGR%)
Table 4.60 Spanish Automotive Market – Passenger Car Sales – Forecast for the period 2016-2026 (Units(mn), AGR%, CAGR(%))
Table 4.61 Spanish Automotive Composites Market Drivers & Restraints
Table 4.62 Russian Automotive Composites Market Forecasts 2018-2028 ($bn, AGR%, CAGR%)
Table 4.63 Russian Automotive Market – Passenger Car Sales – Historical Data 2005-2015 (Units(mn), AGR%, CAGR(%))
Table 4.64 Russian Automotive Market – Passenger Car Sales – Forecast for the period 2016-2026 (Units(mn), AGR%, CAGR(%)
Table 4.65 Russian Automotive Composites Market Drivers & Restraints
Table 4.66 Netherlands Automotive Composites Market Forecasts 2018-2028($bn, AGR%, CAGR%)
Table 4.67 Netherlands Automotive Market – Passenger Car sales – Historical Data 2005-2015 (Units(mn), AGR%, CAGR(%)
Table 4.68 Netherlands Automotive Market – Passenger Car sales – Forecast for the period 2016-2026 (Units(mn), AGR%, CAGR(%)
Table 4.69 Netherlands Automotive Composites Market Drivers & Restraints
Table 4.70 ROE Automotive Composites Market Forecasts 2018-2028($bn, AGR%, CAGR%)
Table 4.71 ROE Automotive Composites Market Drivers & Restraints
Table 4.72 ROW Automotive Composites Market Forecast 2018-2028 ($bn, AGR%, CAGR%)
Table 4.73 ROW Automotive Composites Market Drivers & Restraints
Table 5.1 SWOT Analysis of the Polymer Matrix Composites...
Table 5.2 SWOT Analysis of the Metal Matrix Composites
Table 5.3 SWOT Analysis of the Ceramic Matrix Composites
Table 5.4 SWOT Analysis of the Carbon Fibre Reinforced Polymer Matrix Composites Submarket 2018-2028
Table 5.5 SWOT Analysis of the Glass Fibre Reinforced Polymer Matrix Composites Submarket 2018-2028
Table 5.6 SWOT Analysis of the Aramid Fibre Reinforced Polymer Matrix Composites Submarket 2018-2028
Table 5.7 SWOT Analysis of the Thermoplastic Polymer Matrix Composites Submarket 2018-2028
Table 5.8 SWOT Analysis of the Thermosetting Polymer Matrix Composites Submarket 2018-2028
Table 5.9 SWOT Analysis of Interior Components
Table 5.10 SWOT Analysis of the Body Components Submarket 2018-2028
Table 5.11 SWOT Analysis of the Engine & Drivetrain
Table 5.12 SWOT Analysis of the Other Components
Table 6.1 BMW Overview 2016 (Revenue, Cars Sold, HQ, Global Car Sales Market Share, Car Production, No of Employees, Ticker, Contact, Website)
Table 6.2 Daimler Overview 2016 (Revenue, HQ, Market Share, Employees, Ticker, IR, Website)
Table 6.3 Fiat Chrysler Automobiles Overview 2016 (Revenue, HQ, Market Share, No. Employees, FCA Brands, Ticker, Contact, Website)
Table 6.4 Ford Overview 2016 (Revenue, Cars Sold, HQ, Global Car Sales Market Share, Car Production, No of Employees, Ticker, Contact, Website)
Table 6.5 GM Overview 2016 (Revenue, Cars Sold, HQ, Global Car Sales Market Share, Ticker, Contact, Website)
Table 6.6 Hyundai-Kia Company Overview 2016 (Revenue, Cars Sold, HQ, Global Car Sales Market Share, Ticker, Cars Sold, Contact, Website)
Table 6.7 PSA Peugeot-Citroen Company Overview 2016 (Revenue, Cars Sold, HQ, Global Car Sales Market Share, Ticker, Cars Sold, Contact, Website)
Table 6.8 Toyota Company Overview 2016 (Revenue, Cars Sold, HQ, Global Car Sales Market Share, Cars Sold, Ticker, Contact, Website)
Table 6.9 Volkswagen Company Overview 2016 (Revenue, Cars Sold, HQ, Global Car Sales Market Share, Cars Sold, Ticker, Contact, Website)
Table 6.10 AGY Company Overview 2016 (Total Revenue, Applications in the Automotive Composites Market HQ, Ticker, IR Contact, Website)
Table 6.11 Cytec Industries Inc. Company Overview 2016 (Total Revenue, HQ, Ticker, IR Contact, Website)
Table 6.12 Dow Automotive Systems Company Overview 2016 (Revenue, HQ, Ticker, Contact, Website)
Table 6.13 DuPont Company Overview 2015 (Revenue, HQ, Ticker, Contact, Website)
Table 6.14 Gurit Holding AG Company Overview 2016 (Total Revenue, HQ, Ticker, IR Contact, Website)
Table 6.15 Johnson Controls Company Overview 2016 (Total Revenue, HQ, Ticker, IR Contact, Website)
Table 6.16 Saertex Company Overview 2016 (Total Revenue, HQ, Ticker, IR Contact, Website)
Table 6.17 Scott Bader Company Overview 2016 (Total Revenue, HQ, Ticker, IR Contact, Website)
Table 6.18 SGL Group Company Overview 2016 (Total Revenue, HQ, Ticker, IR Contact, Website)
Table 6.19 Teijin Company Overview 2016 (Total Revenue, HQ, Ticker, IR Contact, Website)
Table 6.20 TenCate Company Overview 2016 (Total Revenue, HQ, Ticker, IR Contact, Website)
Table 6.21 Toray Industries Company Overview 2016 (Total Revenue, HQ, Ticker, IR Contact, Website)
Table 6.22 Other Important Automotive Manufacturing Companies in the Automotive Composites Market 2018
Table 6.23 Other Important Material and Parts Manufacturing Companies in the Automotive Composites Market 2018
Table 7.1 Drivers & Restraints of the Global Automotive Composites Market
List of Figures
Figure 2.1 EU CO2 Emissions targets 2015, 2020 & Average Actual emissions (g/km)
Figure 2.2 Global Automotive Composites Market Structure Overview
Figure 2.3 Global Automotive Composites Market Value Breakdown: Composite Raw Materials and Value Added
Figure 2.4 Global Automotive Composites Market Value Breakdown: Composite Raw Materials and Value Added
Figure 2.5 Global Automotive Composites Market by Type of Composite Materials
Figure 2.6 Picture of a Honeycomb structure made of carbon-fibre-reinforced polymer on a BMW i3
Figure 2.7 Picture of AMG Carbon Ceramic Brake Disc
Figure 2.8 Global Automotive Composites Market by Type of Composite Components
Figure 2.9 CFRP and Aramid Fibre interior on Jaguar XJR-15
Figure 2.10 Cut-out of BMW Turbo-Charged Engine
Figure 3.1 Global Automotive Composites Market Revenue Forecast 2018-2028 ($bn, AGR%)
Figure 3.2 Global Automotive Composites Market Volume Forecast 2018-2028(KT, AGR %)
Figure 3.3 Global Passenger Car Sales 2005-16 (mn Units, AGR%)
Figure 3.4 Global Automotive Composites Market Segmentation by Type of Composite Material
Figure 3.5 Global Automotive Composites Submarket Revenue Forecast 2018-2028 by Composite Materials ($bn, AGR%)
Figure 3.6 Global Automotive Composites Submarket Revenue Share Forecast 2018, 2023, 2028 (%) by Composite Materials
Figure 3.7 Global Automotive Composites Submarket Volume Forecast 2018-2028 by Composite Materials (KT, AGR%)
Figure 3.8 Automotive Polymer Matrix Composites Submarket Revenue Forecast 2018-2028 ($bn, AGR%)
Figure 3.9 Automotive Polymer Matrix Composites Submarket Revenue Share Forecast 2018, 2023, 2028 (%)
Figure 3.10 Automotive Polymer Matrix Composites Submarket Volume Forecast 2018-2028 (KT, AGR%)
Figure 3.11 Automotive Polymer Matrix Composites Submarket Volume Forecast 2018, 2023, 2028 (%)
Figure 3.12 Automotive Polymer Matrix Composites (PMC) Submarket Segmentation by Type of Fibre & Resin
Figure 3.13 Automotive Polymer Matrix Composites Submarket Revenue Forecast 2018-2028 by Type of Polymer Fibre ($bn, AGR%)
Figure 3.14 Automotive Polymer Matrix Composites Submarket Revenue Share Forecast 2018, 2023, 2028 (%) by Type of Polymer Fibre
Figure 3.15 Automotive Polymer Matrix Composites Submarket Volume Forecast 2018-2028 by Type of Polymer Fibre (KT)
Figure 3.16 Automotive Polymer Matrix Composites Submarket Volume Share Forecast 2018, 2023, 2028 (%) by Type of Polymer Fibre
Figure 3.17 Automotive Carbon Fibre Reinforced Polymer (CFRP) Submarket Revenue Forecast 2018-2028 ($bn, AGR%)
Figure 3.18 Automotive Carbon Fibre Reinforced Polymer (CFRP)Submarket Volume Forecast 2018-2028 (KT, AGR%)
Figure 3.19 Carbon Fibre Reinforced Polymer (CFRP) Revenue Share by Transport Segment (%)
Figure 3.20 Automotive Glass Fibre Reinforced Polymer (GFRP) Submarket Revenue Forecast 2018-2028 ($bn, AGR%)
Figure 3.21 Automotive Glass Fibre Reinforced Polymer (GFRP) Submarket Volume Forecast 2018-2028 (KT, AGR%)
Figure 3.22 Automotive Aramid Fibre Reinforced Polymer (AFRP) Submarket Revenue Forecast 2018-2028 ($bn, AGR%)
Figure 3.23 Automotive Aramid Fibre Reinforced Polymer (AFRP) Submarket Volume Forecast 2018-2028 (KT, AGR%)
Figure 3.24 Polymer Matrix Composites (PMC) Submarket Segmentation by Thermoplastic or Thermosetting Polymer
Figure 3.25 Automotive Polymer Matrix Composites Market Revenue Forecast 2018-2028 by Thermoplastic or Thermosetting Polymer ($bn, AGR%)
Figure 3.26 Automotive Polymer Matrix Composites Market Revenue Share Forecast 2018, 2023, 2028 (%) by Thermoplastic or Thermosetting Polymer
Figure 3.27 Automotive Polymer Matrix Composites Market Volume Forecast 2018-2028 by Thermoplastic or Thermosetting Polymer (KT, AGR%)
Figure 3.28 Automotive Thermoplastic Polymer Matrix Composites (PMC)Submarket Revenue Forecast 2018-2028 ($bn, AGR%)
Figure 3.29 Automotive Thermoplastic Polymer Matrix Composites (PMC) Submarket Volume Forecast 2018-2028 (KT, AGR%)
Figure 3.30 Automotive Thermoplastic Polymer Matrix Composites (PMC) Submarket Revenue Share Forecast 2018, 2023, 2028 (%)
Figure 3.31 Automotive Thermoset Polymer Matrix Composites (PMC) Submarket Revenue Share Forecast 2018, 2023, 2028 (%)
Figure 3.32 Automotive Thermoset Polymer Matrix Composites (PMC) Submarket Volume Share Forecast 2018, 2023, 2028 (%)
Figure 3.33 Automotive Thermoset Polymer Matrix Composites (PMC) Submarket Revenue Share Forecast 2018, 2023, 2028 (%)
Figure 3.34 Automotive Metal Matrix Composites Submarket Revenue Forecast 2018-2028 ($bn, AGR%)
Figure 3.35 Automotive Metal Matrix Composites Submarket Revenue Share Forecast 2018, 2023, 2028 (%)
Figure 3.36 Automotive Metal Matrix Composites Submarket Volume Share Forecast 2018, 2023, 2028 (%)
Figure 3.37 Automotive Ceramic Matrix Composites Submarket Revenue Forecasts 2018-2028 ($bn, AGR%)
Figure 3.38 Automotive Ceramic Matrix Composites Submarket Revenue Share Forecast 2018, 2023, 2028 (%)
Figure 3.39 Automotive Ceramic Matrix Composites Submarket Volume Share Forecast 2018, 2023, 2028 (%)
Figure 3.40 Global Automotive Composites Market Revenue Share Forecast 2018, 2023, 2028 (%) by Composite Components
Figure 3.41 Automotive Composite Interior Components Submarket Forecast 2018-2028 ($bn, AGR%)
Figure 3.42 Automotive Composite Interior Components Submarket Share Forecast 2018, 2023, 2028 (%)
Figure 3.43 Automotive Composite Body Components Submarket Forecast 2018-2028 ($bn, AGR%)
Figure 3.44 Automotive Composite Engine & Drivetrain Components Submarket Forecast 2018-2028 ($bn, AGR%)
Figure 3.45 Other Automotive Composite Components Submarket Forecast 2018-2028 ($bn, AGR%)
Figure 3.46 Other Automotive Composite Components Submarket Share Forecast 2018, 2023, 2028 (%)
Figure 3.47 Global Automotive Composites Raw Materials Forecast 2018-2028 ($bn, AGR%)
Figure 3.48 Global Automotive Composites Raw Materials Market Size Forecast 2018-2028 by Composite Materials ($bn, AGR%)
Figure 3.49 Global Automotive Composites Raw Materials Market Share Forecast 2018, 2023, 2028 (%) by Composite Materials
Figure 3.50 Automotive Polymer Matrix Composites Raw Materials Submarket Forecast 2018-2028 ($bn, AGR%)
Figure 3.51 Automotive Polymer Matrix Composites Raw Materials Submarket Share Forecast 2018, 2023, 2028 (%)
Figure 3.52 Automotive Polymer Matrix Composites Raw Materials Market Size Forecast 2018-2028 by Type of Polymer Fibre ($bn, AGR%)
Figure 3.53 Automotive Polymer Matrix Composites Raw Materials Market Share Forecast 2018, 2023, 2028 (%) by Type of Polymer Fibre
Figure 3.54 Automotive Carbon Fibre Reinforced Polymer (CFRP) Raw Materials Submarket Forecast 2018-2028 ($bn, AGR%)
Figure 3.55 Automotive Carbon Fibre Reinforced Polymer (CFRP) Raw Materials Submarket Share Forecast 2018, 2023, 2028 (%)
Figure 3.56 Automotive Glass Fibre Reinforced Polymer (GFRP) Raw Materials Submarket Forecast 2018-2028 ($bn, AGR%)
Figure 3.57 Automotive Glass Fibre Reinforced Polymer (GFRP) Raw Materials Submarket Share Forecast 2018, 2023, 2028 (%)
Figure 3.58 Automotive Aramid Fibre Reinforced Polymer (AFRP) Raw Materials Submarket Forecast 2018-2028 ($bn, AGR%)
Figure 3.59 Automotive Aramid Fibre Reinforced Polymer (AFRP) Raw Materials Submarket Share Forecast 2018, 2023, 2028 (%)
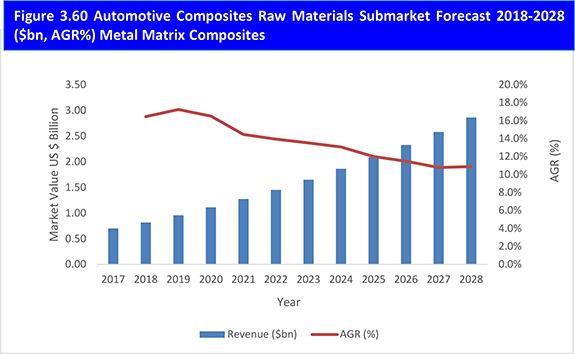
Figure 3.60 Automotive Composites Raw Materials Submarket Forecast 2018-2028 ($bn, AGR%) Metal Matrix Composites
Figure 3.61 Automotive Composites Raw Materials Submarket Share Forecast 2018, 2023, 2028 (%)Metal Matrix Composites
Figure 3.62 Aluminium Prices 2010-2016 ($ / Tonne, AGR%)
Figure 3.63 Automotive Ceramic Matrix Composites Raw Materials Submarket Forecasts 2018-2028 ($bn, AGR%)
Figure 3.64 Automotive Ceramic Matrix Composites Raw Materials Submarket Share Forecast 2018, 2023, 2028 (%)
Figure 4.1 Leading National Automotive Composites Market Forecasts 2018-2028($ bn, AGR%)
Figure 4.2 Leading National Automotive Composites Market Share Forecast 2018 (%)
Figure 4.3 Leading National Automotive Composites Market Share Forecast 2023 (%)
Figure 4.4 Leading National Automotive Composites Market Share Forecast 2028 (%)
Figure 4.5 Automotive Composites Market - BRICs vs. G7 Growth Comparison 2018-2028 bn, AGR%)
Figure 4.6 BRICs vs G7-Comparison By Market Share in The Global Automotive Composites Market 2018, 2023, 2028 (%)
Figure 4.7 Regional Automotive Composites Markets
Figure 4.8 Regional Automotive Composites Markets Share Forecasts 2018(%)
Figure 4.9 Regional Automotive Composites Markets Share Forecasts 2023(%)
Figure 4.10 Regional Automotive Composites Markets Share Forecasts 2028(%)
Figure 4.11 Americas Automotive Composites Market Forecasts 2018-2028($bn, AGR%)
Figure 4.12 Americas Automotive Composites Market Share Forecasts 2018, 2023, 2028(%)
Figure 4.13 Americas Automotive Market – Historical Data Passenger Car Sales 2005-2015 (Units (mn), AGR (%))
Figure 4.14 Americas Automotive Market – Passenger Car Sales Forecast 2016-2026 (Units (mn), AGR (%))
Figure 4.15 USA Automotive Composites Market Forecasts 2018-2028 ($bn, AGR%)
Figure 4.16 USA Automotive Composites Market Share Forecast 2018, 2023, 2028 (%)
Figure 4.17 USA Automotive Market – Passenger Car Sales 2005-2015 (millions, %)
Figure 4.18 US Automotive Market – Passenger Car Sales Forecast 2016-2026 (millions, AGR %)
Figure 4.19 Canadian Automotive Composites Market Forecasts
Figure 4.20 Canadian Automotive Composites Market Share Forecast 2018, 2023, 2028 (%)
Figure 4.21 Canadian Automotive Market- Passenger Car Sales 2005-2015 (units/mn, AGR%)
Figure 4.22 Canadian Automotive Market-Car Passenger Sales 2016-2026 (units/mn, AGR%)
Figure 4.23 Brazilian Automotive Composites Market Forecasts 2018-2028 ($bn, AGR%)
Figure 4.24 Brazilian Automotive Composites Market Share Forecasts 2018, 2023, 2028 (%)
Figure 4.25 Brazilian Automotive Market – Historical data – Passenger Car Sales 2005 – 2015 (millions, AGR (%))
Figure 4.26 Brazilian Automotive Market – Passenger Car Sales Forecast 2016 – 2026 (millions, AGR (%))
Figure 4.27 Rest of Americas Automotive Composites Market Forecasts 2018-2028 ($bn, AGR%)
Figure 4.28 Rest of Americas Automotive Composites Market Share Forecasts 2018, 2023, 2028(%)
Figure 4.29 Asia-Pacific Automotive Composites Market Forecasts 2018-2028 ($bn, AGR%)
Figure 4.30 Asia-Pacific Automotive Composites Market Share Forecasts 2018, 2023, 2028 (%)
Figure 4.31 Asia-Pacific Automotive Market – Passenger Car Sales- Historical Data - 2005-2015(millions, AGR%)
Figure 4.32 Asia-Pacific Automotive Market – Passenger Car Sales- Forecast for the period 2016-2026 (millions, AGR%)
Figure 4.33 Chinese Automotive Composites Market Forecasts 2018-2028($bn, AGR%)
Figure 4.34 Chinese Automotive Composites Market Share Forecasts 2018, 2023, 2028 (%)
Figure 4.35 Chinese Automotive Market - Passenger Car Sales 2005-2015(Units(mn), AGR(%))
Figure 4.36 Chinese Automotive Market – Passenger Car Sales- Forecast for the period 2016-2026 (Units(mn)
Figure 4.37 Indian Automotive Composites Market Forecasts 2018-2028 ($bn, AGR%)
Figure 4.38 Indian Automotive Composites Market Share Forecasts 2018, 2023, 2028 (%)
Figure 4.39 Indian Automotive Market – Historical Data – Passenger Car Sales – 2005-2015 (Units(mn), AGR(%))
Figure 4.40 Indian Automotive Market – Passenger Car Sales – Forecast for the period 2016-2026 (Units(mn), AGR(%))
Figure 4.41 Japanese Automotive Composites Market Forecasts 2018-2028($bn, AGR%)
Figure 4.42 Japanese Automotive Composites Market Share Forecasts 2018, 2023, 2028 (%)
Figure 4.43 Japanese Automotive Market – Passenger Car Sales- Historical Data 2005-2015 (units (mn), AGR(%))
Figure 4.44 Japanese Automotive Market – Passenger Car Sales- Forecast for the period 2016-2026 (units(mn)
Figure 4.45 South Korean Automotive Composites Market Forecasts 2018-2028($bn, AGR%)
Figure 4.46 South Korean Automotive Composites Market Share Forecasts 2018, 2023, 2028 (%)
Figure 4.47 South Korean Automotive Market – Passenger Car Sales - Historical Data 2005-2015 (units(mn), AGR(%))
Figure 4.48 South Korean Automotive Market – Passenger Car Sales – Forecast for the period 2016-2026 (units(mn), AGR(%))
Figure 4.49 Rest of Asia-Pacific Automotive Composites Market Forecasts 2018-2028 ($bn, AGR%)
Figure 4.50 Rest of Asia-Pacific Automotive Composites Market Share Forecasts 2018, 2023, 2028(%)
Figure 4.51 European Automotive Composites Market Forecasts 2018-2028 ($bn, AGR%)
Figure 4.52 European Automotive Composites Market Share Forecasts 2018, 2023, 2028(%)
Figure 4.53 European Automotive Market – Passenger Car Sales - Historical Data 2005-2015 (units(mn), AGR%)
Figure 4.54 European Automotive Market – Passenger Car Sales – Forecast for the period 2016-2026 (units (mn), AGR%)
Figure 4.55 UK Automotive Composites Market Forecasts 2018-2028 ($bn, AGR%)
Figure 4.56 UK Automotive Composites Market Share Forecasts 2018, 2023, 2028 (%)
Figure 4.57 UK Automotive Market-Passenger Car Sales – Historical Data 2005-2015(units(mn), AGR%)
Figure 4.58 UK Automotive Market- Passenger Car Sales – Forecast for the period 2016-2026 (units(mn), AGR%)
Figure 4.59 German Automotive Composites Market Forecasts 2018-2028($bn, AGR%)
Figure 4.60 German Automotive Composites Market Share Forecasts 2018, 2023, 2028 (%)
Figure 4.61 German Automotive Market – Passenger Car Sales – Historical Data 2005-2015 (units(mn), AGR%)
Figure 4.62 German Automotive Market – Passenger Car Sales – Forecast for the period 2016-2026 (units(mn),
Figure 4.63 French Automotive Composites Market Forecasts 2018-2028 ($bn, AGR%)
Figure 4.64 French Automotive Composites Market Share Forecasts 2018, 2023, 2028 (%)
Figure 4.65 French Automotive Market – Passenger Car Sales – Historical Data 2005-2015 (units(mn), AGR%)
Figure 4.66 French Automotive Market – Passenger Car Sales – Forecast for the period 2016-2026 (units(mn), AGR%)
Figure 4.67 Italian Automotive Composites Market Forecasts 2018-2028($bn, AGR%)
Figure 4.68 Italian Automotive Composites Market Share Forecasts 2018, 2023, 2028 (%)
Figure 4.69 Italian Automotive Market – Passenger Car Sales - Historical Data 2005-2015 (units(mn), AGR%)
Figure 4.70 Italian Automotive Market – Passenger Car Sales – Forecast for the period 2016-2026 (units(mn)
Figure 4.71 Spanish Automotive Composites Market Forecasts 2018-2028($bn, AGR%)
Figure 4.72 Spanish Automotive Composites Market Share Forecasts 2018, 2023, 2028 (%)
Figure 4.73 Spanish Automotive Market – Passenger Car Sales – Historical Data 2005-2015(Units(mn), AGR%)
Figure 4.74 Spanish Automotive Market – Passenger Car Sales – Forecast for the period 2016-2026 (Units(mn), AGR%)
Figure 4.75 Russian Automotive Composites Market Forecasts 2018-2028($bn, AGR%)
Figure 4.77 Russian Automotive Market – Passenger Car Sales – Historical Data 2005-2015 (Units(mn), AGR%)
Figure 4.78 Russian Automotive Market – Passenger Car Sales – Forecast for the period 2016-2026 (Units(mn), AGR%)
Figure 4.79 Netherlands Automotive Composites Market Forecasts 2018-2028($bn, AGR%)
Figure 4.80 Netherlands Automotive Composites Market Share Forecasts 2018, 2023, 2028 (%)
Figure 4.81 Netherlands Automotive Market – Passenger Car sales – Historical Data 2005-2015 (Units(mn), AGR%)
Figure 4.82 Netherlands Automotive Market – Passenger Car sales – Forecast for the period 2016-2026 (Units(mn), AGR%)
Figure 4.83 ROE Automotive Composites Market Forecasts 2018-2028($bn, AGR%)
Figure 4.84 ROE Automotive Composites Market Share Forecasts 2018, 2023, 2028 (%)
Figure 4.85 RoW Automotive Composites Market Forecast 2018-2028 ($bn, AGR%)
Figure 4.86 RoW Automotive Composites Market Share Forecasts 2018, 2023, 2028 (%)
Figure 6.1 Market Share of TOP-10 Car Manufacturers in Global Car Sales 2016 (%)
Figure 6.2 BMW Group Car Sales Overview 2013, 2014, 2015, 2016 (millions)