Visiongain has calculated that the global Lithium-Ion Battery Market will see a capital expenditure (CAPEX) of $34,292 mn in 2018. Read on to discover the potential business opportunities available.
Lithium-Ion batteries are secondary batteries as they are rechargeable with longer lifecycle, enhanced storage and efficiency compared to conventional batteries. These advantages have led to increased battery demand subject to numerous applications including energy storage systems, automobiles, household electricity and consumer electronics products.
Lithium-Ion batteries are widely used in various industrial applications including power tools, telecommunications, healthcare and military equipment. The usage of nickel cadmium in power tools and equipment has been replaced with Lithium-Ion batteries due to its ability to reduce exposure to high temperatures.
Fluctuating crude oil prices and rising political instability has led to increased demand for alternative energy sources. The global automotive market is rapidly shifting towards the new generation vehicles such as HEVs, PHEVs and EVs to reduce greenhouse gas emissions and dependency on crude oil. Lithium-Ion battery is the most appropriate technology for the electric vehicles due to its high energy efficiency, long shelf life and reasonable cost.
The Lithium-Ion batteries also have a potential to enhance the efficiency of renewable energy sources such as solar and wind energy. The usage of Li-ion batteries can help store excess electricity during non-peak hours which can be made available during non-production hours. This can increase the technology application in industrial and residential services enabling alleviation of peak-time electricity charges
The growth in the Lithium-Ion battery market is due to rapid industrialization and urbanization as well as increasing demand for consumer electronics and renewable energy adoption.
Visiongain’s global Lithium-Ion Battery Market report can keep you informed and up to date with the developments in the market, across seven different regions: North America, Europe, Middle East/Africa, Asia Pacific, Latin America.
With reference to this report, it details the key investments trend in the global market, subdivided by regions, capital expenditure and equipment. Through extensive secondary research and interviews with industry experts, visiongain has identified a series of market trends that will impact the Lithium-Ion Battery Market over the forecast timeframe.
The report will answer questions such as:
– How is the Lithium-Ion Battery market evolving?
– What is driving and restraining Lithium-Ion Battery market dynamics?
– How will each Lithium-Ion Battery submarket segment grow over the forecast period and how much sales will these submarkets account for in 2028?
– How will market shares of each Lithium-Ion Battery submarket develop from 2018-2028?
– Which individual technologies will prevail and how will these shifts be responded to?
– Which Lithium-Ion Battery submarket will be the main driver of the overall market from 2018-2028?
– How will political and regulatory factors influence regional Lithium-Ion Battery markets and submarkets?
– Will leading national Lithium-Ion Battery market broadly follow macroeconomic dynamics, or will individual country sectors outperform the rest of the economy?
– How will market shares of the national markets change by 2028 and which nation will lead the market in 2028?
– Who are the leading players and what are their prospects over the forecast period?
– How will the sector evolve as alliances form during the period between 2018 and 2028?
Five Reasons Why You Must Order and Read This Report Today:
1) The report provides forecasts for the Lithium-Ion Battery Market by Application, for the period 2018-2028
– Industrial submarket 2018-2028
– Automotive submarket 2018-2028
– Consumer submarket 2018-2028
– Renewable & Grid Energy Storage submarket 2018-2028
2) The report also forecasts and analyses the Lithium-Ion Battery market by Region from 2018-2028
North America
– United States CAPEX 2018-2028
– Canada CAPEX 2018-2028
Asia Pacific
– China CAPEX 2018-2028
– Japan CAPEX 2018-2028
– South Korea CAPEX 2018-2028
– India CAPEX 2018-2028
– Australia CAPEX 2018-2028
– Rest of Asia Pacific CAPEX 2018-2028
Europe
– UK CAPEX 2018-2028
– Italy CAPEX 2018-2028
– Spain CAPEX 2018-2028
– Germany CAPEX 2018-2028
– France CAPEX 2018-2028
– Rest of Europe CAPEX 2018-2028
Middle East/Africa
– Saudi Arabia CAPEX 2018-2028
– UAE CAPEX 2018-2028
– South Africa CAPEX 2018-2028
– Turkey CAPEX 2018-2028
– Rest of the Middle East and Africa CAPEX 2018-2028
South America
– Argentina CAPEX 2018-2028
– Brazil CAPEX 2018-2028
– Mexico CAPEX 2018-2028
– Rest of Latin America CAPEX 2018-2028
3) The report reveals the Drivers and Restraints in the Lithium-Ion Battery Market
4) The report includes SWOT Analysis affecting the Lithium-Ion Battery Market
5) The report provides detailed profiles of the leading companies operating within the Lithium-Ion Battery Market:
– Panasonic Corporation
– Toshiba Corporation
– Johnson Controls
– Samsung SDI Co. Ltd
– LG Chem Ltd
– BYD Co. Ltd
– GS Yuasa Corporation
– Hitachi Ltd
– Automotive Energy Supply Corporation (AESC)
– Electrovaya Inc.
– Philips
– Tesla
– A123 Systems, LLC
– Duracell Inc.
– Saft Batteries
This independent 189-page report guarantees you will remain better informed than your competitors. With 132 tables and figures examining the Lithium-Ion Battery market space, the report gives you a direct, detailed breakdown of the market. PLUS, Capital expenditure by application and region, as well as in-Depth analysis of leading companies in the Lithium-Ion Battery market from 2018-2028 that will keep your knowledge that one step ahead of your rivals.
This report is essential reading for you or anyone in the Energy sector. Purchasing this report today will help you to recognise those important market opportunities and understand the possibilities there. I look forward to receiving your order.
Visiongain is a trading partner with the US Federal Government
CCR Ref number: KD4R6
1. Report Overview
1.1 Global Lithium-Ion Battery Market Overview
1.2 Why You Should Read This Report
1.3 How This Report Delivers
1.4 Key Questions Answered by This Analytical Report Include:
1.5 Who is This Report For?
1.6 Methodology
1.6.1 Primary Research
1.6.2 Secondary Research
1.6.3 Market Evaluation & Forecasting Methodology
1.7 Frequently Asked Questions (FAQ)
1.8 Associated Visiongain Reports
1.9 About Visiongain
2. Introduction to the Lithium-Ion Battery Market
2.1 Lithium-Ion Battery Market Definition
2.2 Lithium-Ion Battery Market Structure
2.3 Brief History of Lithium-Ion Battery
3. Global Lithium-Ion Battery Market 2018-2028
3.1 Global Lithium-Ion Battery Market Forecast 2018-2028
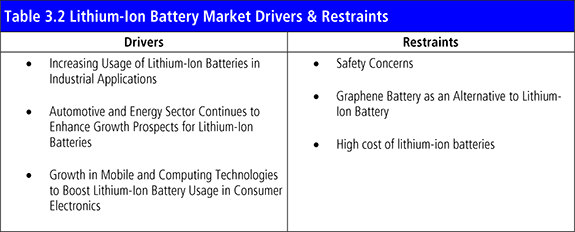
3.2 Lithium-Ion Battery Market Drivers & Restraints 2018
3.2.1 Drivers in the Lithium-Ion Battery Market
3.2.1.1 Automotive and Energy Sector Continues to Enhance Growth Prospects for Lithium-Ion Batteries
3.2.1.2 Growth in Mobile and Computing Technologies to Boost Lithium-Ion Battery Usage in Consumer Electronics
3.2.2 Restraints in the Lithium-Ion Battery Market
3.2.2.1 Safety Concerns
3.2.2.2 Graphene Battery as an Alternative to Lithium-Ion Battery
3.2.2.3 High Cost of Lithium-Ion Battery
4. Global Lithium-Ion Battery Market By Application Forecast 2018-2028
4.1 Global Lithium-Ion Battery Market By Industrial Application Forecast 2018-2028
4.2 Global Lithium-Ion Battery Market By Automotive Application Forecast 2018-2028
4.3 Global Lithium-Ion Battery Market By Consumer Application Forecast 2018-2028
4.4 Global Lithium-Ion Battery Market By Renewable and Grid Energy Storage Application Forecast 2018-2028
5. Leading Regional and National Lithium-Ion Battery Market Forecast 2018-2028
5.1 North America Lithium-Ion Battery Market Forecast 2018-2028
5.1.1 The US Lithium-Ion Battery Market Forecast 2018-2028
5.1.2 Canada Lithium-Ion Battery Market Forecast 2018-2028
5.2 Europe Lithium-Ion Battery Market Forecast 2018-2028
5.2.1 Germany Lithium-Ion Battery Market Forecast 2018-2028
5.2.2 France Lithium-Ion Battery Market Forecast 2018-2028
5.2.3 Italy Lithium-Ion Battery Market Forecast 2018-2028
5.2.4 The UK Lithium-Ion Battery Market Forecast 2018-2028
5.2.5 Spain Lithium-Ion Battery Market Forecast 2018-2028
5.2.6 Rest of Europe Lithium-Ion Battery Market Forecast 2018-2028
5.3 Asia Pacific Lithium-Ion Battery Market Forecast 2017-2027
5.3.1 China Lithium-Ion Battery Market Forecast 2018-2028
5.3.2 Japan Lithium-Ion Battery Market Forecast 2018-2028
5.3.3 South Korea Lithium-Ion Battery Market Forecast 2018-2028
5.3.4 India Lithium-Ion Battery Market Forecast 2018-2028
5.3.5 Australia Lithium-Ion Battery Market Forecast 2018-2028
5.3.6 Rest of Asia Pacific Lithium-Ion Battery Market Forecast 2018-2028
5.4 Middle East and Africa Lithium-Ion Battery Market Forecast 2018-2028
5.4.1 Saudi Arabia Lithium-Ion Battery Market Forecast 2018-2028
5.4.2 UAE Lithium-Ion Battery Market Forecast 2018-2028
5.4.3 South Africa Lithium-Ion Battery Market Forecast 2018-2028
5.4.4 Turkey Lithium-Ion Battery Market Forecast 2018-2028
5.4.5 Rest of the Middle East and Africa Lithium-Ion Battery Market Forecast 2018-2028
5.6 Latin America Lithium-Ion Battery Market Forecast 2018-2028
5.6.1 Argentina Lithium-Ion Battery Market Forecast 2018-2028
5.6.2 Brazil Lithium-Ion Battery Market Forecast 2018-2028
5.6.3 Mexico Lithium-Ion Battery Market Forecast 2018-2028
5.6.4 Rest of Latin America Lithium-Ion Battery Market Forecast 2018-2028
6. SWOT Analysis of the Lithium-Ion Battery Market 2018-2028
6.1 Strengths
6.2 Weaknesses
6.3 Opportunities
6.4 Threats
7. The Leading Companies in the Lithium-Ion Battery Market
7.1 Panasonic Corporation
7.1.1 Panasonic Corporation Total Company Sales 2011-2016
7.1.2 Panasonic Corporation Sales in the Lithium-Ion Battery Market 2013-2016
7.2 Toshiba Corporation
7.2.1 Toshiba Corporation Total Company Sales 2013-2016
7.2.2 Toshiba Corporation Sales in the Lithium-Ion Battery Market 2015-2016
7.3 Johnson Controls
7.4 Samsung SDI Co. Ltd.
7.4.1 Samsung SDI Co. Ltd. Total Company Sales 2011-2016
7.4.2 Samsung SDI Co. Ltd. Sales in the Lithium-Ion Battery Market 2011-2016
7.5 LG Chem Ltd.
7.5.1 LG Chem Ltd. Total Company Sales 2011-2016
7.5.2 LG Chem Ltd. Sales in the Lithium-Ion Battery Market 2012-2016
7.6 BYD Co. Ltd.
7.6.1 BYD Co. Ltd. Total Company Sales 2011-2016
7.6.2 BYD Co. Ltd. Sales in the Lithium-Ion Battery Market 2011-2016
7.7 GS Yuasa Corporation
7.7.1 GS Yuasa Corporation Total Company Sales 2011-2016
7.7.2 GS Yuasa Corporation Sales in the Lithium-Ion Battery Market 2012-2016
7.8 Hitachi Ltd.
7.8.1 Hitachi Ltd. Total Company Sales 2011-2016
7.8.2 Hitachi Ltd. Sales in the Lithium-Ion Battery Market 2011-2016
7.9 Automotive Energy Supply Corporation (AESC)
7.10 Electrovaya Inc.
7.10.1 Electrovaya Inc. Total Company Sales 2011-2017
7.11 Philips
7.11.1 Philips Total Company Sales 2011-2016
7.12 Tesla
7.12.1 Tesla Total Company Sales 2011-2016
7.13 A123 Systems, LLC
7.14 Duracell Inc.
7.15 Saft Batteries
7.16 Other Companies Involved in the Lithium-Ion Battery Market 2017
8. Conclusions and Recommendations
8.1 Key Findings
8.2 Recommendations
9. Glossary
Appendix
Associated Visiongain Reports
Visiongain Report Sales Order Form
Appendix A
Appendix B
Visiongain Report Evaluation Form
List of Tables
Table 1.1 Leading Regional Lithium-Ion Battery Market Forecast 2018-2028 (US$mn, Global AGR %, Cumulative)
Table 1.2 Global Lithium-Ion Battery By Application Forecast 2018-2028 (US$mn, AGR %, CAGR %, Cumulative)
Table 3.1 Global Lithium-Ion Battery Market Forecast 2018-2028 (US$mn, AGR %, CAGR %, Cumulative)
Table 3.2 Lithium-Ion Battery Market Drivers & Restraints
Table 4.1 Global Lithium-Ion Battery Market By Application Forecast 2018-2028 (US$mn, AGR %, Cumulative)
Table 4.2 Global Lithium-Ion Battery Market By Application By Region Forecast 2018-2028 (US$mn, Cumulative, Global AGR %)
Table 4.3 Global Lithium-Ion Battery Market By Application CAGR Forecast 2018-2023, 2023-2028, 2018-2028 (CAGR %)
Table 4.4 Global Lithium-Ion Battery Market By Industrial Application Forecast 2018-2028 (US$mn, AGR %, CAGR %, Cumulative)
Table 4.5 Global Lithium-Ion Battery Market By Industrial Application Regional Market CAGR Forecast 2018-2023, 2023-2028, 2018-2028 (CAGR %)
Table 4.6 Global Lithium-Ion Battery Market By Automotive Application By Region Forecast 2018-2028 (US$mn, AGR %, CAGR %, Cumulative)
Table 4.7 Global Lithium-Ion Battery Market By Automotive Application Regional Market CAGR Forecast 2018-2023, 2023-2028, 2018-2028 (CAGR %)
Table 4.8 Global Lithium-Ion Battery Market By Consumer Application By Region Forecast 2018-2028 (US$mn, AGR %, CAGR %, Cumulative)
Table 4.9 Global Lithium-Ion Battery Market By Consumer Application Regional Market CAGR Forecast 2018-2023, 2023-2028, 2018-2028 (CAGR %)
Table 4.10 Global Lithium-Ion Battery Market By Renewable and Grid Energy Storage Application By Region Forecast 2018-2028 (US$mn, AGR %, CAGR %, Cumulative)
Table 4.11 Global Lithium-Ion Battery Market By Renewable and Grid Energy Storage Application Regional Market CAGR Forecast 2018-2023, 2023-2028, 2018-2028 (CAGR %)
Table 5.1 Leading Regional Lithium-Ion Battery Market Forecast 2018-2028 (US$mn, Global AGR %, Cumulative)
Table 5.2 Regional Lithium-Ion Battery Market Percentage Change in Market Share 2018-2023, 2023-2028, 2018-2028 (% Change)
Table 5.3 North America Lithium-Ion Battery Market by Country Forecast 2018-2028 (US$mn, AGR %, CAGR %, Cumulative)
Table 5.4 The U.S. Lithium-Ion Battery By Application Forecast 2018-2028 (US$mn, AGR %, CAGR %, Cumulative)
Table 5.5 Canada Lithium-Ion Battery By Application Forecast 2018-2028 (US$mn, AGR %, CAGR %, Cumulative)
Table 5.6 Europe Lithium-Ion Battery Market by Country Forecast 2018-2028 (US$mn, AGR %, CAGR %, Cumulative)
Table 5.7 Germany Lithium-Ion Battery Market By Application Forecast 2018-2028 (US$mn, AGR %, CAGR %, Cumulative)
Table 5.8 France Lithium-Ion Battery Market By Application Forecast 2018-2028 (US$mn, AGR %, CAGR %, Cumulative)
Table 5.9 Italy Lithium-Ion Battery Market By Application Forecast 2018-2028 (US$mn, AGR %, CAGR %, Cumulative)
Table 5.10 The UK Lithium-Ion Battery Market By Application Forecast 2018-2028 (US$mn, AGR %, CAGR %, Cumulative)
Table 5.11 Spain Lithium-Ion Battery Market By Application Forecast 2018-2028 (US$mn, AGR %, CAGR %, Cumulative)
Table 5.12 Rest of Europe Lithium-Ion Battery Market By Application Forecast 2018-2028 (US$mn, AGR %, CAGR %, Cumulative)
Table 5.13 Asia Pacific Lithium-Ion Battery Market by Country Forecast 2017-2027 (US$mn, AGR %, CAGR %, Cumulative)
Table 5.14 China Lithium-Ion Battery Market By Application Forecast 2018-2028 (US$mn, AGR %, CAGR %, Cumulative)
Table 5.15 Japan Lithium-Ion Battery Market By Application Forecast 2018-2028 (US$mn, AGR %, CAGR %, Cumulative)
Table 5.16 Korea Lithium-Ion Battery Market By Application Forecast 2018-2028 (US$mn, AGR %, CAGR %, Cumulative)
Table 5.17 India Lithium-Ion Battery Market By Application Forecast 2018-2028 (US$mn, AGR %, CAGR %, Cumulative)
Table 5.18 Australia Lithium-Ion Battery Market By Application Forecast 2018-2028 (US$mn, AGR %, CAGR %, Cumulative)
Table 5.19 Rest of Asia Pacific Lithium-Ion Battery Market By Application Forecast 2018-2028 (US$mn, AGR %, CAGR %, Cumulative)
Table 5.20 Middle East and Africa Lithium-Ion Battery Market by Country Forecast 2017-2027 (US$mn, AGR %, CAGR %, Cumulative)
Table 5.21 Saudi Arabia Lithium-Ion Battery Market By Application Forecast 2018-2028 (US$mn, AGR %, CAGR %, Cumulative)
Table 5.22 UAE Lithium-Ion Battery Market By Application Forecast 2018-2028 (US$mn, AGR %, CAGR %, Cumulative)
Table 5.23 South Africa Lithium-Ion Battery Market By Application Forecast 2018-2028 (US$mn, AGR %, CAGR %, Cumulative)
Table 5.24 Turkey Lithium-Ion Battery Market By Application Forecast 2018-2028 (US$mn, AGR %, CAGR %, Cumulative)
Table 5.25 Rest of the Middle East and Africa Lithium-Ion Battery Market By Application Forecast 2018-2028 (US$mn, AGR %, CAGR %, Cumulative)
Table 5.26 Latin America Lithium-Ion Battery Market by Country Forecast 2018-2028 (US$mn, AGR %, CAGR %, Cumulative)
Table 5.27 Argentina Lithium-Ion Battery Market By Application Forecast 2018-2028 (US$mn, AGR %, CAGR %, Cumulative)
Table 5.28 Brazil Lithium-Ion Battery Market By Application Forecast 2018-2028 (US$mn, AGR %, CAGR %, Cumulative)
Table 5.29 Mexico Lithium-Ion Battery Market By Application Forecast 2018-2028 (US$mn, AGR %, CAGR %, Cumulative)
Table 5.30 Rest of Latin America Lithium-Ion Battery Market By Application Forecast 2018-2028 (US$mn, AGR %, CAGR %, Cumulative)
Table 6.1 Global Lithium-Ion Battery Market SWOT Analysis 2018-2028
Table 7.1 Panasonic Corporation 2017 (CEO, Total Company Sales US$m, Sales from Company Division that includes Lithium-Ion Battery (US$m), Share of Total Company Sales from Company Division that includes Lithium-Ion Battery (%), Net Income / Loss US$m, Net Capital Expenditure US$m, Strongest Business Region, Business Segment in the Market, HQ, Founded, No. of Employees, IR Contact, Ticker, Website)
Table 7.2 Panasonic Corporation Total Company Sales 2010-2016 (US$m, AGR %)
Table 7.3 Panasonic Corporation Sales in the Lithium-Ion Battery Market 2012-2016 (US$m, AGR %)
Table 7.4 Toshiba Corporation 2017 (CEO, Total Company Sales US$m, Sales from Company Division that includes Lithium-Ion Battery (US$m), Share of Total Company Sales from Company Division that includes Lithium-Ion Battery (%), Net Income / Loss US$m, Net Capital Expenditure US$m, Strongest Business Region, Business Segment in the Market, HQ, Founded, No. of Employees, IR Contact, Ticker, Website)
Table 7.5 Toshiba Corporation Total Company Sales 2012-2016 (US$m, AGR %)
Table 7.6 Toshiba Corporation Sales in the Lithium-Ion Battery Market 2015-2016 (US$m, AGR %)
Table 7.7 Johnson Controls 2017 (CEO, Total Company Sales US$m, Sales from Company Division that includes Lithium-Ion Battery (US$m), Share of Total Company Sales from Company Division that includes Lithium-Ion Battery (%), Net Income / Loss US$m, Net Capital Expenditure US$m, Strongest Business Region, Business Segment in the Market, HQ, Founded, No. of Employees, IR Contact, Ticker, Website)
Table 7.8 Johnson Controls Total Company Sales 2013-2017 (US$m, AGR %)
Table 7.9 Johnson Controls Sales in the Lithium-Ion Battery Market 2010-2017 (US$m, AGR %)
Table 7.10 Samsung SDI Co. Ltd. 2017 (CEO, Total Company Sales US$m, Sales from Company Division that includes Lithium-Ion Battery (US$m), Share of Total Company Sales from Company Division that includes Lithium-Ion Battery (%), Net Income / Loss US$m, Net Capital Expenditure US$m, Strongest Business Region, Business Segment in the Market, HQ, Founded, No. of Employees, IR Contact, Ticker, Website)
Table 7.11 Samsung SDI Co. Ltd. Total Company Sales 2010-2016 (US$m, AGR %)
Table 7.12 Samsung SDI Co. Ltd. Sales in the Lithium-Ion Battery Market 2011-2016 (US$m, AGR %)
Table 7.13 LG Chem Ltd. Profile 2017 (CEO, Total Company Sales US$m, Sales from Company Division that includes Lithium-Ion Battery (US$m), Share of Total Company Sales from Company Division that includes Lithium-Ion Battery (%), Net Income / Loss US$m, Net Capital Expenditure US$m, Strongest Business Region, Business Segment in the Market, HQ, Founded, No. of Employees, IR Contact, Ticker, Website)
Table 7.14 LG Chem Ltd. Total Company Sales 2010-2016(US$m, AGR %)
Table 7.15 LG Chem Ltd. Sales in the Lithium-Ion Battery Market 2011-2016 (US$m, AGR %)
Table 7.16 BYD Co. Ltd. 2017 (CEO, Total Company Sales US$m, Sales from Company Division that includes Lithium-Ion Battery (US$m), Share of Total Company Sales from Company Division that includes Lithium-Ion Battery (%), Net Income / Loss US$m, Net Capital Expenditure US$m, Strongest Business Region, Business Segment in the Market, HQ, Founded, No. of Employees, IR Contact, Ticker, Website)
Table 7.17 BYD Co. Ltd. Total Company Sales 2010-2016 (US$m, AGR %)
Table 7.18 BYD Co. Ltd. Sales in the Lithium-Ion Battery Market 2010-2016 (US$m, AGR %)
Table 7.19 GS Yuasa Corporation 2017 (CEO, Total Company Sales US$m, Sales from Company Division that includes Lithium-Ion Battery (US$m), Share of Total Company Sales from Company Division that includes Lithium-Ion Battery (%), Net Income / Loss US$m, Net Capital Expenditure US$m, Strongest Business Region, Business Segment in the Market, HQ, Founded, No. of Employees, IR Contact, Ticker, Website)
Table 7.20 GS Yuasa Corporation Total Company Sales 2010-2016 (US$m, AGR %)
Table 7.21 GS Yuasa Corporation Sales in the Lithium-Ion Battery Market 2011-2016 (US$m, AGR %)
Table 7.22 Hitachi Ltd. 2017 (CEO, Total Company Sales US$m, Sales from Company Division that includes Lithium-Ion Battery (US$m), Share of Total Company Sales from Company Division that includes Lithium-Ion Battery (%), Net Income / Loss US$m, Net Capital Expenditure US$m, Strongest Business Region, Business Segment in the Market, HQ, Founded, No. of Employees, IR Contact, Ticker, Website)
Table 7.23 Hitachi Ltd. Total Company Sales 2010-2016 (US$m, AGR %)
Table 7.24 Hitachi Ltd. Sales in the Lithium-Ion Battery Market 2010-2016 (US$m, AGR %)
Table 7.25 Automotive Energy Supply Corporation (AESC) Profile 2017 (CEO, Total Company Sales US$m, Sales in the Market US$m, Share of Company Sales from Lithium-Ion Battery Market %, Net Income / Loss US$m, Net Capital Expenditure US$m, Strongest Business Region, Business Segment in the Market, HQ, Founded, No. of Employees, IR Contact, Ticker, Website)
Table 7.26 Electrovaya Inc. Profile 2017 (CEO, Total Company Sales US$m, Sales in the Market US$m, Share of Company Sales from Lithium-Ion Battery Market %, Net Income / Loss US$m, Net Capital Expenditure US$m, Strongest Business Region, Business Segment in the Market, HQ, Founded, No. of Employees, IR Contact, Ticker, Website)
Table 7.27 Electrovaya Inc. Total Company Sales 2010-2017 (US$m, AGR %)
Table 7.28 Philips Profile 2017 (CEO, Total Company Sales US$m, Sales in the Market US$m, Share of Company Sales from Lithium-Ion Battery Market %, Net Income / Loss US$m, Net Capital Expenditure US$m, Strongest Business Region, Business Segment in the Market, HQ, Founded, No. of Employees, IR Contact, Ticker, Website)
Table 7.29 Philips Total Company Sales 2010-2016 (US$m, AGR %)
Table 7.30 Tesla Profile 2017 (CEO, Total Company Sales US$m, Sales in the Market US$m, Share of Company Sales from Lithium-Ion Battery Market %, Net Income / Loss US$m, Net Capital Expenditure US$m, Strongest Business Region, Business Segment in the Market, HQ, Founded, No. of Employees, IR Contact, Ticker, Website)
Table 7.31 Tesla Total Company Sales 2010-2016 (US$m, AGR %)
Table 7.32 A123 Systems, LLC Profile 2017 (CEO, Total Company Sales US$m, Sales in the Market US$m, Share of Company Sales from Lithium-Ion Battery Market %, Net Income / Loss US$m, Net Capital Expenditure US$m, Strongest Business Region, Business Segment in the Market, HQ, Founded, No. of Employees, IR Contact, Ticker, Website)
Table 7.33 Duracell Inc. Profile 2017 (CEO, Total Company Sales US$m, Sales in the Market US$m, Share of Company Sales from Lithium-Ion Battery Market %, Net Income / Loss US$m, Net Capital Expenditure US$m, Strongest Business Region, Business Segment in the Market, HQ, Founded, No. of Employees, IR Contact, Ticker, Website)
Table 7.34 Saft Batteries Profile 2017 (CEO, Total Company Sales US$m, Sales in the Market US$m, Share of Company Sales from Lithium-Ion Battery Market %, Net Income / Loss US$m, Net Capital Expenditure US$m, Strongest Business Region, Business Segment in the Market, HQ, Founded, No. of Employees, IR Contact, Ticker, Website)
Table 7.35 Other Companies Involved in the Lithium-Ion Battery Market 2017 (Company, Location)
Table 8.1 Global Lithium-Ion Battery Market By Application Forecast 2018-2028 (US$mn, AGR %, Cumulative)
Table 8.2 Leading Regional Lithium-Ion Battery Market Forecast 2018-2028 (US$mn, Global AGR %, Cumulative)
List of Figures
Figure 2.1 Global Lithium-Ion Battery Market Segmentation Overview
Figure 3.1 Global Lithium-Ion Battery Market Forecast 2018-2028 (US$mn, AGR %)
Figure 4.1 Global Lithium-Ion Battery Market By Application AGR Forecast 2018-2028 (AGR %)
Figure 4.2 Global Lithium-Ion Battery Market By Application Forecast 2018-2028 (US$mn, Global AGR %)
Figure 4.3 Global Lithium-Ion Battery Market By Application Share Forecast 2018 (% Share)
Figure 4.4 Global Lithium-Ion Battery Market By Application Share Forecast 2023 (% Share)
Figure 4.5 Global Lithium-Ion Battery Market By Application Share Forecast 2028 (% Share)
Figure 4.6 Global Lithium-Ion Battery Market By Industrial Application by Region Market AGR Forecast 2018-2028 (AGR %)
Figure 4.7 Global Lithium-Ion Battery Market By Industrial Application by Region Market 2018-2028 (US$mn, Global AGR %)
Figure 4.8 Global Lithium-Ion Battery Market By Industrial Application Market Share by Region Market Forecast 2018 (% Share)
Figure 4.9 Global Lithium-Ion Battery Market By Industrial Application Market Share by Region Market Forecast 2023 (% Share)
Figure 4.10 Global Lithium-Ion Battery Market By Industrial Application Market Share by Region Market Forecast 2028 (% Share)
Figure 4.11 Global Lithium-Ion Battery Market By Automotive Application by Region Market AGR Forecast 2018-2028 (AGR %)
Figure 4.12 Global Lithium-Ion Battery Market By Automotive Application by Region Market 2017-2027 (US$mn, Global AGR %)
Figure 4.13 Global Lithium-Ion Battery Market By Automotive Application Market Share by Region Market Forecast 2018 (% Share)
Figure 4.14 Global Lithium-Ion Battery Market By Automotive Application Market Share by Region Market Forecast 2023 (% Share)
Figure 4.15 Global Lithium-Ion Battery Market By Automotive Application Market Share by Region Market Forecast 2028 (% Share)
Figure 4.16 Global Lithium-Ion Battery Market By Consumer Application by Region Market AGR Forecast 2018-2028 (AGR %)
Figure 4.17 Global Lithium-Ion Battery Market By Consumer Application by Region Market 2018-2028 (US$mn, Global AGR %)
Figure 4.18 Global Lithium-Ion Battery Market By Consumer Application Market Share by Region Market Forecast 2018 (% Share)
Figure 4.19 Global Lithium-Ion Battery Market By Consumer Application Market Share by Region Market Forecast 2023 (% Share)
Figure 4.20 Global Lithium-Ion Battery Market By Consumer Application Market Share by Region Market Forecast 2028 (% Share)
Figure 4.21 Global Lithium-Ion Battery Market By Renewable and Grid Energy Storage Application by Region Market AGR Forecast 2018-2028 (AGR %)
Figure 4.22 Global Lithium-Ion Battery Market By Renewable and Grid Energy Storage Application by Region Market 2018-2028 (US$mn, Global AGR %)
Figure 4.23 Global Lithium-Ion Battery Market By Renewable and Grid Energy Storage Application Market Share by Region Market Forecast 2018 (% Share)
Figure 4.24 Global Lithium-Ion Battery Market By Renewable and Grid Energy Storage Application Market Share by Region Market Forecast 2023 (% Share)
Figure 4.25 Global Lithium-Ion Battery Market By Renewable and Grid Energy Storage Application Market Share by Region Market Forecast 2028 (% Share)
Figure 5.1 Global Lithium-Ion Battery Market by Region Market Forecast 2018-2028 (US$mn, Global AGR %)
Figure 5.2 Global Lithium-Ion Battery Market by Region Market AGR Forecast 2018-2028 (AGR %)
Figure 5.3 Global Lithium-Ion Battery Market by Regional Market Share Forecast 2018 (% Share)
Figure 5.4 Global Lithium-Ion Battery Market by Regional Market Share Forecast 2023 (% Share)
Figure 5.5 Global Lithium-Ion Battery Market by Regional Market Share Forecast 2028 (% Share)
Figure 5.6 North America Lithium-Ion Battery Market by Country AGR Forecast 2017-2027 (AGR %)
Figure 5.7 North America Lithium-Ion Battery by Country Forecast 2018-2028 (US$mn, North America Total Market Sales AGR %)
Figure 5.8 North America Lithium-Ion Battery Market Share by Country Forecast 2018, 2023, 2028 (% Share)
Figure 5.9 The U.S. Lithium-Ion Battery By Application Market Forecast 2018-2028 (US$mn)
Figure 5.10 Canada Lithium-Ion Battery By Application Market Forecast 2018-2028 (US$mn)
Figure 5.11 Europe Lithium-Ion Battery Market by Country AGR Forecast 2018-2028 (AGR %)
Figure 5.12 Europe Lithium-Ion Battery Market by Country Forecast 2018-2028 (US$mn, Europe Total Market Sales AGR %)
Figure 5.13 Europe Lithium-Ion Battery Market Share by Country Forecast 2018, 2023, 2028 (% Share)
Figure 5.14 Germany Lithium-Ion Battery Market By Application Market Forecast 2018-2028 (US$mn)
Figure 5.15 France Lithium-Ion Battery Market By Application Market Forecast 2018-2028 (US$mn)
Figure 5.16 Italy Lithium-Ion Battery Market By Application Market Forecast 2018-2028 (US$mn)
Figure 5.17 The UK Lithium-Ion Battery Market By Application Market Forecast 2018-2028 (US$mn)
Figure 5.18 Spain Lithium-Ion Battery Market By Application Market Forecast 2018-2028 (US$mn)
Figure 5.19 Rest of Europe Lithium-Ion Battery Market By Application Market Forecast 2018-2028 (US$mn)
Figure 5.20 Asia Pacific Lithium-Ion Battery Market by Country AGR Forecast 2018-2028 (AGR %)
Figure 5.21 Asia Pacific Lithium-Ion Battery Market by Country Forecast 2018-2028 (US$mn, Asia Pacific Total Market Sales AGR %)
Figure 5.22 Asia Pacific Lithium-Ion Battery Market Share by Country Forecast 2018, 2023, 2028 (% Share)
Figure 5.23 China Lithium-Ion Battery Market By Application Market Forecast 2018-2028 (US$mn)
Figure 5.24 Japan Lithium-Ion Battery Market By Application Market Forecast 2018-2028 (US$mn)
Figure 5.25 Korea Lithium-Ion Battery Market By Application Market Forecast 2018-2028 (US$mn)
Figure 5.26 India Lithium-Ion Battery Market By Application Market Forecast 2018-2028 (US$mn)
Figure 5.27 Australia Lithium-Ion Battery Market By Application Market Forecast 2018-2028 (US$mn)
Figure 5.28 Rest of Asia Pacific Lithium-Ion Battery Market By Application Market Forecast 2018-2028 (US$mn)
Figure 5.29 Middle East and Africa Lithium-Ion Battery Market by Country AGR Forecast 2018-2028 (AGR %)
Figure 5.30 Middle East and Africa Lithium-Ion Battery Market by Country Forecast 2018-2028 (US$mn, Middle East and Africa Total Market Sales AGR %)
Figure 5.31 Middle East and Africa Lithium-Ion Battery Market Share By Country Forecast 2018, 2023, 2028 (% Share)
Figure 5.32 Saudi Arabia Lithium-Ion Battery Market By Application Market Forecast 2018-2028 (US$mn)
Figure 5.33 UAE Lithium-Ion Battery Market By Application Market Forecast 2018-2028 (US$mn)
Figure 5.34 South Africa Lithium-Ion Battery Market By Application Market Forecast 2018-2028 (US$mn)
Figure 5.35 Turkey Lithium-Ion Battery Market By Application Market Forecast 2018-2028 (US$mn)
Figure 5.36 Rest of the Middle East and Africa Lithium-Ion Battery Market By Application Market Forecast 2018-2028 (US$mn)
Figure 5.37 Latin America Lithium-Ion Battery Market by Country AGR Forecast 2018-2028 (AGR %)
Figure 5.38 Latin America Lithium-Ion Battery Market by Country Forecast 2018-2028 (US$mn, Latin America Total Market Sales AGR %)
Figure 5.39 Latin America Lithium-Ion Battery Market Share by Country Forecast 2018, 2023, 2028 (% Share)
Figure 5.40 Argentina Lithium-Ion Battery Market By Application Market Forecast 2018-2028 (US$mn)
Figure 5.41 Brazil Lithium-Ion Battery Market By Application Market Forecast 2018-2028 (US$mn)
Figure 5.42 Mexico Lithium-Ion Battery Market By Application Market Forecast 2018-2028 (US$mn)
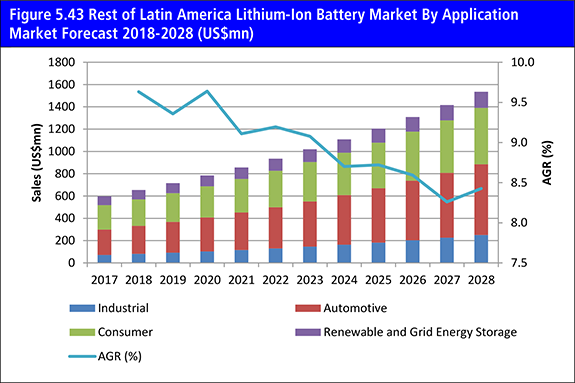
Figure 5.43 Rest of Latin America Lithium-Ion Battery Market By Application Market Forecast 2018-2028 (US$mn)
Figure 7.1 Panasonic Corporation Total Company Sales 2011-2016 (US$m, AGR %)
Figure 7.2 Panasonic Corporation Sales in the Lithium-Ion Battery Market 2013-2016 (US$m, AGR %)
Figure 7.3 Toshiba Corporation Total Company Sales 2013-2016 (US$m, AGR %)
Figure 7.4 Toshiba Corporation Sales in the Lithium-Ion Battery Market 2015-2016 (US$m, AGR %)
Figure 7.5 Johnson Controls Total Company Sales 2014-2017 (US$m, AGR %)
Figure 7.6 Johnson Controls Sales in the Lithium-Ion Battery Market 2011-2017 (US$m, AGR %)
Figure 7.7 Samsung SDI Co. Ltd. Total Company Sales 2011-2016 (US$m, AGR %)
Figure 7.8 Samsung SDI Co. Ltd. Sales in the Lithium-Ion Battery Market 2011-2016 (US$m, AGR %)
Figure 7.9 LG Chem Ltd. Total Company Sales 2011-2016 (US$m, AGR %)
Figure 7.10 LG Chem Ltd. Sales in the Lithium-Ion Battery Market 2012-2016 (US$m, AGR %)
Figure 7.11 BYD Co. Ltd. Company Sales 2011-2016 (US$m, AGR %)
Figure 7.12 BYD Co. Ltd. Sales in the Lithium-Ion Battery Market 2011-2016 (US$m, AGR %)
Figure 7.13 GS Yuasa Corporation Total Company Sales 2011-2016 (US$m, AGR %)
Figure 7.14 GS Yuasa Corporation Sales in the Lithium-Ion Battery Market 2012-2016 (US$m, AGR %)
Figure 7.15 Hitachi Ltd. Company Sales 2011-2016 (US$m, AGR %)
Figure 7.16 Hitachi Ltd. Sales in the Lithium-Ion Battery Market 2011-2016 (US$m, AGR %)
Figure 7.17 Electrovaya Inc. Total Company Sales 2011-2017 (US$m, AGR %)
Figure 7.18 Philips Total Company Sales 2011-2016 (US$m, AGR %)
Figure 7.19 Tesla Total Company Sales 2011-2016 (US$m, AGR %)