Visiongain evaluates the second-life electric vehicle battery market at $367.2m in 2019.
With a large amount of attention devoted to the second-life electric vehicle battery market, actually deriving the real market prospects and opportunities can be difficult. Visiongain has looked beyond the attention-grabbing headlines to create an accurate market research report that will help you arrive at logical, valuable conclusions that are grounded in reality- not media headlines.
With global, national/regional, and submarket forecasts for the second-life electric vehicle battery market, this report covers key aspects of this market. In addition, the report profiles the leading companies in the market, plus drivers and restraints analysis of the market.
Reasons to buy
• Learn where the second-life electric vehicle battery market is headed
• Understand the supply chain.
• See where the business opportunities are
• Compare your own evaluations with a second opinion
• Discover who the first movers are within this market space
• See what the barriers to entry are likely to be
Featured content
151 Tables, Charts And Graphs
Global Second Life Electric Vehicle Battery Forecast 2019-2029:
Second Life Electric Vehicle Battery Submarket Forecasts From 2019-2029
Second Life Electric Vehicle Battery Forecasts By Application 2019-2029:
Solar Power Forecast 2019-2029
Industrial Plants Forecast 2019-2029
Power Grid Forecast 2019-2029
Second Life Electric Vehicle Battery Forecasts By Source 2019-2029:
Electric Cars Forecast 2019-2029
Electric Buses Forecast 2019-2029
Light Commercial Electric Vehicles Forecast 2019-2029
Regional & National Second Life Electric Vehicle Battery Forecasts 2019-2029
North America Second Life Electric Vehicle Battery Forecasts 2019-2029
US Second Life Electric Vehicle Battery Forecasts 2019-2029
Canada Second Life Electric Vehicle Battery Forecasts 2019-2029
Europe Second Life Electric Vehicle Battery Forecasts 2019-2029
Germany Second Life Electric Vehicle Battery Forecasts 2019-2029
UK Second Life Electric Vehicle Battery Forecasts 2019-2029
France Second Life Electric Vehicle Battery Forecasts 2019-2029
Norway Second Life Electric Vehicle Battery Forecasts 2019-2029
Rest of Europe Second Life Electric Vehicle Battery Forecasts 2019-2029
Asia-Pacific Second Life Electric Vehicle Battery Forecasts 2019-2029
China Second Life Electric Vehicle Battery Forecasts 2019-2029
Japan Second Life Electric Vehicle Battery Forecasts 2019-2029
RoW Second Life Electric Vehicle Battery Forecasts 2019-2029
Profiles of key players
BMW AG
BYD Co.
Connected Energy Ltd.
Toyota Motor Corporation
Nissan Motor Company
Hyundai Motor Co.
Daimler AG
Renault SA
General Motor Co.
Eaton Corp PLC
The second-life electric vehicle battery market is forecast for growth. With a Visiongain report, you can learn just how the development of this market could affect you. With 150+ tables, charts and graphs, this 170 page report will be of interest to you.
Who should read this report?
Anyone within the Lithium-ion battery value chain
Electric vehicle manufacturers
Automotive OEMs
Battery manufacturers
Battery recycling companies
Second-life electric vehicle battery companies
Energy storage specialists
Solar power companies
Utility companies
Electric vehicle fleet operators
Engineers
R&D specialists
Business development managers
Market analysts
Consultants
Marketing managers
Investors
Government
Regulators
Industry associations
Visiongain is a trading partner with the US Federal Government
CCR Ref number: KD4R6
Do you have any custom requirements we can help you with? Any need for specific country, geo region, market segment or specific company information? Contact us today, we can discuss your needs and see how we can help: sara.peerun@visiongain.com
1. Report Overview
1.1 Global Second-life Electric Vehicle Batteries Market Overview
1.2 Global Second-life Electric Vehicle Batteries Market Segmentation
1.3 Why You Should Read This Report
1.4 How This Report Delivers
1.5 Key Questions Answered by This Analytical Report Include:
1.6 Who is This Report For?
1.7 Methodology
1.7.1 Secondary Research
1.7.2 Market Evaluation & Forecasting Methodology
1.8 Frequently Asked Questions (FAQ)
1.9 Associated Visiongain Reports
1.10 About Visiongain
2. Introduction to the Second-life Electric Vehicle Batteries Market
2.1 Global Second-life Electric Vehicle Batteries Market Structure
2.2 Second-life Electric Vehicle Batteries Market Definition
2.3 Benefits of Second Life EV Batteries
2.4 Supply Chain
3. Global Second-life Electric Vehicle Batteries Market 2019-2029
3.1 Global Second-life Electric Vehicle Batteries Market Forecast 2019-2029
3.2 Global Second-life Electric Vehicle Batteries Market Drivers & Restraints
3.2.1 Increasing Usage in Solar Power and Smart Grid Projects
3.2.2 Widening Application Areas of Second-life Electric Vehicle Batteries
3.2.3 Rising Demand for Energy Storage
3.2.4 Low Adoption of Electric Vehicles in Developing Regions
4. Global Second-Life Electric Vehicle Batteries Market Forecast by Application 2019-2029
4.1 Global Second-Life Electric Vehicle Battery Solar Power Submarket Forecast 2019-2029
4.1.1 Global Second-Life Electric Vehicle Battery Solar Power Submarket Analysis
4.2 Global Second-Life Electric Vehicle Battery Power Grid Submarket Forecast 2019-2029
4.2.1 Global Second-Life Electric Vehicle Battery Power Grid Submarket Analysis
4.3 Global Second-Life Electric Vehicle Battery Industrial Plants Submarket Forecast 2019-2029
4.3.1 Global Second-Life Electric Vehicle Battery Industrial Plants Submarket Analysis
4.4 Global Second-Life Electric Vehicle Battery Others Submarket Forecast 2019-2029
4.4.1 Global Second-Life Electric Vehicle Battery Others Submarket Analysis
5. Global Second-Life Electric Vehicle Batteries Market Forecast by Source 2019-2029
5.1 Global Second-Life Electric Vehicle Battery Electric Cars Submarket Forecast 2019-2029
5.1.1 Global Second-Life Electric Vehicle Battery Electric Cars Submarket Analysis
5.2 Global Second-Life Electric Vehicle Battery Electric Buses Submarket Forecast 2019-2029
5.2.1 Global Second-Life Electric Vehicle Battery Electric Buses Submarket Analysis
5.3 Global Second-Life Electric Vehicle Battery Light Commercial EVs Submarket Forecast 2019-2029
5.3.1 Global Second-Life Electric Vehicle Battery Light Commercial EVs Submarket Analysis
6. Leading Regional Second-life Electric Vehicle Batteries Markets Forecast 2019-2029
6.1 North America Second-life Electric Vehicle Batteries Market Forecast 2019-2029
6.1.1 North America Second-life Electric Vehicle Batteries Market, By Country 2019-2029
6.2 Europe Second-life Electric Vehicle Batteries Market Forecast 2019-2029
6.2.1 Europe Second-life Electric Vehicle Batteries Market, By Country 2019-2029
6.3 Asia Pacific Second-life Electric Vehicle Batteries Market Forecast 2019-2029
6.3.1 Asia Pacific Second-life Electric Vehicle Batteries Market, By Country 2019-2029
6.4 RoW Second-life Electric Vehicle Batteries Market Forecast 2019-2029
6.4.1 RoW Second-life Electric Vehicle Batteries Market Overview
7. SWOT Analysis of the Second-life Electric Vehicle Batteries Market 2019-2029
8. Company Profiles
8.1 Second-Life Electric Vehicle Batteries Companies 2019
8.2 BMW AG
8.2.1 BMW AG Overview
8.2.2 BMW AG Sales 2014-2018
8.2.3 BMW AG Net Income 2014-2018
8.2.4 BMW AG Key Ratios
8.3 BYD Co.
8.3.1 BYD Co. Overview
8.3.2 BYD Co. Sales 2014-2018
8.3.3 BYD Co. Net Income 2014-2018
8.3.4 BYD Co. Key Ratios
8.4 Connected Energy Ltd.
8.4.1 Connected Energy Ltd. Overview
8.4.2 Connected Energy Ltd. Second-life Electric Vehicle Batteries Market Selected Recent Contracts / Projects / Programmes
8.5 Toyota Motor Corp
8.5.1 Toyota Motor Corp Overview
8.5.2 Toyota Motor Corp Sales 2014-2018
8.5.3 Toyota Motor Corp Net Income 2014-2018
8.5.4 Toyota Motor Corp Key Ratios
8.6 Nissan Motor Co.
8.6.1 Nissan Motor Co. Overview
8.6.2 Nissan Motor Co. Sales 2014-2018
8.6.3 Nissan Motor Co. Net Income 2014-2018
8.6.4 Nissan Motor Co. Kay Ratios
8.7 Hyundai Motor Co.
8.7.1 Hyundai Motor Co. Overview
8.7.2 Hyundai Motor Co. Sales 2014-2018
8.7.3 Hyundai Motor Co. Net Income 2014-2018
8.7.4 Hyundai Motor Co. Key Ratios
8.8 Daimler AG
8.8.1 Daimler AG Overview
8.8.2 Daimler AG Sales 2014-2018
8.8.3 Daimler AG Net Income 2014-2018
8.8.4 Daimler AG Key Ratios
8.9 Renault SA
8.9.1 Renault SA Overview
8.9.2 Renault SA Sales 2014-2018
8.9.3 Renault SA Net Income 2014-2018
8.9.4 Renault SA Key Ratios
8.10 General Motor Co.
8.10.1 General Motor Co. Overview
8.10.2 General Motor Co. Sales 2014-2018
8.10.3 General Motor Co. Net Income 2014-2018
8.10.4 General Motor Co. Key Ratios
8.11 Eaton Corp PLC
8.11.1 Eaton Corp PLC Overview
8.11.2 Eaton Corp PLC Sales 2014-2018
8.11.3 Eaton Corp PLC Net Income 2014-2018
8.11.4 Eaton Corp PLC Key Ratios
8.12 Honda Motor Co., Ltd.
8.12.1 Honda Motor Co., Ltd. Overview
8.12.2 Honda Motor Co., Ltd. Sales 2014-2018
8.12.3 Honda Motor Co., Ltd. Net Income 2014-2018
8.12.4 Honda Motor Co., Ltd. Financial Performance
8.13 Ford Motor Company
8.13.1 Ford Motor Company Overview
8.13.2 Ford Motor Company Sales 2014-2018
8.13.3 Ford Motor Company Net Income 2014-2018
8.13.4 Ford Motor Company Financial Performance
8.14 Johnson Controls International plc
8.14.1 Johnson Controls International plc Overview
8.14.2 Johnson Controls International plc Sales 2014-2018
8.14.3 Johnson Controls International plc Net Income 2014-2018
8.14.4 Johnson Controls International plc Financial Performance
8.15 Audi AG
8.15.1 Audi AG Overview
8.15.2 Audi AG Sales 2014-2018
8.15.3 Audi AG Net Income 2014-2018
8.15.4 Audi AG Financial Performance
8.16 Panasonic Corporation
8.16.1 Panasonic Corporation Overview
8.16.2 Panasonic Corporation Sales 2015-2018
8.16.3 Panasonic Corporation Net Income 2015-2018
8.16.4 Panasonic Corporation Financial Performance
8.17 Other Notable Companies in the Second-Life Electric Vehicle Batteries Market Value Chain
9. Conclusions
10. Glossary
List of Tables
Table 3.1 Global Second-Life Electric Vehicle Batteries Market Forecast 2019-2029 (US$m, AGR %, CAGR %, Cumulative)
Table 4.1 Global Second-Life Electric Vehicle Batteries Market Forecast By Application 2019-2029 (US$m, AGR %, Cumulative)
Table 4.2 Global Second-Life Electric Vehicle Batteries Market CAGR Forecast 2019-2024, 2024-2029, 2019-2029 (CAGR %)
Table 4.3 Global Second-Life Electric Vehicle Battery Solar Power Submarket by Region Forecast 2019-2029 (US$m, AGR %, CAGR %, Cumulative)
Table 4.4 Global Second-Life Electric Vehicle Battery Power Grid Submarket by Region Forecast 2019-2029 (US$m, AGR %, CAGR %, Cumulative)
Table 4.5 Global Second-Life Electric Vehicle Battery Industrial Plants Submarket by Region Forecast 2019-2029 (US$m, AGR %, CAGR %, Cumulative)
Table 4.6 Global Second-Life Electric Vehicle Battery Others Submarket by Region Forecast 2019-2029 (US$m, AGR %, CAGR %, Cumulative)
Table 5.1 Global Second-Life Electric Vehicle Batteries Market Forecast By Source 2019-2029 (US$m, AGR %, Cumulative)
Table 5.2 Global Second-Life Electric Vehicle Batteries Market CAGR Forecast 2019-2024, 2024-2029, 2019-2029 (CAGR %)
Table 5.3 Global Second-Life Electric Vehicle Battery Electric Cars Submarket by Region Forecast 2019-2029 (US$m, AGR %, CAGR %, Cumulative)
Table 5.4 Global Second-Life Electric Vehicle Battery Electric Buses Submarket by Region Forecast 2019-2029 (US$m, AGR %, CAGR %, Cumulative)
Table 5.5 Global Second-Life Electric Vehicle Battery Light Commercial EVs Submarket by Region Forecast 2019-2029 (US$m, AGR %, CAGR %, Cumulative)
Table 6.1 Leading Regional Second-Life Electric Vehicle Batteries Market By Application Forecast 2019-2029 (US$m, Global AGR %, Cumulative)
Table 6.2 Leading Regional Second-Life Electric Vehicle Batteries Market By Source Forecast 2019-2029 (US$m, Global AGR %, Cumulative)
Table 6.3 Leading Regional Second-Life Electric Vehicle Batteries Markets CAGR Forecast 2019-2024, 2024-2029, 2019-2029 (CAGR %)
Table 6.4 North America Second-Life Electric Vehicle Batteries Market by Application Forecast 2019-2029 (US$m, AGR %, CAGR %, Cumulative)
Table 6.5 North America Second-Life Electric Vehicle Batteries Market by Source Forecast 2019-2029 (US$m, AGR %, CAGR %, Cumulative)
Table 6.6 North America Second-Life Electric Vehicle Batteries Market by Country Forecast 2019-2029 (US$m, AGR %, Cumulative)
Table 6.7 Europe Second-Life Electric Vehicle Batteries Market by Application Forecast 2019-2029 (US$m, AGR %, CAGR %, Cumulative)
Table 6.8 Europe Second-Life Electric Vehicle Batteries Market by Source Forecast 2019-2029 (US$m, AGR %, CAGR %, Cumulative)
Table 6.9 Europe Second-Life Electric Vehicle Batteries Market by Country Forecast 2019-2029 (US$m, AGR %, Cumulative)
Table 6.10 Asia Pacific Second-Life Electric Vehicle Batteries Market by Application Forecast 2019-2029 (US$m, AGR %, CAGR %, Cumulative)
Table 6.11 Asia Pacific Second-Life Electric Vehicle Batteries Market by Source Forecast 2019-2029 (US$m, AGR %, CAGR %, Cumulative)
Table 6.12 Asia Pacific Second-Life Electric Vehicle Batteries Market by Country Forecast 2019-2029 (US$m, AGR %, Cumulative)
Table 6.13 RoW Second-Life Electric Vehicle Batteries Market by Application Forecast 2019-2029 (US$m, AGR %, CAGR %, Cumulative)
Table 6.14 RoW Second-Life Electric Vehicle Batteries Market by Source Forecast 2019-2029 (US$m, AGR %, CAGR %, Cumulative)
Table 7.1 Global Second-Life Electric Vehicle Batteries Market SWOT Analysis 2019-2029
Table 8.1 Second-Life Electric Vehicle Batteries Market Companies 2019
Table 8.2 BMW AG Profile 2019 (CEO, Parent Company Sales US$m, Sales in the Market US$m, Business Segment in the Market, HQ, Founded, No. of Employees, Website)
Table 8.3 BMW AG Sales 2014-2018 (US$m, AGR %)
Table 8.4 Net Income 2014-2018 (US$m, AGR %)
Table 8.10 BYD Co. Profile 2019 (CEO, Parent Company Sales US$m, Sales in the Market US$m, Business Segment in the Market, HQ, Founded, No. of Employees, Website)
Table 8.11 BYD Co. Sales 2014-2018 (US$m, AGR %)
Table 8.12 Net Income 2014-2018 (US$m, AGR %)
Table 8.13 BYD Co. Profitibility 2009-2018
Table 8.18 Connected Energy Ltd. Profile 2019 (CEO, Parent Company Sales US$m, Sales in the Market US$m, Business Segment in the Market, HQ, Founded, No. of Employees, Website)
Table 8.19 Toyota Motor Corp Profile 2019 (CEO, Parent Company Sales US$m, Sales in the Market US$m, Business Segment in the Market, HQ, Founded, No. of Employees, Website)
Table 8.20 Toyota Motor Corp Sales 2014-2018 (US$m, AGR %)
Table 8.21 Net Income 2014-2018 (US$m, AGR %)
Table 8.22 Toyota Motor Corp Profitibility 2009-2018
Table 8.27 Nissan Motor Co. Profile 2019 (CEO, Parent Company Sales US$m, Sales in the Market US$m, Business Segment in the Market, HQ, Founded, No. of Employees, Website)
Table 8.28 Nissan Motor Co. Sales 2014-2018 (US$m, AGR %)
Table 8.29 Net Income 2014-2018 (US$m, AGR %)
Table 8.30 Nissan Motor Co. Profitability 2009-2018
Table 8.35 Hyundai Motor Co. Profile 2019 (CEO, Parent Company Sales US$m, Sales in the Market US$m, Business Segment in the Market, HQ, Founded, No. of Employees, Website)
Table 8.36 Hyundai Motor Co. Sales 2014-2018 (US$m, AGR %)
Table 8.37 Net Income 2014-2018 (US$m, AGR %)
Table 8.38 Hyundai Motor Co. Profitability 2009-2018
Table 8.43 Daimler AG Profile 2019 (CEO, Parent Company Sales US$m, Sales in the Market US$m, Business Segment in the Market, HQ, Founded, No. of Employees, Website)
Table 8.44 Daimler AG Sales 2014-2018 (US$m, AGR %)
Table 8.45 Net Income 2014-2018 (US$m, AGR %)
Table 8.46 Daimler AG Profitability 2009-2018
Table 8.51 Renault SA Profile 2019 (CEO, Parent Company Sales US$m, Sales in the Market US$m, Business Segment in the Market, HQ, Founded, No. of Employees, Website)
Table 8.52 Renault SA Sales 2014-2018 (US$m, AGR %)
Table 8.53 Net Income 2014-2018 (US$m, AGR %)
Table 8.54 Renault SA Profitability 2009-2018
Table 8.59 General Motor Co. Profile 2019 (CEO, Parent Company Sales US$m, Sales in the Market US$m, Business Segment in the Market, HQ, Founded, No. of Employees, Website)
Table 8.60 General Motor Co. Sales 2014-2018 (US$m, AGR %)
Table 8.61 Net Income 2014-2018 (US$m, AGR %)
Table 8.62 General Motor Co. Profitability 2009-2018
Table 8.67 Eaton Corp PLC Profile 2019 (CEO, Parent Company Sales US$m, Sales in the Market US$m, Business Segment in the Market, HQ, Founded, No. of Employees, Website)
Table 8.68 Eaton Corp PLC Sales 2014-2018 (US$m, AGR %)
Table 8.69 Net Income 2014-2018 (US$m, AGR %)
Table 8.70 Eaton Corp PLC Profitability 2009-2018
Table 8.71 Honda Motor Co., Ltd. Profile 2019 (CEO, HQ, Founded, No. of Employees, Website)
Table 8.72 Honda Motor Co., Ltd. Sales 2014-2018 (US$m, AGR %)
Table 8.73 Net Income 2014-2018 (US$m, AGR %)
Table 8.75 Ford Motor Company Profile 2019 (CEO, HQ, Founded, No. of Employees, Website)
Table 8.76 Ford Motor Company Sales 2014-2018 (US$m, AGR %)
Table 8.77 Net Income 2014-2018 (US$m, AGR %)
Table 8.79 Johnson Controls International plc Profile 2019 (CEO, HQ, Founded, No. of Employees, Website)
Table 8.80 Johnson Controls International plc Sales 2014-2018 (US$m, AGR %)
Table 8.81 Net Income 2014-2018 (US$m, AGR %)
Table 8.83 Audi AG Profile 2019 (CEO, HQ, Founded, No. of Employees, Website)
Table 8.84 Audi AG Sales 2014-2018 (US$m, AGR %)
Table 8.85 Net Income 2014-2018 (US$m, AGR %)
Table 8.87 Panasonic Corporation Profile 2019 (CEO, HQ, Founded, No. of Employees, Website)
Table 8.88 Panasonic Corporation Sales 2015-2018 (US$m, AGR %)
Table 8.89 Net Income 2015-2018 (US$m, AGR %)
Table 8.91 Other Players in the Value Chain
List of Figures
Figure 1.1 Global Second-Life Electric Vehicle Batteries Market Segmentation Overview
Figure 2.1 Global Second-Life Electric Vehicle Batteries Market Segmentation Overview
Figure 2.2 Supply Chain
Figure 3.1 Global Second-Life Electric Vehicle Batteries Market Forecast 2019-2029 (US$m, AGR %)
Figure 4.1 Global Second-Life Electric Vehicle Batteries Market Forecast By Application 2019-2029 (US$m, Global AGR %)
Figure 4.2 Global Second-Life Electric Vehicle Batteries Market Share By Application 2019 (% Share)
Figure 4.3 Global Second-Life Electric Vehicle Batteries Market by Application 2024 (% Share)
Figure 4.4 Global Second-Life Electric Vehicle Batteries Market Share Forecast 2029 (% Share)
Figure 4.5 Global Second-Life Electric Vehicle Battery Solar Power Submarket by Region AGR Forecast 2019-2029 (%)
Figure 4.6 Global Second-Life Electric Vehicle Battery Solar Power Submarket by Region Forecast 2019-2029 (US$m, Global AGR %)
Figure 4.7 Global Second-Life Electric Vehicle Battery Solar Power Submarket by Region 2019, 2024, 2029 (% Share)
Figure 4.8 Global Second-Life Electric Vehicle Battery Power Grid Submarket by Region AGR Forecast 2019-2029 (%)
Figure 4.9 Global Second-Life Electric Vehicle Battery Power Grid Submarket by Region Forecast 2019-2029 (US$m, Global AGR %)
Figure 4.10 Global Second-Life Electric Vehicle Battery Power Grid Submarket by Region 2019, 2024, 2029 (% Share)
Figure 4.11 Global Second-Life Electric Vehicle Battery Industrial Plants Submarket by Region AGR Forecast 2019-2029 (%)
Figure 4.12 Global Second-Life Electric Vehicle Battery Industrial Plants Submarket by Region Forecast 2019-2029 (US$m, Global AGR %)
Figure 4.13 Global Second-Life Electric Vehicle Battery Industrial Plants Submarket by Region 2019, 2024, 2029 (% Share)
Figure 4.14 Global Second-Life Electric Vehicle Battery Others Submarket by Region AGR Forecast 2019-2029 (%)
Figure 4.15 Global Second-Life Electric Vehicle Battery Others Submarket by Region Forecast 2019-2029 (US$m, Global AGR %)
Figure 4.16 Global Second-Life Electric Vehicle Battery Others Submarket by Region 2019, 2024, 2029 (% Share)
Figure 5.1 Global Second-Life Electric Vehicle Batteries Market Forecast By Source 2019-2029 (US$m, Global AGR %)
Figure 5.2 Global Second-Life Electric Vehicle Batteries Market Share By Source 2019 (% Share)
Figure 5.3 Global Second-Life Electric Vehicle Batteries Market by Source 2024 (% Share)
Figure 5.4 Global Second-Life Electric Vehicle Batteries Market Share Forecast 2029 (% Share)
Figure 5.5 Global Second-Life Electric Vehicle Battery Electric Cars Submarket by Region AGR Forecast 2019-2029 (%)
Figure 5.6 Global Second-Life Electric Vehicle Battery Electric Cars Submarket by Region Forecast 2019-2029 (US$m, Global AGR %)
Figure 5.7 Global Second-Life Electric Vehicle Battery Electric Cars Submarket by Region 2019, 2024, 2029 (% Share)
Figure 5.8 Global Second-Life Electric Vehicle Battery Electric Buses Submarket by Region AGR Forecast 2019-2029 (%)
Figure 5.9 Global Second-Life Electric Vehicle Battery Electric Buses Submarket by Region Forecast 2019-2029 (US$m, Global AGR %)
Figure 5.10 Global Second-Life Electric Vehicle Battery Electric Buses Submarket by Region 2019, 2024, 2029 (% Share)
Figure 5.11 Global Second-Life Electric Vehicle Battery Light Commercial EVs Submarket by Region AGR Forecast 2019-2029 (%)
Figure 5.12 Global Second-Life Electric Vehicle Battery Light Commercial EVs Submarket by Region Forecast 2019-2029 (US$m, Global AGR %)
Figure 5.13 Global Second-Life Electric Vehicle Battery Light Commercial EVs Submarket by Region 2019, 2024, 2029 (% Share)
Figure 6.1 Leading Regional Second-Life Electric Vehicle Batteries Market AGR Forecast 2019-2029 (AGR %)
Figure 6.2 Leading Regional Second-Life Electric Vehicle Batteries Markets Forecast 2019-2029 (US$m, Global AGR %)
Figure 6.3 Leading Regional Second-Life Electric Vehicle Batteries Market Share Forecast 2019 (% Share)
Figure 6.4 Leading Regional Second-Life Electric Vehicle Batteries Market Share Forecast 2024 (% Share)
Figure 6.5 Leading Regional Second-Life Electric Vehicle Batteries Market Share Forecast 2029 (% Share)
Figure 6.6 North America Second-Life Electric Vehicle Batteries Market By Application Forecast 2019-2029 (US$m, Total North America Market Sales AGR %)
Figure 6.7 North America Second-Life Electric Vehicle Batteries Market By Application Forecast 2019, 2024, 2029 (% Share)
Figure 6.8 North America Second-Life Electric Vehicle Batteries Market By Source Forecast 2019-2029 (US$m, Total North America Market Sales AGR %)
Figure 6.9 North America Second-Life Electric Vehicle Batteries Market By Source Forecast 2019, 2024, 2029 (% Share)
Figure 6.10 North America Second-Life Electric Vehicle Batteries Market by Country Forecast 2019-2029 (US$m, North America AGR %)
Figure 6.11 North America Second-Life Electric Vehicle Batteries Market by Country Market Share Forecast 2019 (% Share)
Figure 6.12 North America Second-Life Electric Vehicle Batteries Market by Country Market Share Forecast 2024 (% Share)
Figure 6.13 North America Second-Life Electric Vehicle Batteries Market by Country Market Share Forecast 2029 (% Share)
Figure 6.14 Europe Second-Life Electric Vehicle Batteries Market By Application Forecast 2019-2029 (US$m, Total Europe Market Sales AGR %)
Figure 6.15 Europe Second-Life Electric Vehicle Batteries Market By Application Forecast 2019, 2024, 2029 (% Share)
Figure 6.16 Europe Second-Life Electric Vehicle Batteries Market By Source Forecast 2019-2029 (US$m, Total Europe Market Sales AGR %)
Figure 6.17 Europe Second-Life Electric Vehicle Batteries Market By Source Forecast 2019, 2024, 2029 (% Share)
Figure 6.18 Europe Second-Life Electric Vehicle Batteries Market by Country Forecast 2019-2029 (US$m, Europe AGR %)
Figure 6.19 Europe Second-Life Electric Vehicle Batteries Market by Country Market Share Forecast 2019 (% Share)
Figure 6.20 Europe Second-Life Electric Vehicle Batteries Market by Country Market Share Forecast 2024 (% Share)
Figure 6.21 Europe Second-Life Electric Vehicle Batteries Market by Country Market Share Forecast 2029 (% Share)
Figure 6.22 Asia Pacific Second-Life Electric Vehicle Batteries Market By Application Forecast 2019-2029 (US$m, Total Asia Pacific Market Sales AGR %)
Figure 6.23 Asia Pacific Second-Life Electric Vehicle Batteries Market By Application Forecast 2019, 2024, 2029 (% Share)
Figure 6.24 Asia Pacific Second-Life Electric Vehicle Batteries Market By Source Forecast 2019-2029 (US$m, Total Asia Pacific Market Sales AGR %)
Figure 6.25 Asia Pacific Second-Life Electric Vehicle Batteries Market By Source Forecast 2019, 2024, 2029 (% Share)
Figure 6.26 Asia Pacific Second-Life Electric Vehicle Batteries Market by Country Forecast 2019-2029 (US$m, Asia Pacific AGR %)
Figure 6.27 Asia Pacific Second-Life Electric Vehicle Batteries Market by Country Market Share Forecast 2019 (% Share)
Figure 6.28 Asia Pacific Second-Life Electric Vehicle Batteries Market by Country Market Share Forecast 2024 (% Share)
Figure 6.29 Asia Pacific Second-Life Electric Vehicle Batteries Market by Country Market Share Forecast 2029 (% Share)
Figure 6.30 RoW Second-Life Electric Vehicle Batteries Market By Application Forecast 2019-2029 (US$m, Total RoW Market Sales AGR %)
Figure 6.31 RoW Second-Life Electric Vehicle Batteries Market By Application Forecast 2019, 2024, 2029 (% Share)
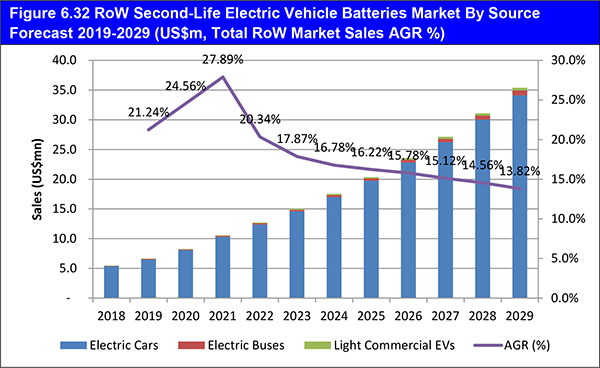
Figure 6.32 RoW Second-Life Electric Vehicle Batteries Market By Source Forecast 2019-2029 (US$m, Total RoW Market Sales AGR %)
Figure 6.33 RoW Second-Life Electric Vehicle Batteries Market By Source Forecast 2019, 2024, 2029 (% Share)
Figure 8.1 BMW AG Sales 2014-2018 (US$m, AGR %)
Figure 8.2 BMW AG Net Income 2014-2018 (US$m, AGR %)
Figure 8.3 BYD Co. Sales 2014-2018 (US$m, AGR %)
Figure 8.4 BYD Co. Net Income 2014-2018 (US$m, AGR %)
Figure 8.5 Toyota Motor Corp Sales 2014-2018 (US$m, AGR %)
Figure 8.6 Toyota Motor Corp Net Income 2014-2018 (US$m, AGR %)
Figure 8.7 Nissan Motor Co. Sales 2014-2018 (US$m, AGR %)
Figure 8.8 Nissan Motor Co. Net Income 2014-2018 (US$m, AGR %)
Figure 8.9 Hyundai Motor Co. Sales 2014-2018 (US$m, AGR %)
Figure 8.10 Hyundai Motor Co. Net Income 2014-2018 (US$m, AGR %)
Figure 8.11 Daimler AG Sales 2014-2018 (US$m, AGR %)
Figure 8.12 Daimler AG Net Income 2014-2018 (US$m, AGR %)
Figure 8.13 Renault SA Sales 2014-2018 (US$m, AGR %)
Figure 8.14 Renault SA Net Income 2014-2018 (US$m, AGR %)
Figure 8.15 General Motor Co. Sales 2014-2018 (US$m, AGR %)
Figure 8.16 General Motor Co. Net Income 2014-2018 (US$m, AGR %)
Figure 8.17 Eaton Corp PLC Sales 2014-2018 (US$m, AGR %)
Figure 8.18 Eaton Corp PLC Net Income 2014-2018 (US$m, AGR %)
Figure 8.19 Honda Motor Co., Ltd. Sales 2014-2018 (US$m, AGR %)
Figure 8.20 Honda Motor Co., Ltd. Net Income 2014-2018 (US$m, AGR %)
Figure 8.21 Ford Motor Company Sales 2014-2018 (US$m, AGR %)
Figure 8.22 Ford Motor Company Net Income 2014-2018 (US$m, AGR %)
Figure 8.23 Johnson Controls International plc Sales 2014-2018 (US$m, AGR %)
Figure 8.24 Johnson Controls International plc Net Income 2014-2018 (US$m, AGR %)
Figure 8.25 Audi AG Sales 2014-2018 (US$m, AGR %)
Figure 8.26 Audi AG Net Income 2014-2018 (US$m, AGR %)
Figure 8.27 Panasonic Corporation Sales 2015-2018 (US$m, AGR %)
Figure 8.28 Panasonic Corporation Net Income 2015-2018 (US$m, AGR %)