1. Report Overview
1.1. Introduction
1.2. Why You Should Read This Report
1.3. Key Questions Answered by This Analytical Report
1.4. Who is This Report For?
1.5. Methodology
1.6. Frequently Asked Questions (FAQ)
1.7. Associated Visiongain Reports
1.8. About Visiongain
2. Executive Summary- Gigafactory Market
2.1. Global Gigafactory Market
2.2. Compound Annual Growth Rate, (2020-2025), (2025-2020), (2020-2030)
2.3. Largest Market Segment, by Application
2.4. Key Growth Market Segment, by Application
2.5. Largest Market Segment, by Region
2.6. Key Growth Market Segment, by Region
3. Gigafactory Market Overview
3.1. Market Dynamics
3.1.1. Market Drivers
3.1.1.1. Growing demand for electric vehicles and industrial lithium ion battery
3.1.1.2. In-house production and assemble of lithium ion battery
3.1.1.3. Green energy revolution
3.1.2. Market Restraints/Challenges
3.1.2.1. Supply chain bottleneck
3.1.2.2. High capital (CAPEX) and operational (OPEX) cost
3.1.2.3. Depletion and rising prices of raw materials
3.1.2.4. Intense competition and price war
3.1.2.5. Government policies and framework
3.1.3. Opportunities
3.1.3.1. Growing requirement for high-capacity lithium-ion batteries
3.1.3.2. Widespread adoption of eco-friendly vehicles
3.1.3.3. Increasingly strict fuel consumption regulations
3.1.4. SWOT Analysis
3.1.4.1. Strengths
3.1.4.1.1. Collaboration with automakers
3.1.4.1.2. Increasing number of electric vehicles due to environmental regulations
3.1.4.2. Weaknesses
3.1.4.2.1. Business partners are needed for expanding operations due to insufficient capital
3.1.4.2.2. Technology constraints
3.1.4.2.3. Weakness 3
3.1.4.3. Opportunities
3.1.4.3.1. Widespread adoption of eco-friendly vehicles
3.1.4.3.2. Growing R&D activities of Li- battery testing in automotive, aviation, and marine sectors.
3.1.4.4. Threats
3.1.4.4.1. Biofuel industry
3.1.4.4.2. Forward integration of raw material suppliers
3.1.5. Porter’s Five Forces Analysis
3.1.5.1. Competitive Rivalry
3.1.5.2. Supplier Power
3.1.5.3. Buyer Power
3.1.5.4. Threat of Substitution
3.1.5.5. Threat of New Entry
4. Gigafactory Market- Key Facts & Figures
4.1. List of Operational Gigafactory
4.1.1. Gigafactory 1 (Location, Area, Investment, Status, Owner/Operator, Product Offered, Battery Production Capacity per Year, Key Market Served, Power Management, Potential Job Creation, Recent Developments)
(Note: Similar Data points would be provided for Gigafactory 2-9)
4.1.2. Gigafactory 2
4.1.3. Gigafactory 3
4.1.4. Gigafactory 4
4.1.5. Gigafactory 5
4.1.6. Gigafactory 6
4.1.7. Gigafactory 7
4.1.8. Gigafactory 8
4.1.9. Gigafactory 9
4.2. List of Key Planned/Upcoming Gigafactory Projects
5. Global Gigafactory Market Analysis and Forecast 2020-2030, by Application (Pre COVID and V, U, W and L COVID Recovery Scenarios)
5.1. Market Overview
5.1.1. EV Battery & Assembly
5.1.1.1. High Installed Capacity for EV Battery & Assembly
5.1.2. Others
5.1.2.1. Mostly Focused on Manufacturing of Vehicle Parts, Solar Panels etc.
6. North America Gigafactory Market Analysis and Forecast, 2020-2030 Pre COVID and V, U, W and L COVID Recovery Scenarios)
6.1. Market Overview
6.2. North America Gigafactory Market Size and Forecast by Application
6.2.1. EV Battery & Assembly Submarket Expected to Grow at Fastest Rate
7. Europe Gigafactory Market Analysis and Forecast, 2020-2030 (Pre COVID and V, U, W and L COVID Recovery Scenarios)
7.1. Market Overview
7.2. Europe Gigafactory Market Size and Forecast by Application
7.2.1. Others Submarket Expected to Register Stable Growth
7.3. Europe Gigafactory Market Size and Forecast by Country
7.4. UK Gigafactory Market
7.4.1. Tesla Plan for Somerset Gigafactory
7.5. Poland Gigafactory Market
7.5.1. LG Chem Investments Raised for Wrocław Facility
7.6. Rest of Europe Gigafactory Market
7.6.1. Planned Berlin and Sweden Facility to Boost Growth
8. Asia Pacific Gigafactory Market Analysis and Forecast, 2020-2030 (Pre COVID and V, U, W and L COVID Recovery Scenarios)
8.1. Market Overview
8.2. Asia Pacific Gigafactory Market Size and Forecast by Application
8.2.1. EV Battery & Assembly Submarket to Remain Dominant by 2030
8.3. Asia Pacific Gigafactory Market Size and Forecast by Country
8.4. China Gigafactory Market
8.4.1. Strategic Contracts with Key Automakers
8.5. Japan Gigafactory Market
8.5.1. Growing Demand for EV’s
8.6. South Korea Gigafactory Market
8.6.1. LG Chem to produce Tesla cells in South Korea
8.7. Rest of Asia Pacific Gigafactory Market
8.7.1. India and Thailand Gigafactory Plans
9. Companies in the Gigafactory Market
9.1. Tesla Inc.
9.1.1. Company Snapshot
9.1.2. Company Overview
9.1.3. Business Strategy
9.1.4. Financial Performance (2015-2019)
9.1.4.1. Net Revenue
9.1.5. Product Portfolio
9.1.6. Recent Developments (2019-2020)
9.2. LG Chem
9.2.1. Company Snapshot
9.2.2. Company Overview
9.2.3. Business Strategy
9.2.4. Financial Performance (2017-2019)
9.2.4.1. Net Revenue
9.2.4.2. Geographical Revenue, 2019
9.2.4.3. Business Segment Revenue, 2019
9.2.5. Product Portfolio
9.2.6. Recent Developments (2018-2019)
9.3. Contemporary Amperex Technology Co. Limited (CATL)
9.3.1. Company Snapshot
9.3.2. Company Overview
9.3.3. Financial Performance (2016-2018)
9.3.3.1. Net Revenue
9.3.4. Product Portfolio
9.3.5. Recent Developments (2018-2019)
9.4. BYD Co Ltd
9.4.1. Company Snapshot
9.4.2. Company Overview
9.4.3. Financial Performance (2016-2018)
9.4.3.1. Net Revenue
9.4.3.2. Geographical Revenue, 2018
9.4.3.3. Business Segment Revenue, 2018
9.4.4. Product Portfolio
9.4.5. Recent Developments (2016-2019)
9.5. SAMSUNG SDI CO., LTD.
9.5.1. Company Snapshot
9.5.2. Company Overview
9.5.3. Financial Performance (2016-2019)
9.5.3.1. Net Revenue
9.5.3.2. Geographical Revenue, 2019
9.5.3.3. Business Segment Revenue, 2019
9.5.4. Recent Developments (2018-2019)
9.6. BAK Power Battery
9.6.1. Company Snapshot
9.6.2. Company Overview
9.6.3. Recent Developments (2017-2019)
9.7. Toshiba International Corporation
9.7.1. Company Snapshot
9.7.2. Company Overview
9.7.3. Business Strategy
9.7.4. Financial Performance (2018-2019)
9.7.4.1. Net Revenue
9.7.4.2. Geographical Revenue, 2019
9.7.4.3. Business Segment Revenue, 2019
9.7.5. Recent Developments (2018-2019)
9.8. Saft
9.8.1. Company Snapshot
9.8.2. Company Overview
9.8.3. Financial Performance (2014-2018)
9.8.3.1. Net Revenue
9.8.3.2. Business Segment Revenue, 2019
9.8.4. Recent Developments (2018-2019)
9.9. Dalian CBAK Power Battery Co., Ltd
9.9.1. Company Snapshot
9.9.2. Company Overview
9.9.3. Financial Performance (2016-2019)
9.9.3.1. Net Revenue
9.9.3.2. Geographical Revenue, 2019
9.9.4. Recent Developments (2017-2019)
9.10. TianJin Lishen Battery Joint-Stock CO., LTD.
9.10.1. Company Snapshot
9.10.2. Company Overview
9.10.3. Recent Developments (2006-2018)
9.11. Panasonic Corporation
9.11.1. Company Snapshot
9.11.2. Company Overview
9.11.3. Financial Performance (2017-2019)
9.11.3.1. Net Revenue
9.11.3.2. Geographical Revenue, 2019
9.11.4. Recent Developments (2018-2019)
9.12. Other Notable Players
10. Conclusion
11. Glossary
LIST OF TABLES
Table 1. Global Gigafactory Market, 2020-2030 (US$ billion, CAGR %)
Table 2 Global Hybrid/Plug-in Hybrid, and Fully Electric Vehicle Sales Statistics, 2000-2019
Table 3 Lithium Ion Battery- Cost Breakdown (Automotive Application)
Table 4 Lithium Ion Battery- Cost Breakdown (Automotive Application)
Table 5 Gigafactory 1- Key Facts & Figures 2020 (Location, Area, Investment, Status, Owner/Operator, Product Offered, Battery Production Capacity per Year, Key Market Served, Power Management, and Potential Job Creation)
Table 6 Gigafactory 2- Key Facts & Figures 2020 (Location, Area, Investment, Status, Owner/Operator, Product Offered, Battery Production Capacity per Year, Key Market Served, Power Management, and Potential Job Creation)
Table 7 Gigafactory 3- Key Facts & Figures 2020 (Location, Area, Investment, Status, Owner/Operator, Product Offered, Battery Production Capacity per Year, Key Market Served, Power Management, and Potential Job Creation)
Table 8 Gigafactory 4- Key Facts & Figures 2020 (Location, Area, Investment, Status, Owner/Operator, Product Offered, Battery Production Capacity per Year, Key Market Served, Power Management, and Potential Job Creation)
Table 9 Gigafactory 5- Key Facts & Figures 2020 (Location, Area, Investment, Status, Owner/Operator, Product Offered, Battery Production Capacity per Year, Key Market Served, Power Management, and Potential Job Creation)
Table 10 Gigafactory 6- Key Facts & Figures 2020 (Location, Area, Investment, Status, Owner/Operator, Product Offered, Battery Production Capacity per Year, Key Market Served, Power Management, and Potential Job Creation)
Table 11 Gigafactory 7- Key Facts & Figures 2020 (Location, Area, Investment, Status, Owner/Operator, Product Offered, Battery Production Capacity per Year, Key Market Served, Power Management, and Potential Job Creation)
Table 12 Gigafactory 8- Key Facts & Figures 2020 (Location, Area, Investment, Status, Owner/Operator, Product Offered, Battery Production Capacity per Year, Key Market Served, Power Management, and Potential Job Creation)
Table 13 Gigafactory 9- Key Facts & Figures 2020 (Location, Area, Investment, Status, Owner/Operator, Product Offered, Battery Production Capacity per Year, Key Market Served, Power Management, and Potential Job Creation)
Table 14 Gigafactory Planned Projects, by Key Players & Country, 2023 (Operator/Owner, Country, Forecast Capacity by 2020 (GW)
Table 15 Comparison Analysis- Key Players in Lithium-ion Battery Market, 2019
Table 16 Global Gigafactory Market Forecast by Application, 2020-2030 (US$ billion, AGR %, CAGR %)
Table 17 Global Gigafactory Market for EV Battery & Assembly Segment: Value Forecast 2020-2030 (US$ billion, AGR%, CAGR%)
Table 18 “V” Shaped Recovery: Global Gigafactory Market for EV Battery & Assembly Segment, Value Forecast 2020-2030 (US$ billion, AGR%, CAGR%)
Table 19 “U” Shaped Recovery: Global Gigafactory Market for EV Battery & Assembly Segment, Value Forecast 2020-2030 (US$ billion, AGR%, CAGR%)
Table 20 “W” Shaped Recovery: Global Gigafactory Market for EV Battery & Assembly Segment, Value Forecast 2020-2030 (US$ billion, AGR%, CAGR%)
Table 21 “L” Shaped Recovery: Global Gigafactory Market for EV Battery & Assembly Segment, Value Forecast 2020-2030 (US$ billion, AGR%, CAGR%)
Table 22 Global Gigafactory Market for Others Segment: Value Forecast 2020-2030 (US$ billion, AGR%, CAGR%)
Table 23 “V” Shaped Recovery: Global Gigafactory Market for Others Segment, Value Forecast 2020-2030 (US$ billion, AGR%, CAGR%)
Table 24 “U” Shaped Recovery: Global Gigafactory Market for Others Segment, Value Forecast 2020-2030 (US$ billion, AGR%, CAGR%)
Table 25 “W” Shaped Recovery: Global Gigafactory Market for Others Segment, Value Forecast 2020-2030 (US$ billion, AGR%, CAGR%)
Table 26 “L” Shaped Recovery: Global Gigafactory Market for Others Segment, Value Forecast 2020-2030 (US$ billion, AGR%, CAGR%)
Table 27 Global Gigafactory Market Forecast by Region, 2020-2030 (US$ billion, AGR %)
Table 28 Gigafactory Planned Projects, by Key Players & Country, 2023
Table 29 List of Key Operational/Planned Gigafactory
Table 30 “V” Shaped Recovery: Global Gigafactory Market Forecast by Region, 2020-2030 (US$ billion, AGR %)
Table 31 “U” Shaped Recovery: Global Gigafactory Market Forecast by Region, 2020-2030 (US$ billion, AGR %)
Table 32 “W” Shaped Recovery: Global Gigafactory Market Forecast by Region, 2020-2030 (US$ billion, AGR %)
Table 33 “L” Shaped Recovery: Global Gigafactory Market Forecast by Region, 2020-2030 (US$ billion, AGR %)
Table 34 North America Gigafactory Market Forecast by Application, 2020-2030 (US$ billion, AGR %)
Table 35 U.S. Electric Vehicle Sales, by Model, 2019
Table 36 U.S. Cumulative Electric Vehicle Sales, by Automaker
Table 37 “V” Shaped Recovery: North America Gigafactory Market Forecast by Application, 2020-2030 (US$ billion, AGR %)
Table 38 “U” Shaped Recovery: North America Gigafactory Market Forecast by Application, 2020-2030 (US$ billion, AGR %)
Table 39 “W” Shaped Recovery: North America Gigafactory Market Forecast by Application, 2020-2030 (US$ billion, AGR %)
Table 40 “L” Shaped Recovery: North America Gigafactory Market Forecast by Application, 2020-2030 (US$ billion, AGR %)
Table 41 Europe Gigafactory Market Forecast by Country, 2020-2030 (US$ billion, AGR %, CAGR %)
Table 42 “V” Shaped Recovery: Europe Gigafactory Market Forecast by Country, 2020-2030 (US$ billion, AGR %, CAGR %)
Table 43 “U” Shaped Recovery: Europe Gigafactory Market Forecast by Country, 2020-2030 (US$ billion, AGR %, CAGR %)
Table 44 “W” Shaped Recovery: Europe Gigafactory Market Forecast by Country, 2020-2030 (US$ billion, AGR %, CAGR %)
Table 45 “L” Shaped Recovery: Europe Gigafactory Market Forecast by Country, 2020-2030 (US$ billion, AGR %, CAGR %)
Table 46 Europe Gigafactory Market Forecast by Application, 2020-2030 (US$ billion, AGR %, CAGR %)
Table 47 “V” Shaped Recovery: Europe Gigafactory Market Forecast by Application, 2020-2030 (US$ billion, AGR %)
Table 48 “U” Shaped Recovery: Europe Gigafactory Market Forecast by Application, 2020-2030 (US$ billion, AGR %)
Table 49 “W” Shaped Recovery: Europe Gigafactory Market Forecast by Application, 2020-2030 (US$ billion, AGR %)
Table 50 “L” Shaped Recovery: Europe Gigafactory Market Forecast by Application 2020-2030 (US$ billion, AGR %)
Table 51 U.K. Gigafactory Market Forecast 2020-2030 (US$ billion, AGR %, CAGR %)
Table 52 U.K. Gigafactory Market Forecast by Application, 2020-2030 (US$ billion, AGR %)
Table 53 U.K. Gigafactory Market, Revenue Forecast 2020-2030 (US$ billion, AGR%, CAGR%): V-Shaped Recovery
Table 54 “V” Shaped Recovery: U.K. Gigafactory Market Forecast by Application 2020-2030 (US$ billion, AGR %)
Table 55 U.K. Gigafactory Market, Revenue Forecast 2020-2030 (US$ billion, AGR%, CAGR%): U-Shaped Recovery
Table 56 “U” Shaped Recovery: U.K. Gigafactory Market Forecast by Application, 2020-2030 (US$ billion, AGR %)
Table 57 U.K. Gigafactory Market, Revenue Forecast 2020-2030 (US$ billion, AGR%, CAGR%): W-Shaped Recovery
Table 58 “W” Shaped Recovery: U.K. Gigafactory Market Forecast by Application 2020-2030 (US$ billion, AGR %)
Table 59 U.K. Gigafactory Market, Revenue Forecast 2020-2030 (US$ billion, AGR%, CAGR%): L-Shaped Recovery
Table 60 “L” Shaped Recovery: U.K. Gigafactory Market Forecast by Application 2020-2030 (US$ billion, AGR %)
Table 61 Poland Gigafactory Market Forecast 2020-2030 (US$ billion, AGR %, CAGR %)
Table 62 Poland Gigafactory Market Forecast by Application, 2020-2030 (US$ billion, AGR %)
Table 63 Poland Gigafactory Market, Revenue Forecast 2020-2030 (US$ billion, AGR%, CAGR%): V-Shaped Recovery
Table 64 “V” Shaped Recovery: Poland Gigafactory Market Forecast by Application 2020-2030 (US$ billion, AGR %)
Table 65 Poland Gigafactory Market, Revenue Forecast 2020-2030 (US$ billion, AGR%, CAGR%): U-Shaped Recovery
Table 66 “U” Shaped Recovery: Poland Gigafactory Market Forecast by Application, 2020-2030 (US$ billion, AGR %)
Table 67 Poland Gigafactory Market, Revenue Forecast 2020-2030 (US$ billion, AGR%, CAGR%): W-Shaped Recovery
Table 68 “W” Shaped Recovery: Poland Gigafactory Market Forecast by Application 2020-2030 (US$ billion, AGR %)
Table 69 Poland Gigafactory Market, Revenue Forecast 2020-2030 (US$ billion, AGR%, CAGR%): L-Shaped Recovery
Table 70 “L” Shaped Recovery: Poland Gigafactory Market Forecast by Application 2020-2030 (US$ billion, AGR %)
Table 71 Rest of Europe Gigafactory Market Forecast 2020-2030 (US$ billion, AGR %, CAGR %)
Table 72 Rest of Europe Gigafactory Market Forecast by Application, 2020-2030 (US$ billion, AGR %)
Table 73 Rest of Europe Gigafactory Market, Revenue Forecast 2020-2030 (US$ billion, AGR%, CAGR%): V-Shaped Recovery
Table 74 “V” Shaped Recovery: Rest of Europe Gigafactory Market Forecast by Application 2020-2030 (US$ billion, AGR %)
Table 75 Rest of Europe Gigafactory Market, Revenue Forecast 2020-2030 (US$ billion, AGR%, CAGR%): U-Shaped Recovery
Table 76 “U” Shaped Recovery: Rest of Europe Gigafactory Market Forecast by Application, 2020-2030 (US$ billion, AGR %)
Table 77 Rest of Europe Gigafactory Market, Revenue Forecast 2020-2030 (US$ billion, AGR%, CAGR%): W-Shaped Recovery
Table 78 “W” Shaped Recovery: Rest of Europe Gigafactory Market Forecast by Application 2020-2030 (US$ billion, AGR %)
Table 79 Rest of Europe Gigafactory Market, Revenue Forecast 2020-2030 (US$ billion, AGR%, CAGR%): L-Shaped Recovery
Table 80 “L” Shaped Recovery: Rest of Europe Gigafactory Market Forecast by Application 2020-2030 (US$ billion, AGR %)
Table 81 Asia Pacific Gigafactory Market Forecast by Country, 2020-2030 (US$ billion, AGR %, CAGR %)
Table 82 “V” Shaped Recovery: Asia Pacific Gigafactory Market Forecast by Country, 2020-2030 (US$ billion, AGR %, CAGR %)
Table 83 “U” Shaped Recovery: Asia Pacific Gigafactory Market Forecast by Country, 2020-2030 (US$ billion, AGR %, CAGR %)
Table 84 “W” Shaped Recovery: Asia Pacific Gigafactory Market Forecast by Country, 2020-2030 (US$ billion, AGR %, CAGR %)
Table 85 “L” Shaped Recovery: Asia Pacific Gigafactory Market Forecast by Country, 2020-2030 (US$ billion, AGR %, CAGR %)
Table 86 Asia Pacific Gigafactory Market Forecast by Application, 2020-2030 (US$ billion, AGR %, CAGR %)
Table 87 “V” Shaped Recovery: Asia Pacific Gigafactory Market Forecast by Application, 2020-2030 (US$ billion, AGR %)
Table 88 “U” Shaped Recovery: Asia Pacific Gigafactory Market Forecast by Application, 2020-2030 (US$ billion, AGR %)
Table 89 “W” Shaped Recovery: Asia Pacific Gigafactory Market Forecast by Application, 2020-2030 (US$ billion, AGR %)
Table 90 “L” Shaped Recovery: Asia Pacific Gigafactory Market Forecast by Application 2020-2030 (US$ billion, AGR %)
Table 91 China Gigafactory Market Forecast 2020-2030 (US$ billion, AGR %, CAGR %)
Table 92 China Gigafactory Market Forecast by Application, 2020-2030 (US$ billion, AGR %)
Table 93 China Gigafactory Market, Revenue Forecast 2020-2030 (US$ billion, AGR%, CAGR%): V-Shaped Recovery
Table 94 “V” Shaped Recovery: China Gigafactory Market Forecast by Application 2020-2030 (US$ billion, AGR %)
Table 95 China Gigafactory Market, Revenue Forecast 2020-2030 (US$ billion, AGR%, CAGR%): U-Shaped Recovery
Table 96 “U” Shaped Recovery: China Gigafactory Market Forecast by Application, 2020-2030 (US$ billion, AGR %)
Table 97 China Gigafactory Market, Revenue Forecast 2020-2030 (US$ billion, AGR%, CAGR%): W-Shaped Recovery
Table 98 “W” Shaped Recovery: China Gigafactory Market Forecast by Application 2020-2030 (US$ billion, AGR %)
Table 99 China Gigafactory Market, Revenue Forecast 2020-2030 (US$ billion, AGR%, CAGR%): L-Shaped Recovery
Table 100 “L” Shaped Recovery: China Gigafactory Market Forecast by Application 2020-2030 (US$ billion, AGR %)
Table 101 Japan Gigafactory Market Forecast 2020-2030 (US$ billion, AGR %, CAGR %)
Table 102 Japan Gigafactory Market Forecast by Application, 2020-2030 (US$ billion, AGR %)
Table 103 Japan Gigafactory Market, Revenue Forecast 2020-2030 (US$ billion, AGR%, CAGR%): V-Shaped Recovery
Table 104 “V” Shaped Recovery: Japan Gigafactory Market Forecast by Application 2020-2030 (US$ billion, AGR %)
Table 105 Japan Gigafactory Market, Revenue Forecast 2020-2030 (US$ billion, AGR%, CAGR%): U-Shaped Recovery
Table 106 “U” Shaped Recovery: Japan Gigafactory Market Forecast by Application, 2020-2030 (US$ billion, AGR %)
Table 107 Japan Gigafactory Market, Revenue Forecast 2020-2030 (US$ billion, AGR%, CAGR%): W-Shaped Recovery
Table 108 “W” Shaped Recovery: Japan Gigafactory Market Forecast by Application 2020-2030 (US$ billion, AGR %)
Table 109 Japan Gigafactory Market, Revenue Forecast 2020-2030 (US$ billion, AGR%, CAGR%): L-Shaped Recovery
Table 110 “L” Shaped Recovery: Japan Gigafactory Market Forecast by Application 2020-2030 (US$ billion, AGR %)
Table 111 South Korea Gigafactory Market Forecast 2020-2030 (US$ billion, AGR %, CAGR %)
Table 112 South Korea Gigafactory Market Forecast by Application, 2020-2030 (US$ billion, AGR %)
Table 113 South Korea Gigafactory Market, Revenue Forecast 2020-2030 (US$ billion, AGR%, CAGR%): V-Shaped Recovery
Table 114 “V” Shaped Recovery: South Korea Gigafactory Market Forecast by Application 2020-2030 (US$ billion, AGR %)
Table 115 South Korea Gigafactory Market, Revenue Forecast 2020-2030 (US$ billion, AGR%, CAGR%): U-Shaped Recovery
Table 116 “U” Shaped Recovery: South Korea Gigafactory Market Forecast by Application, 2020-2030 (US$ billion, AGR %)
Table 117 South Korea Gigafactory Market, Revenue Forecast 2020-2030 (US$ billion, AGR%, CAGR%): W-Shaped Recovery
Table 118 “W” Shaped Recovery: South Korea Gigafactory Market Forecast by Application 2020-2030 (US$ billion, AGR %)
Table 119 South Korea Gigafactory Market, Revenue Forecast 2020-2030 (US$ billion, AGR%, CAGR%): L-Shaped Recovery
Table 120 “L” Shaped Recovery: South Korea Gigafactory Market Forecast by Application 2020-2030 (US$ billion, AGR %)
Table 121 Rest of Asia Pacific Gigafactory Market Forecast 2020-2030 (US$ billion, AGR %, CAGR %)
Table 122 Rest of Asia Pacific Gigafactory Market Forecast by Application, 2020-2030 (US$ billion, AGR %)
Table 123 Rest of Asia Pacific Gigafactory Market, Revenue Forecast 2020-2030 (US$ billion, AGR%, CAGR%): V-Shaped Recovery
Table 124 “V” Shaped Recovery: Rest of Asia Pacific Gigafactory Market Forecast by Application 2020-2030 (US$ billion, AGR %)
Table 125 Rest of Asia Pacific Gigafactory Market, Revenue Forecast 2020-2030 (US$ billion, AGR%, CAGR%): U-Shaped Recovery
Table 126 “U” Shaped Recovery: Rest of Asia Pacific Gigafactory Market Forecast by Application, 2020-2030 (US$ billion, AGR %)
Table 127 Rest of Asia Pacific Gigafactory Market, Revenue Forecast 2020-2030 (US$ billion, AGR%, CAGR%): W-Shaped Recovery
Table 128 “W” Shaped Recovery: Rest of Asia Pacific Gigafactory Market Forecast by Application 2020-2030 (US$ billion, AGR %)
Table 129 Rest of Asia Pacific Gigafactory Market, Revenue Forecast 2020-2030 (US$ billion, AGR%, CAGR%): L-Shaped Recovery
Table 130 “L” Shaped Recovery: Rest of Asia Pacific Gigafactory Market Forecast by Application 2020-2030 (US$ billion, AGR %)
Table 131 Tesla Inc. Company Profile 2020 (Market Entry, Public/Private, Headquarter, Total Company Sales US$bn, Geography, Key Market, Company Sales, Listed on, No. of Employees)
Table 132 Tesla Inc. Company Product Portfolio
Table 133 Tesla Inc., Total Company Revenue 2015-2019 ($bn, AGR %)
Table 134 Tesla Inc., List of Gigafactory
Table 135 LG Chem Company Profile 2019 (Market Entry, Public/Private, Headquarter, Total Company Sales US$bn, Geography, Key Market, Company Sales, Listed on, No. of Employees)
Table 136 LG Chem Company Product Portfolio
Table 137 LG Chem Total Company Sales 2017-2019 ($bn, AGR %)
Table 138 LG Chem- List of Mega factory (Operational/Planned)
Table 139 LG Chem, Production competitiveness (Electric Vehicle)
Table 140 Contemporary Amperex Technology Co. Limited Profile 2019 (Market Entry, Public/Private, Headquarter, Total Company Sales US$ bn, Geography, Key Market, Company Sales, Listed on, No. of Employees)
Table 141 Contemporary Amperex Technology Co. Limited Company Product Portfolio
Table 142 Contemporary Amperex Technology Co. Limited Total Company Sales 2016-2019 (GWh, AGR %)
Table 143 BYD Co Ltd Profile 2016 (Market Entry, Public/Private, Headquarter, Total Company Sales US$ bn, Geography, Key Market, Company Sales, Listed on, No. of Employees)
Table 144 BYD Co Ltd Company Product Portfolio
Table 145 BYD Co Ltd Total Company Sales 2015-2018 ($ bn, AGR %)
Table 146 SAMSUNG SDI CO., LTD. Profile 2019 (Market Entry, Public/Private, Headquarter, Total Company Sales US$bn, Geography, Key Market, Company Sales, Listed on, No. of Employees)
Table 147 SAMSUNG SDI CO., LTD. Total Company Sales 2016-2019 ($ bn, AGR %)
Table 148 BAK Power Battery Company Profile 2019 (Market Entry, Public/Private, Headquarter, Total Company Sales US$ bn, Geography, Key Market, Company Sales, Listed on, No. of Employees)
Table 149 Toshiba International Corporation Profile 2018 (Market Entry, Public/Private, Headquarter, Total Company Sales US$ bn, Geography, Key Market, Company Sales, Listed on, No. of Employees)
Table 150 Toshiba International Corporation, Lithium Ion Battery Cell Specification (SCiB)
Table 151 Toshiba International Corporation, Lithium Ion Battery Module Specification (SCiB)
Table 152 Toshiba International Corporation, Lithium Ion Battery System Specification (SCiB)
Table 153 Toshiba International Corporation Total Company Revenue 2015-2019 ($bn, AGR %)
Table 154 Saft Profile 2017 (Market Entry, Public/Private, Headquarter, Total Company Sales US$bn, Geography, Key Market, Company Sales, Listed on, No. of Employees)
Table 155 Dalian CBAK Power Battery Co., Ltd Company Profile 2019 (Market Entry, Public/Private, Headquarter, Total Company Sales US$ bn, Geography, Key Market, Company Sales, Listed on, No. of Employees)
Table 156 Dalian CBAK Power Battery Co., Ltd Total Company Sales 2016-2019 ($ Mn, AGR %)
Table 157 TianJin Lishen Battery Joint-Stock CO., LTD. Company Profile 2019 (Market Entry, Public/Private, Headquarter, Total Company Sales US$ bn, Geography, Key Market, Company Sales, Listed on, No. of Employees)
Table 158 Panasonic Corporation Company Profile 2019 (Market Entry, Public/Private, Headquarter, Total Company Sales US$bn, Geography, Key Market, Company Sales, Listed on, No. of Employees)
Table 159 Panasonic Corporation Total Company Sales 2017-2019 ($bn, AGR %)
Table 160 List of Other Key Lithium-ion Battery Manufacturers
LIST OF FIGURES
Figure 1 Global Gigafactory Market Segmentation
Figure 2 Global Gigafactory Market-Research Methodology- Bottom-up Approach
Figure 3 Global Gigafactory Market Overview
Figure 4 Global Electric Vehicle Sales Statistics
Figure 5 Global Electric Vehicle Stock (New Policy Scenario), 2015-2030
Figure 6 Global Electric Vehicle Stock (EV30@30 Scenario), 2015-2030
Figure 7 Lithium Ion Battery- Cost Breakdown (Automotive Application)
Figure 8 Lithium-ion Battery Pricing Analysis & Forecast 2010-2030
Figure 9 Porter’s Five Forces Analysis
Figure 10 SWOT Analysis
Figure 11 PEST Analysis
Figure 12 Global Gigafactory Market Forecast 2020-2030 (US$ billion, AGR %)
Figure 13 Global Gigafactory Market Share Forecast by Application 2020, 2025, 2030 (%)
Figure 14 Global Gigafactory Market for EV Battery & Assembly Segment: Value Forecast 2020-2030 (US$ billion, AGR%)
Figure 15 “V” Shaped Recovery: Global Gigafactory Market for EV Battery & Assembly Segment, Value Forecast 2020-2030 (US$ billion, AGR%)
Figure 16 “U” Shaped Recovery: Global Gigafactory Market for EV Battery & Assembly Segment, Value Forecast 2020-2030 (US$ billion, AGR%)
Figure 17 “W” Shaped Recovery: Global Gigafactory Market for EV Battery & Assembly Segment, Value Forecast 2020-2030 (US$ billion, AGR%)
Figure 18 “L” Shaped Recovery: Global Gigafactory Market for EV Battery & Assembly Segment, Value Forecast 2020-2030 (US$ billion, AGR%)
Figure 19 Global Gigafactory Market for Others Segment: Value Forecast 2020-2030 (US$ billion, AGR%)
Figure 20 “V” Shaped Recovery: Global Gigafactory Market for Others Segment, Value Forecast 2020-2030 (US$ billion, AGR%)
Figure 21 “U” Shaped Recovery: Global Gigafactory Market for Others Segment, Value Forecast 2020-2030 (US$ billion, AGR%)
Figure 22 “W” Shaped Recovery: Global Gigafactory Market for Others Segment, Value Forecast 2020-2030 (US$ billion, AGR%)
Figure 23 “L” Shaped Recovery: Global Gigafactory Market for Others Segment, Value Forecast 2020-2030 (US$ billion, AGR%)
Figure 24 Global Gigafactory Market Forecast by Region 2020-2030 (US$ billion)
Figure 25 Global Gigafactory Market Share Forecast by Region 2020, 2025, 2030 (%)
Figure 26 Global Gigafactory Market, Comparison Matrix, by Type VS Region (Comparison Matrix)
Figure 27 North America Gigafactory Snapshot
Figure 28 North America Gigafactory Market Forecast by EV Battery and Assembly, 2020-2030 (US$ billion)
Figure 29 North America Gigafactory Market Forecast by Others, 2020-2030 (US$ billion)
Figure 30 “V” Shaped Recovery: North America Gigafactory Market Forecast by EV Battery and Assembly, 2020-2030 (US$ billion, AGR%)
Figure 31 “V” Shaped Recovery: North America Gigafactory Market Forecast by Others, 2020-2030 (US$ billion, AGR%)
Figure 32 “U” Shaped Recovery: North America Gigafactory Market Forecast by EV Battery and Assembly, 2020-2030 (US$ billion)
Figure 33 “U” Shaped Recovery: North America Gigafactory Market Forecast by Others, 2020-2030 (US$ billion)
Figure 34 “W” Shaped Recovery: North America Gigafactory Market Forecast by EV Battery and Assembly, 2020-2030 (US$ billion, AGR%)
Figure 35 “W” Shaped Recovery: North America Gigafactory Market Forecast by Others, 2020-2030 (US$ billion, AGR%)
Figure 36 “L” Shaped Recovery: North America Gigafactory Market Forecast by EV Battery and Assembly, 2020-2030 (US$ billion, AGR%)
Figure 37 “L” Shaped Recovery: North America Gigafactory Market Forecast by Others, 2020-2030 (US$ billion, AGR%)
Figure 38 Europe Gigafactory Market Share Forecast by Country 2020, 2025, 2030 (%)
Figure 39 Europe Gigafactory Market Forecast for EV Battery & Assembly, 2020-2030 (US$ billion, AGR%)
Figure 40 Europe Gigafactory Market Forecast for Others, 2020-2030 (US$ billion, AGR%)
Figure 41 “V Shaped Recovery: Europe Gigafactory Market Forecast for EV Battery & Assembly, 2020-2030 (US$ billion, AGR%)
Figure 42 “V” Shaped Recovery: Europe Gigafactory Market Forecast for Others, 2020-2030 (US$ billion, AGR%)
Figure 43 “U” Shaped Recovery: Europe Gigafactory Market Forecast for EV Battery & Assembly, 2020-2030 (US$ billion, AGR%)
Figure 44 “U” Shaped Recovery: Europe Gigafactory Market Forecast for Others, 2020-2030 (US$ billion, AGR%)
Figure 45 “W” Shaped Recovery: Europe Gigafactory Market Forecast for EV Battery & Assembly, 2020-2030 (US$ billion, AGR%)
Figure 46 “W” Shaped Recovery: Europe Gigafactory Market Forecast for Others, 2020-2030 (US$ billion, AGR%)
Figure 47 “L” Shaped Recovery: Europe Gigafactory Market Forecast for EV Battery & Assembly, 2020-2030 (US$ billion, AGR%)
Figure 48 “L” Shaped Recovery: Europe Gigafactory Market Forecast for Others, 2020-2030 (US$ billion, AGR%)
Figure 49 U.K. Gigafactory Market Forecast 2020-2030 (US$ billion, AGR %)
Figure 50 “V”-Shaped Recovery: U.K. Gigafactory Market, Revenue Forecast 2020-2030 (US$ billion, AGR%)
Figure 51 “U”-Shaped Recovery: U.K. Gigafactory Market, Revenue Forecast 2020-2030 (US$ billion, AGR%)
Figure 52 “W”-Shaped Recovery: U.K. Gigafactory Market, Revenue Forecast 2020-2030 (US$ billion, AGR%)
Figure 53 “L”-Shaped Recovery: U.K. Gigafactory Market, Revenue Forecast 2020-2030 (US$ billion, AGR%)
Figure 54 Poland Gigafactory Market Forecast 2020-2030 (US$ billion, AGR %)
Figure 55 “V”-Shaped Recovery: Poland Gigafactory Market, Revenue Forecast 2020-2030 (US$ billion, AGR%)
Figure 56 “U”-Shaped Recovery: Poland Gigafactory Market, Revenue Forecast 2020-2030 (US$ billion, AGR%)
Figure 57 “W”-Shaped Recovery: Poland Gigafactory Market, Revenue Forecast 2020-2030 (US$ billion, AGR%)
Figure 58 “L”-Shaped Recovery: Poland Gigafactory Market, Revenue Forecast 2020-2030 (US$ billion, AGR%)
Figure 59 Rest of Europe Gigafactory Market Forecast 2020-2030 (US$ billion, AGR %)
Figure 60 “V”-Shaped Recovery: Rest of Europe Gigafactory Market, Revenue Forecast 2020-2030 (US$ billion, AGR%)
Figure 61 “U”-Shaped Recovery: Rest of Europe Gigafactory Market, Revenue Forecast 2020-2030 (US$ billion, AGR%)
Figure 62 “W”-Shaped Recovery: Rest of Europe Gigafactory Market, Revenue Forecast 2020-2030 (US$ billion, AGR%)
Figure 63 “L”-Shaped Recovery: Rest of Europe Gigafactory Market, Revenue Forecast 2020-2030 (US$ billion, AGR%)
Figure 64 Asia Pacific Gigafactory Market Share Forecast by Country 2020, 2025, 2030 (%)
Figure 65 Asia Pacific Gigafactory Market Forecast for EV Battery & Assembly, 2020-2030 (US$ billion, AGR%)
Figure 66 Asia Pacific Gigafactory Market Forecast for Others, 2020-2030 (US$ billion, AGR%)
Figure 67 “V” Shaped Recovery: Asia Pacific Gigafactory Market Forecast for EV Battery & Assembly, 2020-2030 (US$ billion, AGR%)
Figure 68 “V” Shaped Recovery: Asia Pacific Gigafactory Market Forecast for Others, 2020-2030 (US$ billion, AGR%)
Figure 69 “U” Shaped Recovery: Asia Pacific Gigafactory Market Forecast for EV Battery & Assembly, 2020-2030 (US$ billion, AGR%)
Figure 70 “U” Shaped Recovery: Asia Pacific Gigafactory Market Forecast for Others, 2020-2030 (US$ billion, AGR%)
Figure 71 “W” Shaped Recovery: Asia Pacific Gigafactory Market Forecast for EV Battery & Assembly, 2020-2030 (US$ billion, AGR%)
Figure 72 “W” Shaped Recovery: Asia Pacific Gigafactory Market Forecast for Others, 2020-2030 (US$ billion, AGR%)
Figure 73 “L” Shaped Recovery: Asia Pacific Gigafactory Market Forecast for EV Battery & Assembly, 2020-2030 (US$ billion, AGR%)
Figure 74 “L” Shaped Recovery: Asia Pacific Gigafactory Market Forecast for Others, 2020-2030 (US$ billion, AGR%)
Figure 75 China Gigafactory Market Forecast 2020-2030 (US$ billion, AGR %)
Figure 76 “V”-Shaped Recovery: China Gigafactory Market, Revenue Forecast 2020-2030 (US$ billion, AGR%)
Figure 77 “U”-Shaped Recovery: China Gigafactory Market, Revenue Forecast 2020-2030 (US$ billion, AGR%)
Figure 78 “W”-Shaped Recovery: China Gigafactory Market, Revenue Forecast 2020-2030 (US$ billion, AGR%)
Figure 79 “L”-Shaped Recovery: China Gigafactory Market, Revenue Forecast 2020-2030 (US$ billion, AGR%)
Figure 80 Japan Gigafactory Market Forecast 2020-2030 (US$ billion, AGR %)
Figure 81 “V”-Shaped Recovery: Japan Gigafactory Market, Revenue Forecast 2020-2030 (US$ billion, AGR%)
Figure 82 “U”-Shaped Recovery: Japan Gigafactory Market, Revenue Forecast 2020-2030 (US$ billion, AGR%)
Figure 83 “W”-Shaped Recovery: Japan Gigafactory Market, Revenue Forecast 2020-2030 (US$ billion, AGR%)
Figure 84 “L”-Shaped Recovery: Japan Gigafactory Market, Revenue Forecast 2020-2030 (US$ billion, AGR%)
Figure 85 South Korea Gigafactory Market Forecast 2020-2030 (US$ billion, AGR %)
Figure 86 “V”-Shaped Recovery: South Korea Gigafactory Market, Revenue Forecast 2020-2030 (US$ billion, AGR%)
Figure 87 “U”-Shaped Recovery: South Korea Gigafactory Market, Revenue Forecast 2020-2030 (US$ billion, AGR%)
Figure 88 “W”-Shaped Recovery: South Korea Gigafactory Market, Revenue Forecast 2020-2030 (US$ billion, AGR%)
Figure 89 “L”-Shaped Recovery: South Korea Gigafactory Market, Revenue Forecast 2020-2030 (US$ billion, AGR%)
Figure 90 Rest of Asia Pacific Gigafactory Market Forecast 2020-2030 (US$ billion, AGR %)
Figure 91 “V”-Shaped Recovery: Rest of Asia Pacific Gigafactory Market, Revenue Forecast 2020-2030 (US$ billion, AGR%)
Figure 92 “U”-Shaped Recovery: Rest of Asia Pacific Gigafactory Market, Revenue Forecast 2020-2030 (US$ billion, AGR%)
Figure 93 “W”-Shaped Recovery: Rest of Asia Pacific Gigafactory Market, Revenue Forecast 2020-2030 (US$ billion, AGR%)
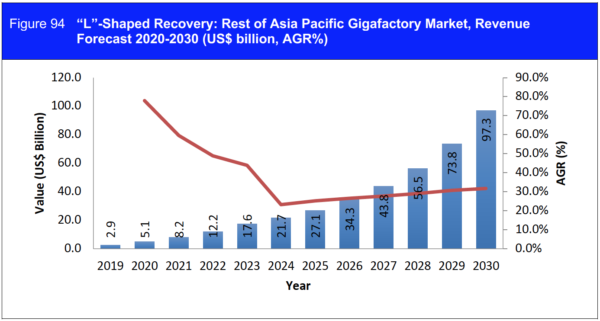
Figure 94 “L”-Shaped Recovery: Rest of Asia Pacific Gigafactory Market, Revenue Forecast 2020-2030 (US$ billion, AGR%)
Figure 95 Gigafactory Market: Company Share Analysis (%), 2019
Figure 96 Tesla Inc., Total Company Revenue,($bn & AGR %), 2015-2019
Figure 97 Tesla Inc., Revenue %Share, by Business Segment, 2019
Figure 98 Tesla Inc., U.S. Electric Vehicles Statistics, January-November 2019
Figure 99 LG Chem, Revenue, ($bn & AGR %), 2017-2019
Figure 100 LG Chem, Revenue %Share, by Business Segment, 2019
Figure 101 LG Chem, Revenue %Share, by Geography Segment, 2018
Figure 102 Contemporary Amperex Technology Co. Limited, Sales (GWh) Volume (2016-2019)
Figure 103 BYD Co Ltd, Revenue, ($bn & AGR %), 2015-2018
Figure 104 BYD Co Ltd, Revenue %Share, by Business Segment, 2018
Figure 105 BYD Co Ltd, Revenue %Share, by Geographical Segment, 2018
Figure 106 BYD Co Ltd, Electric Vehicle Sales Statistics (2013-2018)
Figure 107 SAMSUNG SDI CO., LTD., Revenue, ($bn & AGR %), 2016-2019
Figure 108 SAMSUNG SDI CO., LTD., Revenue %Share, by Business Segment, 2019
Figure 109 SAMSUNG SDI CO., LTD., Revenue %Share, by Geographical Segment, 2019
Figure 110 Toshiba International Corporation Total Company Revenue, ($bn & AGR %), 2015-2019
Figure 111 Toshiba International Corporation % Revenue Share, by Regional Segment, 2019
Figure 112 Toshiba International Corporation % Revenue Share, by Business Segment, 2019
Figure 113 Saft, % Revenue Share, by Business Segment, 2018
Figure 114 Dalian CBAK Power Battery Co., Ltd., Revenue, ($Mn & AGR %), 2016-2019
Figure 115 Dalian CBAK Power Battery Co., Ltd., % Revenue Share, by Business Segment, 2019
Figure 116 Dalian CBAK Power Battery Co., Ltd., % Revenue Share, by Geographical Segment, 2019
Figure 117 Panasonic Corporation, Revenue,($bn & AGR %), 2017-2019
Figure 118 Panasonic Corporation, Revenue %Share, by Geography Segment, 2019
Figure 119 Global Gigafactory Market Forecast 2020,2025,2030