Industries > Automotive > Automotive Composites Market Report 2020-2030
Automotive Composites Market Report 2020-2030
Global Industry Size, Share, Trends, Sub Segments, Growth Factors, Key Country Analyses with Competitive Landscape
This report evaluates the current levels of global investment in the Automotive Composites market. Over the next decade, this industry will register strong, stable growth.
Visiongain forecasts that the automotive composite market has been witnessing a positive growth owing to rising production in Asia Pacific, Europe and Central & South America. Growing preference for higher fuel-efficiency in passenger cars, product differentiation with vehicle aesthetics, and rising vehicle production is expected to drive the industry over the forecast period.
Exponential economic growth of various developed and developing countries such as the U.S., Germany, the UK, China, India, UAE, etc. has driven concerns regarding sustainability and carbon emission levels. Increasing awareness regarding application of lightweight materials to manufacture interior and exterior automotive components, thereby reducing overall fuel consumption are other factors likely to drive market growth. Automotive composites consumption has witnessed a steady rise, mainly in the U.S. which has 800 vehicles per 1,000 people.
Rapid industrialisation and growing disposable consumer income in emerging economies such as China & India led to greatest market share in Asia Pacific. Increasing demand for lightweight, fuel-efficient vehicles lead to focused manufacturer efforts towards automotive composite applications in this region. Increasing partnerships, agreements, and numerous product launches made APAC a favourable market for automotive composite investments.
The global automotive composites market has a moderate number of vendors with a limited number of players involved in the production of each composite type. Thus, the competition between the players is intense, and there are high barriers to entry into the market. The entry into the market is also difficult due to the high initial investment required by the new entrants and the similarity of the products offered by the different vendors. The products are similar because they were developed for the same target customers, that is, automotive OEMs and other key automakers. To lure the automotive end-users to buy their products and also to enhance their market position, the key vendors implement various types of business strategies like product development, product differentiation, and strategic pricing
Report Scope
View detailed company profiles of key players within the market with analysis of their product portfolios and strategies.
• BASF
• DOW Inc.
• Gurit
• SGl group
• Solvey Group
• Mitsubishi Chemical Corporation
• Hexcel
• Teijin Limited
• Toray
• UFP Technologies
• Huntsman
• Advanced Composites Group
• Scott Bader
Review the Automotive Composites Market 2020-2030
See Forecasts for Regional Automotive Composites Market from 2020-2030
• US Automotive Composites Market Forecast 2020-2030
• Canada Automotive Composites Market Forecast 2020-2030
• Mexico Automotive Composites Market Forecast 2020-2030
• Germany Automotive Composites Market Forecast 2020-2030
• France Automotive Composites Market Forecast 2020-2030
• UK Automotive Composites Market Forecast 2020-2030
• Italy Automotive Composites Market Forecast 2020-2030
• Spain Automotive Composites Market Forecast 2020-2030
• China Automotive Composites Market Forecast 2020-2030
• Japan Automotive Composites Market Forecast 2020-2030
• India Automotive Composites Market Forecast 2020-2030
• South Korea Automotive Composites Market Forecast 2020-2030
• Brazil Automotive Composites Market Forecast 2020-2030
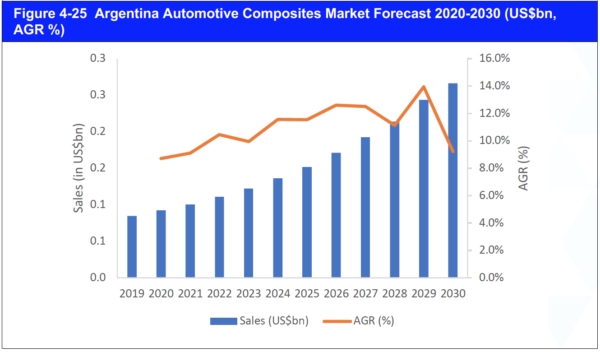
• Argentina Automotive Composites Market Forecast 2020-2030
View details of latest developments For Automotive Composites Market
Regulation, emerging market growth and other factors have had a quantifiable effect on the market. This report covers developments such as these, as well as other factors that could affect automotive composites technologies market and the wider aviation sector. By also covering the below submarkets, the report gives readers a concise overview of the market:
Examine Automotive Composites Forecast by Submarket 2020-2030
• By Composite Material:
• Polymer Matrix Composites (PMC)
• Metal Matrix Composites (MMC)
• Ceramic Matrix Composites (CMC)
• By Automotive Component
• Interior Components
• Body Components
• Engine & Drivetrain Components
• Other Components
Detailed Analysis of the Polymer Matrix Composites (PMC) submarket
• By Type of Polymer Material:
• Carbon Fibre Reinforced Polymer (CFRP)
• Glass Fibre Reinforced Polymer (GFRP)
• Aramid Fibre Reinforced Polymer (AFRP)
• By Resin:
• Thermoplastics
• Thermosets
• By End-use:
• Cars (Conventional, Electric),
• Trucks & Buses
• By Manufacturing Process:
• Compression Molding
• Injection Molding
• Sheet Molding
• Resin Transfer Molding
Detailed information on Automotive Composites market can be used to help develop your business plans and strategy. Visiongain’s report provides clarity and a comprehensive overview of the market. Concise analysis supports Visiongain’s conclusions, and our market evaluations will help you when considering the Military Stealth Technologies market.
Why you should read this report:
The report will prove invaluable for anyone wanting to better understand the military stealth technologies industry and its underlying dynamics. It will prove useful for businesses who wish to expand into different sectors or explore a new region for expansion of their existing operations. The report comprehensively lays out the market drivers and restraints, market forecasts, technologies, investments, leading companies and their strategies, as well as market investment status, and risks and trends to help the reader formulate a better-informed business strategy. This report will be ideal for senior executives, business development managers, marketing managers, consultants, CEOs, CIOs, COOs, and Directors. Furthermore, governments, agencies and organisations will also find value in our research report.
Buy our report today Automotive Composites Market Report 2020-2030: Global Industry Size, Share, Trends, Sub Segments, Growth Factors, Key Country Analyses with Competitive Landscape. Avoid missing out by staying informed – order our report now.
Visiongain is a trading partner with the US Federal Government
CCR Ref number: KD4R6
Do you have any custom requirements we can help you with? Any need for specific country, geo region, market segment or specific company information? Contact us today, we can discuss your needs and see how we can help: sara.peerun@visiongain.com
1. Global Automotive Composites Market 2020-2030 Overview
1.1 Why You Should Read This Report
1.2 What This Report Delivers
1.3 Key Questions Answered By This Analytical Report Include:
1.4 Who is This Report For?
1.5 Methodology
1.6 Frequently Asked Questions (FAQs)
1.7 Associated Visiongain Reports
1.8 About Visiongain
2 Introduction to the Automotive Composites Market
2.1 Opportunities for the Automotive Composites Market: Light-weighting, Fuel Efficiency, Durability & Emission Reduction
2.2 Automotive Composites Market Definition
2.2.1 Composite Materials Definition
2.2.2 Global Automotive Composites Market Definition
2.3 Automotive Composites Market Segmentation
2.3.1 Automotive Composites Market Segmentation-By Type of Composite Materials
2.3.2 Polymer Matrix Composites
2.3.3 Carbon Fibre Reinforced Polymer(CFRP)
2.3.4 Metal Matrix Composites
2.3.5 Ceramic Matrix Composites
2.3.6 Automotive Composites Market Segmentation-By Type of Composite Components
2.3.7 Interior Components Submarket
2.3.8 Body Components Submarket
2.3.9 Engine & Drivetrain Components Submarket
2.3.10 Other Components Submarket
2.4 Penetration and growth prospect mapping
3 Global Automotive Composites Market Forecast 2020-2030
3.1 Global Automotive Composites Market Overview
3.2 Historical Trends for Composite Materials In Automotive Industry
3.2.1 Learn What Drives the Growth of the Automotive Composites Market between 2020 and 2030
3.2.2 Challenges faced by the Global Automotive Composites Market
3.2.3 Key Opportunities
3.2.4 Market Trends
3.2.5 Five Force Analysis
3.2.6 Industry analysis - Porter’s
3.2.7 Industry analysis – PESTEL
3.3 Global Automotive Composites Market Size Forecast 2020-2030 by Composite Materials
3.3.1 Automotive Polymer Matrix Composites (PMC) Submarket Forecast 2020-2030
3.3.2 Automotive Polymer Matrix Composites Submarket Overview 2020-2030
3.3.3 Automotive Polymer Matrix Composites Drivers & Restraints
3.4 Automotive Polymer Matrix Composites (PMC) Submarket Revenue Forecast 2020-2030 by Type of Polymer Fibre
3.4.1 Automotive Carbon Fibre Reinforced Polymer (CFRP) Submarket Forecast 2020-2030
3.5 Automotive Glass Fibre Reinforced Polymer (GFRP) Submarket Forecast 2020-2030
3.5.2 Automotive Aramid Fibre Reinforced Polymer (AFRP) Submarket Forecast 2020-2030
3.5.3 Automotive Aramid Fibre Reinforced Polymer (AFRP) Submarket Overview 2020-2030
3.5.4 Automotive Polymer Matrix Composites Submarket Revenue Forecast 2020-2030 by Thermoplastic or Thermosetting Polymer
1.1.1 Automotive Thermoplastic Polymer Matrix Composites (PMC) Submarket Forecast 2020-2030
3.5.5 Automotive Thermoset Polymer Matrix Composites (PMC) Submarket Forecast 2020-2030
3.5.6 Automotive Polymer Matrix Composites (PMC) Submarket Revenue Forecast 2020-2030 by End Use
3.5.7 Automotive Polymer Matrix Composites (PMC) Submarket Forecast for Conventional Vehicles 2020-2030
3.5.8 Automotive Polymer Matrix Composites (PMC) Submarket Forecast for Electrical Vehicles 2020-2030
1.1.2 Automotive Polymer Matrix Composites (PMC) Submarket Forecast for Trucks & Buses 2020-2030
3.5.9 Automotive Polymer Matrix Composites (PMC) Submarket Revenue Forecast 2020-2030 by Manufacturing Process
3.5.10 Automotive Polymer Matrix Composites (PMC) Submarket Forecast for Compression Moulding 2020-2030
3.5.11 Automotive Polymer Matrix Composites (PMC) Submarket Forecast for Injection Moulding 2020-2030
3.5.12 Automotive Polymer Matrix Composites (PMC) Submarket for Injection Moulding Overview 2020-2030
3.5.13 Automotive Polymer Matrix Composites (PMC) Submarket Forecast for Resin Transfer Moulding 2020-2030
3.5.14 Automotive Polymer Matrix Composites (PMC) Submarket Forecast for Sheet Moulding 2020-2030
3.5.15 Automotive Metal Matrix Composites (MMC) Submarket Forecast 2020-2030
3.5.16 Automotive Ceramic Matrix Composites (CMC) Submarket Forecast 2020-2030
3.6 Global Automotive Composites Market Revenue Forecast 2020-2030 by Composite Components
3.6.1 Automotive Composite Interior Components Submarket Forecast 2020-2030
3.6.2 Automotive Composite Body Components Submarket Forecast 2020-2030
3.6.3 Automotive Composite Engine & Drivetrain Components Submarket Forecast 2020-2030
3.6.4 Other Automotive Composite Components Submarket Forecast 2020-2030
4 Regional and Leading National Automotive Composites Market Forecasts 2020-2030
4.1 Global Automotive Composites Market by National Market Share Forecast 2020-2030
4.2 United States Automotive Composites Market Forecast 2020-2030
4.2.1 Second Largest Producer and Consumer of Automobiles in the Word
4.3 Canada Automotive Composites Market Forecast 2020-2030
4.3.1 Canada’s automotive industry is largely driven by export sales
4.4 Mexico Automotive Composites Market Forecast 2020-2030
4.4.1 Mexico automotive industry export is ~80% of total production
4.5 Germany Automotive Composites Market Forecast 2020-2030
4.5.1 Germany has a mature automotive market
4.6 France Automotive Composites Market Forecast 2020-2030
4.6.1 Polymer Matrix Composites (PMC) is the largest product segment
4.7 United Kingdom Automotive Composites Market Forecast 2020-2030
4.7.1 UK is the fourth-largest automotive manufacturer in EU
4.8 Italy Automotive Composites Market Forecast 2020-2030
4.8.1 Automotive sector accounts for 20% of Italy's gross value added in industry
4.9 Rest of Europe (RoE) Automotive Composites Market Forecast 2020-2030
4.9.1 Spain
4.10 China Automotive Composites Market Forecast 2020-2030
4.10.1 China Automotive Composites Market Drivers & Restraints
4.10.2 The China market was accounted for the largest market share in terms of both value and volume
4.11 Japan Automotive Composites Market Forecast 2020-2030
4.11.1 Japan Automotive Composites Market Drivers & Restraints
4.11.2 Japan is one of the top three major producer for automobiles with focus on innovation, quality and meeting standards
4.12 India Automotive Composites Market Forecast 2020-2030
4.12.1 India Automotive Composites Market Drivers & Restraints
4.12.2 Major global OEMs have made India a component sourcing hub for their global operations
4.13 South Korea Automotive Composites Market Forecast 2020-2030
4.13.1 South Korea Automotive Composites Market Drivers & Restraints
4.13.2 South Korea is overcoming constraints by strengthening future car “ecosystem”
4.14 Brazil Automotive Composites Market Forecast 2020-2030
4.14.1 Focus on lightweight vehicle technology is expected to boost the automotive composites in Brazil
4.15 Argentina Automotive Composites Market Forecast 2020-2030
4.15.1 Stringent environmental regulations on pollution and carbon emissions are necessitating heavy investments in the automotive composites
5 Value chain analysis
5.1 Automotive Composites Value Chain Analysis
5.2 Market dynamics
6 Leading Companies in the Automotive Composites Market
6.1 Competitive Environment
6.2 Strategy Framework
6.3 Heat Map Analysis for Automotive Polymer Matrix Composites Market
6.4 BASF
6.4.1 BASF Total Company Sales 2014-2018
1.1.3 BASF Sales by Segment of Business 2017-2018
6.4.2 BASF Total Company Net Income 2014-2018
6.4.3 BASF Automotive Composites Products / Services
6.4.4 BASF Primary Market Competitors 2020
6.4.5 BASF. Latest Developments
6.4.6 BASF. Mergers & Acquisitions (M&A) Activity
6.4.7 BASF Analysis
6.4.8 BASF Future Outlook
6.5 DOW Inc.
6.5.1 DOW Inc. Total Company Sales 2015-2019
6.5.2 DOW Inc. Sales by Segment of Business 2018-2019
6.5.3 DOW Inc. Automotive Composites Products / Services
6.5.4 DOW Inc. Primary Market Competitors 2020
6.5.5 DOW Inc. Latest Developments
6.5.6 DOW Inc. Analysis
6.5.7 .DOW Inc. Future Outlook
6.6 Gurit
6.6.1 Gurit Total Company Sales 2015-2018
6.6.2 Gurit Sales by Segment of Business 2017-2018
6.6.3 Gurit Sales by Geographical Location
6.6.4 Gurit Automotive Composites Products / Services
6.6.5 Gurit Primary Market Competitors 2020
6.6.6 Gurit Mergers & Acquisitions (M&A) Activity
6.6.7 Gurit Latest Developments
6.6.8 Gurit Analysis
6.6.9 Gurit Future Outlook
6.7 Hexcel
6.7.1 Hexcel Total Company Sales 2014-2018
6.7.2 Hexcel Sales by Segment of Business 2016-2018
6.7.3 Hexcel Total Company Net Income 2014-2018
6.7.4 Hexcel Automotive Composites Products / Services
6.7.5 Hexcel Primary Market Competitors 2020
6.7.6 Hexcel Mergers & Acquisitions (M&A) Activity
6.7.7 Hexcel Latest Developments
6.7.8 Hexcel Analysis
6.7.9 Hexcel Future Outlook
6.8 Mitsubishi Chemical Corporation
6.8.1 Mitsubishi Chemical Corporation Total Company Sales 2015-2018
6.8.2 Mitsubishi Chemical Corporation Sales by Segment of Business 2017-2018
6.8.3 Mitsubishi Chemical Corporation Automotive Composites Products / Services
6.8.4 Mitsubishi Chemical Corporation Primary Market Competitors 2020
6.8.5 Mitsubishi Chemical Corporation Mergers & Acquisitions (M&A) Activity
6.8.6 Mitsubishi Chemical Corporation Latest Developments
6.8.7 Mitsubishi Chemical Corporation Analysis
6.8.8 Mitsubishi Chemical Corporation Future Outlook
6.9 SGL Group
6.9.1 SGL Group Total Company Sales 2015-2018
6.9.2 SLG Group Sales by Segment of Business 2017-2018
6.9.3 SGL Group Sales by Geographical Location 2017-18
6.9.4 SGL Group Automotive Composites Products / Services
6.9.5 SGL Group Primary Market Competitors 2020
6.9.6 SGLGroup Latest Developments
6.9.7 SGL Group Analysis
6.9.8 SGL Group Future Outlook
6.10 Solvey Group
6.10.1 Solvey Group Total Company Sales 2015-2018
6.10.2 Solvey Group Sales by Segment of Business 2017-2018
6.10.3 Solvey Group Sales by Geographical Location 2017-18
6.10.4 Solvey Group Organisational Structure
6.10.5 Solvey Group Automotive Composites Products / Services
6.10.6 Solvey Group Primary Market Competitors 2020
6.10.7 Solvey Group Mergers & Acquisitions (M&A) Activity
6.10.8 Solvey Group Latest Developments
6.10.9 Solvey Group Analysis
6.10.10 Solvey Group Future Outlook
6.11 Teijin Limited
6.11.1 Teijin Limited Total Company Sales 2015-2019
6.11.2 Teijin Limited Sales by Segment of Business 2018-2019
6.11.3 Teijin Limited Sales by Geographical Location
6.11.4 Teijin Limited Automotive Composites Products / Services
6.11.5 Teijin Limited Primary Market Competitors 2020
6.11.6 Figure 5 33Teijin Limited Primary Market Competitors 2020
6.11.7 Teijin Limited Mergers & Acquisitions (M&A) Activity
6.11.8 Teijin Latest Developments
6.11.9 Teijin Limited Analysis
6.11.10 Teijin Limited Future Outlook
6.12 Toray
6.12.1 Toray Total Company Sales 2015-2019
6.12.2 Toray Sales by Segment of Business 2015-2019
6.12.3 Toray Sales by Geographical Location 2017-18
6.12.4 Toray Total Company Net Income 2018-2019
6.12.5 Toray Automotive Composites Products / Services
6.12.6 Toray Primary Market Competitors 2020
6.12.7 Toray Mergers & Acquisitions (M&A) Activity
6.12.8 Toray Latest Developments
6.12.9 Toray Analysis
6.12.10 Toray Future Outlook
6.13 UFP Technologies, Inc.
6.13.1 UFP Technologies, Inc Total Company Sales 2014-2018
6.13.2 UFP Technologies, Inc. Sales by Segment of Business 2016-2018
6.13.3 UFP Technologies, Inc Total Company Net Income 2014-2018
6.13.4 UFP Technologies, Inc Automotive Composites Products / Services
6.13.5 UFP Technologies, Inc Primary Market Competitors 2020
6.13.6 UFP Technologies, Inc. Mergers & Acquisitions (M&A) Activity
6.13.7 UFP Technologies, Inc Analysis
6.13.8 UFP Technologies, Inc. Future Outlook
6.14 Huntsman
6.14.1 Huntsman Total Company Sales 2016-2019
6.14.2 Huntsman Sales by Segment of Business 2018-2019
6.14.3 Huntsman Automotive Composites Products / Services
6.14.4 Huntsman Primary Market Competitors 2020
6.14.5 HUNTSMAN Mergers & Acquisitions (M&A) Activity
6.14.6 Huntsman Latest Developments
6.14.7 Huntsman Analysis
6.14.8 Huntsman Future Oulook
6.15 Advanced Composites Group
6.15.1 ADVANCED COMPOSITES GROUP Automotive Composites Products / Services
6.15.2 ADVANCED COMPOSITES GROUP Latest Developments
6.15.3 ADVANCED COMPOSITES GROUP Analysis
6.16 Scott Bader
6.16.1 SCOTT BADER Automotive Composites Products / Services
6.16.2 SCOTT BADER Primary Market Competitors 2020
6.16.3 SCOTT BADER. Mergers & Acquisitions (M&A) Activity
6.16.4 Scott Bader Latest Developments
6.16.5 SCOTT BADER Analysis
6.16.6 SCOTT BADER Future Outlook
7 Conclusions and Recommendations
7.1 Other Important Companies in the Automotive Composites Market
8 Glossary
8.1 Associated Visiongain Reports
List of Figures
Figure 2 1 Comparison of Historical and Enacted Passenger Car Fuel Economy Standards
Figure 2 2 Global Automotive Composites Market Structure Overview
Figure 2 3 Global Automotive Composites Market by Type of Composite Materials
Figure 2 4 Picture of a Honeycomb structure made of carbon-fibre-reinforced polymer on a BMW i3
Figure 2 5 Picture of AMG Carbon Ceramic Brake Disc
Figure 2 6 Global Automotive Composites Market by Type of Composite Components
Figure 2 7 CFRP and Aramid Fibre interior on JaguarXJR-15
Figure 2 8 Cut-out of BMW Turbo-Charged Engine
Figure 3 1 Global Automotive Composites Market Revenue Forecast 2020-2030 (US$bn, AGR%)
Figure 3 2 Global Automotive Composites Market Volume Forecast 2020-2030 (KT,AGR %)
Figure 3 3 Milestones and recent examples of composites applied to the automotive sector
Figure 3 4 Five Force Analysis
Figure 3 5 Porter’s Analysis
Figure 3 6 PESTEL Analysis
Figure 3 7 Global Automotive Composites Market Segmentation by Type of Composite Material
Figure 3 8 Global Automotive Composites Submarket Revenue Share 2020-2030 by Composite Materials (%)
Figure 3 9 – Global Automotive Composites Submarket Share Forecast, 2020 (% Share)
Figure 3 10 – Global Automotive Composites Submarket Share Forecast, 2025 (% Share)
Figure 3 11 – Global Automotive Composites Submarket Share Forecast, 2030 (% Share)
Figure 3 12 Global Automotive Composites Submarket AGR Forecast, 2020-2030 (AGR%)
Figure 3 13– Global Automotive Composites Submarket Forecast by Volume, 2020-2030 (KT, Global AGR %)
Figure 3 14 – Global Automotive Composites Submarket Share Forecast by Volume, 2020 (% Share)
Figure 3 15 – Global Automotive Composites Submarket Share Forecast by Volume, 2025 (% Share)
Figure 3 16 – Global Automotive Composites Submarket Share Forecast by Volume, 2030 (% Share)
Figure 3 17 Automotive Polymer Matrix Composites Submarket Revenue Forecast 2020-2030 (US$bn, AGR%)
Figure 3 18 Automotive Polymer Matrix Composites Submarket Volume Forecast 2020-2030 (KT, AGR%)
Figure 3 19 Automotive Polymer Matrix Composites (PMC) Submarket Segmentation by Type of Fibre & Resin
Figure 3 20 Automotive Polymer Matrix Composites Submarket Revenue Share Forecast 2020-2030 by Type of Polymer Fibre (%)
Figure 3 21 Automotive Polymer Matrix Composites Submarket AGR by Type of Polymer Fibre (%)
Figure 3 22 – Automotive Polymer Matrix Composites Submarket Revenue Share Forecast 2020 by Type of Polymer Fibre
Figure 3 23 – Automotive Polymer Matrix Composites Submarket Revenue Share Forecast 2025 by Type of Polymer Fibre
Figure 3 24 – Automotive Polymer Matrix Composites Submarket Revenue Share Forecast 2030 by Type of Polymer Fibre
Figure 3 25Automotive Polymer Matrix Composites Submarket Volume Forecast 2020-2030 by Type of Polymer Fibre(KT), Share%)
Figure 3 26 – Automotive Polymer Matrix Composites Submarket Volume Share Forecast 2020 (%) by Type of Polymer Fibre
Figure 3 27 Automotive Polymer Matrix Composites Submarket Volume Share Forecast 2025 (%) by Type of Polymer Fibre
Figure 3 28 – Automotive Polymer Matrix Composites Submarket Volume Share Forecast 2030 (%) by Type of Polymer Fibre
Figure 3 29 Automotive Carbon Fibre Reinforced Polymer (CFRP) Submarket Revenue Forecast 2020-2030 (US$bn, AGR%)
Figure 3 30 Automotive Carbon Fibre Reinforced Polymer (CFRP) Submarket Volume Forecast 2020-2030 (KT, AGR%)
Figure 3 31 Automotive Glass Fibre Reinforced Polymer (GFRP) Submarket Revenue Forecast 2020-2030 (US$bn, AGR%)
Figure 3 32 Automotive Glass Fibre Reinforced Polymer (GFRP) Submarket Volume Forecast 2020-2030 (KT, AGR%)`
Figure 3 33 Automotive Aramid Fibre Reinforced Polymer (GFRP) Submarket Revenue Forecast 2020-2030 (US$bn, AGR%)
Figure 3 34 Automotive Aramid Fibre Reinforced Polymer (GFRP) Submarket Volume Forecast 2020-2030 (US$bn, AGR%)
Figure 3 35 Polymer Matrix Composites (PMC) Submarket Segmentation by Thermoplastic or Thermosetting Polymer
Figure 3 36 Automotive Polymer Matrix Composites Market Revenue Share Forecast 2020-2030 by Thermoplastic or Thermosetting Polymer (%)
Figure 3 37 – Automotive Thermoset Polymer Matrix Composites (PMC) Submarket Volume Share Forecast 2020(%)
Figure 3 38 Automotive Thermoset Polymer Matrix Composites (PMC) Submarket Volume Share Forecast 2025 (%)
Figure 3 39 Automotive Thermoset Polymer Matrix Composites (PMC) Submarket Volume Share Forecast 2030 (%)
Figure 3 40 Automotive Polymer Matrix Composites Market Volume Forecast 2020-2030 by Thermoplastic or Thermosetting Polymer (KT, AGR%)
Figure 3 41 Automotive Thermoplastic Polymer Matrix Composites (PMC) Submarket Revenue Forecast 2020-2030 (US$bn, AGR%)
Figure 3 42 Automotive Thermoplastic Polymer Matrix Composites (PMC) Submarket Volume Forecast 2020-2030(KT, AGR%)
Figure 3 43 Automotive Thermoset Polymer Matrix Composites (PMC) Submarket Value Forecast 2020-2030 (US$bn, AGR%)
Figure 3 44 Automotive Thermoset Polymer Matrix Composites (PMC) Submarket Volume Forecast 2020-2030 (KT, AGR%)
Figure 3 45Automotive Polymer Matrix Composites (PMC) Submarket Segmentation by End Use
Figure 3 46 Automotive Polymer Matrix Composites Submarket Revenue Share Forecast 2020-2030 by End Use (%)
Figure 3 47 Automotive Polymer Matrix Composites Submarket AGR by End Use (%)
Figure 3 48 – Automotive Polymer Matrix Composites Submarket Revenue Share Forecast 2020 by End Use
Figure 3 49 – Automotive Polymer Matrix Composites Submarket Revenue Share Forecast 2025 by End Use
Figure 3 50 – Automotive Polymer Matrix Composites Submarket Revenue Share Forecast 2030 by End Use
Figure 3 51Automotive Polymer Matrix Composites Submarket Volume Forecast 2020-2030 by End Use Application (KT), Share%)
Figure 3 52 – Automotive Polymer Matrix Composites Submarket Volume Share Forecast 2020 (%) by End Use Application
Figure 3 53 Automotive Polymer Matrix Composites Submarket Volume Share Forecast 2025 (%) by End Use Application
Figure 3 54 – Automotive Polymer Matrix Composites Submarket Volume Share Forecast 2030 (%) by End Use Application
Figure 3 55 Automotive Polymer Matrix Composites (PMC) Submarket Revenue Forecast for Conventional Vehicles 2020-2030 (US$bn,AGR%)
Figure 3 56 Automotive Polymer Matrix Composites (PMC) Submarket Volume Forecast for Conventional Vehicles 2020-2030 (KT, AGR%)
Figure 3 57 Automotive Polymer Matrix Composites (PMC) Submarket Revenue Forecast for Electrical Vehicles 2020-2030 (US$bn,AGR%)
Figure 3 58 Automotive Polymer Matrix Composites (PMC) Submarket Volume Forecast for Electrical Vehicles 2020-2030 (KT, AGR%)
Figure 3 59 Automotive Polymer Matrix Composites (PMC) Submarket Revenue Forecast for Trucks & Buses 2020-2030 (US$bn,AGR%)
Figure 3 60 Automotive Polymer Matrix Composites (PMC) Submarket Volume Forecast for Trucks & Buses 2020-2030 (KT, AGR%)
Figure 3 61Automotive Polymer Matrix Composites (PMC) Submarket Segmentation by Manufacturing Process
Figure 3 62 Automotive Polymer Matrix Composites Submarket Revenue Share Forecast 2020-2030 by Manufacturing Process (%)
Figure 3 63 Automotive Polymer Matrix Composites Submarket AGR by Manufacturing Process (%)
Figure 3 64 – Automotive Polymer Matrix Composites Submarket Revenue Share Forecast 2020 by Manufacturing Process
Figure 3 65 – Automotive Polymer Matrix Composites Submarket Revenue Share Forecast 2025 by Manufacturing Process
Figure 3 66 – Automotive Polymer Matrix Composites Submarket Revenue Share Forecast 2030 by Manufacturing Process
Figure 3 67Automotive Polymer Matrix Composites Submarket Volume Forecast 2020-2030 by Manufacturing Process (KT), Share%)
Figure 3 68 – Automotive Polymer Matrix Composites Submarket Volume Share Forecast 2020 (%) by Manufacturing Process
Figure 3 69 Automotive Polymer Matrix Composites Submarket Volume Share Forecast 2025 (%) by Manufacturing Process
Figure 3 70 – Automotive Polymer Matrix Composites Submarket Volume Share Forecast 2030 (%) by Manufacturing Process
Figure 3 71 Automotive Polymer Matrix Composites (PMC) Submarket Revenue Forecast for Compression Molding 2020-2030 (US$bn,AGR%)
Figure 3 72 Automotive Polymer Matrix Composites (PMC) Submarket Volume Forecast for Compression Molding 2020-2030 (KT, AGR%)
Figure 3 73 Automotive Polymer Matrix Composites (PMC) Submarket Revenue Forecast for Injection Moulding 2020-2030 (US$bn,AGR%)
Figure 3 74 Automotive Polymer Matrix Composites (PMC) Submarket Volume Forecast for Injection Moulding 2020-2030 (KT, AGR%)
Figure 3 75 Automotive Polymer Matrix Composites (PMC) Submarket Revenue Forecast for Resin Transfer Moulding 2020-2030 (US$bn,AGR%)
Figure 3 76 Automotive Polymer Matrix Composites (PMC) Submarket Volume Forecast for Resin Transfer Moulding 2020-2030 (KT, AGR%)
Figure 3 77 Automotive Polymer Matrix Composites (PMC) Submarket Revenue Forecast for Sheet Moulding 2020-2030 (US$bn,AGR%)
Figure 3 78 Automotive Polymer Matrix Composites (PMC) Submarket Volume Forecast for Sheet Moulding 2020-2030 (KT, AGR%)
Figure 3 45 Automotive Metal Matrix Composites Submarket Revenue Forecast 2020-2030 (US$bn, AGR%)
Figure 3 46Automotive Metal Matrix Composites Submarket Revenue Share Forecast 2020 (%)
Figure 3 47 Automotive Metal Matrix Composites Submarket Revenue Share Forecast 2025 (%)
Figure 3 48 Automotive Metal Matrix Composites Submarket Revenue Share Forecast 2030 (%)
Figure 3 49 Automotive Metal Matrix Composites Submarket Volume Forecast 2020-2030 (KT, AGR%)
Figure 3 50 Automotive Metal Matrix Composites Submarket Volume Share Forecast 2020
Figure 3 51 Automotive Metal Matrix Composites Submarket Volume Share Forecast 2025
Figure 3 52 Automotive Metal Matrix Composites Submarket Volume Share Forecast 2030
Figure 3 53Automotive Ceramic Matrix Composites Submarket Revenue Forecasts 2020-2030 (US$bn, AGR%)
Figure 3 54 Automotive Metal Matrix Composites Submarket Revenue Forecast 2020-2030 (US$bn, AGR%)
Figure 3 55 Automotive Ceramic Matrix Composites Submarket Revenue Share Forecast 2020 (%)
Figure 3 56 Automotive Ceramic Matrix Composites Submarket Revenue Share Forecast 2025 (%)
Figure 3 57 Automotive Ceramic Matrix Composites Submarket Revenue Share Forecast 2030 (%)
Figure 3 58 Automotive Ceramic Matrix Composites Submarket Volume Forecasts 2020-2030 (KT, AGR%)
Figure 3 59Automotive Metal Matrix Composites Submarket Volume Share Forecast 2020
Figure 3 60 Automotive Metal Matrix Composites Submarket Volume Share Forecast 2025
Figure 3 61 Automotive Metal Matrix Composites Submarket Volume Share Forecast 2030
Figure 3 62 Global Automotive Composites Market Revenue Share Forecast by Composite Components , 2020 (%)
Figure 3 63 Global Automotive Composites Market Revenue Share Forecast by Composite Components , 2025 (%)
Figure 3 64 Global Automotive Composites Market Revenue Share Forecast by Composite Components , 2030 (%)
Figure 3 65 Automotive Composite Interior Components Submarket Forecast 2020-2030 (US$bn, AGR%)
Figure 3 66 Automotive Composite Body Components Submarket Forecast 2020-2030 (US$bn, AGR%)
Figure 3 67 Automotive Composite Engine & Drivetrain Components Submarket Forecast 2020-2030 (US$bn, AGR%)
Figure 3 68 Other Automotive Composite Components Submarket Forecast 2020-2030 (US$bn, AGR%)
Figure 3 69Global Automotive Composites Market by National MarketForecast 2020-2030 (US$bn, Global AGR %)
Figure 3 70Global Automotive Composites Market by National Market AGR Forecast 2020-2030 (AGR %)
Figure 3 71 Leading National Automotive Composites Market CAGR Forecast 2020-2025 (CAGR %)
Figure 3 72 Leading National Automotive Composites Market CAGR Forecast 2025-2030 (CAGR %)
Figure 3 73 Leading National Automotive Composites Market CAGR Forecast 2020-2030 (CAGR %)
Figure 3 74Global Automotive Composites Market by National Market Share Forecast 2020 (% Share)
Figure 3 75Global Automotive Composites Market by National Market Share Forecast 2025 (% Share)
Figure 3 76Global Automotive Composites Market by National Market Share Forecast 2030 (% Share)
Figure 3 77National Automotive Composites Market Percentage Change in Market Share 2020-2025 (% Change)
Figure 3 78National Automotive Composites Market Percentage Change in Market Share 2025-2030 (% Change)
Figure 3 79National Automotive Composites Market Percentage Change in Market Share 2020-2030 (% Change)
Figure 3 80 US Automotive Composites Market Forecast 2020-2030 (US$bn, AGR %)
Figure 3 81 Canada Automotive Composites Market Forecast 2020-2030 (US$bn, AGR %)
Figure 3 82 Mexico Automotive Composites Market Forecast 2020-2030 (US$bn, AGR %)
Figure 3 83 Germany Automotive Composites Market Forecast 2020-2030 (US$bn, AGR %)
Figure 3 84 France Automotive Composites Market Forecast 2020-2030 (US$bn, AGR %)
Figure 3 85 United Kingdom Automotive Composites Market Forecast 2020-2030 (US$bn, AGR %)
Figure 3 86 Italy Automotive Composites Market Forecast 2020-2030 (US$bn, AGR %)
Figure 3 87 RoE Automotive Composites Market Forecast 2020-2030 (US$bn, AGR %)
Figure 3 88 China Automotive Composites Market Forecast 2020-2030 (US$bn, AGR %)
Figure 3 89 Japan Automotive Composites Market Forecast 2020-2030 (US$bn, AGR %)
Figure 3 90 India Automotive Composites Market Forecast 2020-2030 (US$bn, AGR %)
Figure 3 91 South Korea Automotive Composites Market Forecast 2020-2030 (US$bn, AGR %)
Figure 3 92 Brazil Automotive Composites Market Forecast 2020-2030 (US$bn, AGR %)
Figure 3 93 Argentina Automotive Composites Market Forecast 2020-2030 (US$bn, AGR %)
Figure 4 1 Automotive composites value chain analysis
Figure 4 2 Penetration Mapping by Application, Trucks
Figure 4 3Penetration Mapping by Application, Buses
Figure 4 4 Automotive composites market dynamics
Figure 5 1 Competitive Environment
Figure 5 2 Competitive Environment
Figure 5 3 Competitive Environment
Figure 5 4 BASF Total Company Sales 2014-2018 (US$mn, AGR %)
Figure 5 5BASF Sales by Segment of Business 2017-2018 (US$mn, Total Company Sales AGR %)
Figure 5 6 BASF Net Income 2014-2018 (US$mn, AGR %)
Figure 5 7BASF Primary Market Competitors 2020
Figure 5 8 DOW Inc. Total Company Sales 2015-2019 (US$mn, AGR %)
Figure 5 9DOW Inc. Primary Market Competitors 2020
Figure 5 10 Gurit Total Company Sales 2015-2018 (US$mn, AGR %)
Figure 5 11Gurit Sales by Segment of Business 2018-2019 (US$mn, Total Company Sales AGR %)
Figure 5 12Gurit Sales by Geographical Location 2017-2018 (US$mn, Total Company Sales AGR %)
Figure 5 13Gurit Primary Market Competitors 2020
Figure 5 14 Hexcel Total Company Sales 2014-2018 (US$mn, AGR %)
Figure 5 15Hexcel Sales by Segment of Business 2016-2018 (US$mn, Total Company Sales AGR %)
Figure 5 16 Hexcel Net Income 2014-2018 (US$mn, AGR %)
Figure 5 17Hexcel Primary Market Competitors 2020
Figure 5 18 Mitsubishi Chemical Corporation Total Company Sales 2015-2018 (US$mn, AGR %)
Figure 5 19Mitsubishi Chemical Corporation Sales by Segment of Business 2017-2018 (US$mn, Total Company Sales AGR %)
Figure 5 20Mitsubishi Chemical CorporationPrimary Market Competitors 2020
Figure 5 21 SGLGroup Total Company Sales 2015-2018 (US$mn, AGR %)
Figure 5 22SGLGroup Sales by Segment of Business 2017-2018 (US$mn, Total Company Sales AGR %)
Figure 5 23 SGL Group Sales by Geographical Location 2017-2018 (US$mn, Total Company Sales AGR %)
Figure 5 24 SGLGroup Primary Market Competitors 2020
Figure 5 25 Solvey Group Total Company Sales 2015-2018 (US$mn, AGR %)
Figure 5 26Solvey Group Sales by Segment of Business 2017-2019 (US$mn, Total Company Sales AGR %)
Figure 5 27Solvey Group Sales by Geographical Location 2018-2019 (US$mn, Total Company Sales AGR %)
Figure 5 28Solvey Group Organisational Structure 2020
Figure 5 29Solvey Group Primary Market Competitors 2020
Figure 5 30 Teijin Limited Total Company Sales 2015-2019 (US$mn, AGR %)
Figure 5 31 Teijin Limited Sales by Segment of Business 2018-2019 (US$mn, Total Company Sales AGR %)
Figure 5 32Teijin Limited Sales by Geographical Location 2018-2019 (US$mn, Total Company Sales AGR %)
6.11.6 Figure 5 33Teijin Limited Primary Market Competitors 2020
Figure 5 34 Toray Total Company Sales 2015-2019 (US$mn, AGR %)
Figure 5 35Toray Sales by Segment of Business 2015-2019 (US$mn, Total Company Sales AGR %)
Figure 5 36Toray Sales by Geographical Location 2018-2019 (US$mn, Total Company Sales AGR %)
Figure 5 37 Toray Net Income 2018-2019 (US$mn, AGR %)
Figure 5 38Toray Primary Market Competitors 2020
Figure 5 39 UFP Technologies, Inc. Total Company Sales 2014-2018 (US$mn, AGR %)
Figure 5 40 UFP Technologies, Inc Sales by Segment of Business 2014-2018 (US$mn, Total Company Sales AGR %)
Figure 5 41 UFP Technologies, Inc Net Income 2014-2018 (US$mn, AGR %)
Figure 5 42 UFP Technologies, Inc Primary Market Competitors 2020
Figure 9 31 Huntsman Total Company Sales 2016-2019 (US$mn, AGR %)
Figure 9 32 Huntsman Sales by Segment of Business 2018-2019 (US$mn, Total Company Sales AGR %)
Figure 9 38 Huntsman Primary Market Competitors 2020
Figure 9 38 SCOTT BADER Primary Market Competitors 2020
List of Tables
Table 2 1 Composite application in automotive components 34
Table 3 1 Global Automotive Composites Market Revenue Forecast 2020-2030 (US$bn, AGR %, CAGR%) 35
Table 3 2 Global Automotive Composites Market Volume Forecast 2020-2030 (KT, AGR %,CAGR%) 36
Table 3 3 Global Automotive Composites Submarket Revenue Forecast 2020-2030 by Composite Materials (US$bn, AGR%) 50
Table 3 4 Global Automotive Composites Submarket Volume Forecast 2020-2030 by Composite Materials (KT,AGR%) 54
Table 3 5 Automotive Polymer Matrix Composites Submarket Revenue Forecast 2020-2030 (US$bn, AGR%, CAGR%) 57
Table 3 6 Automotive Polymer Matrix Composites Submarket Volume Forecast 2020-2030 (KT, AGR%, CAGR%) 58
Table 3 7 Automotive Polymer Matrix Composites Drivers & Restraints 2020 60
Table 3 8 Automotive Polymer Matrix Composites Submarket Revenue Forecast 2020-2030 (US$bn) by Type of Polymer Fibre - AGR Comparison (%) 62
Table 3 9 Automotive Polymer Matrix Composites Submarket Volume Forecast 2020-2030(KT) by Type of Polymer Fibre - AGR Comparison (%) 65
Table 3 10 Automotive Carbon Fibre Reinforced Polymer (CFRP) Submarket Revenue Forecast 2020-2030 ( US$bn, AGR%, CAGR%) 68
Table 3 11 Automotive Carbon Fibre Reinforced Polymer (CFRP) Submarket Volume Forecast 2020-2030(KT, AGR%, CAGR%) 69
Table 3 12 Automotive Glass Fibre Reinforced Polymer (GFRP) Submarket Revenue Forecast 2020-2030 (US$bn, AGR%, CAGR%) 71
Table 3 13 Automotive Glass Fibre Reinforced Polymer (GFRP) Submarket Volume Forecast 2020-2030 (KT, AGR%) 72
Table 3 14 Automotive Aramid Fibre Reinforced Polymer (AFRP) Submarket Revenue Forecast 2020-2030 (US$bn, AGR%, CAGR%) 74
Table 3 15 Automotive Aramid Fibre Reinforced Polymer (AFRP) Submarket Volume Forecast 2020-2030(KT, AGR%, CAGR%) 75
Table 3 16 Automotive Polymer Matrix Composites Market Revenue Forecast 2020-2030 (US$bn) by Thermoplastic or Thermosetting Polymer - AGR Comparison (%) 79
Table 3 17 Automotive Polymer Matrix Composites Market Volume Forecast 2020-2030 by Thermoplastic or Thermosetting Polymer – (KT, AGR Comparison (%) 82
Table 3 18 Automotive Thermoplastic Polymer Matrix Composites (PMC) Submarket Revenue Forecast 2020-2030 (US$bn, AGR%, CAGR%) 83
Table 3 19 Automotive Thermoplastic Polymer Matrix Composites (PMC) Submarket Volume Forecast 2020-2030 (KT, AGR%, CAGR%) 84
Table 3 20 Automotive Thermoset Polymer Matrix Composites (PMC) Submarket Revenue Forecast 2020-2030 (US$bn, AGR%, CAGR%) 87
Table 3 21 Automotive Thermoset Polymer Matrix Composites (PMC) Submarket Volume Forecast 2020-2030 (KT, AGR%, CAGR%) 88
Table 3 22 Automotive Polymer Matrix Composites Submarket Revenue Forecast 2020-2030 (US$bn) by End use - AGR Comparison (%) 92
Table 3 23 Automotive Polymer Matrix Composites Submarket Volume Forecast 2020-2030(KT) by End use application - AGR Comparison (%) 95
Table 3 24 Automotive Polymer Matrix Composites (PMC) Submarket Revenue Forecast for Conventional Vehicles 2020-2030 (US$bn,AGR%, CAGR%) 98
Table 3 25 Automotive Polymer Matrix Composites (PMC) Submarket Volume Forecast for Conventional Vehicles 2020-2030 (KT,AGR%, CAGR%) 99
Table 3 26 Automotive Polymer Matrix Composites (PMC) Submarket Revenue Forecast for Electrical Vehicles 2020-2030 (US$bn,AGR%, CAGR%) 101
Table 3 27 Automotive Polymer Matrix Composites (PMC) Submarket Volume Forecast for Electrical Vehicles 2020-2030 (KT,AGR%, CAGR%) 102
Table 3 28 Automotive Polymer Matrix Composites (PMC) Submarket Revenue Forecast for Trucks & Buses 2020-2030 (US$bn,AGR%, CAGR%) 104
Table 3 29 Automotive Polymer Matrix Composites (PMC) Submarket Volume Forecast for Trucks & Buses 2020-2030 (KT,AGR%, CAGR%) 105
Table 3 30 Automotive Polymer Matrix Composites Submarket Revenue Forecast 2020-2030 (US$bn) by Manufacturing Process - AGR Comparison (%) 108
Table 3 31 Automotive Polymer Matrix Composites Submarket Volume Forecast 2020-2030(KT) by Manufacturing Process - AGR Comparison (%) 111
Table 3 32 Automotive Polymer Matrix Composites (PMC) Submarket Revenue Forecast for Compression Molding 2020-2030 (US$bn,AGR%, CAGR%) 114
Table 3 33 Automotive Polymer Matrix Composites (PMC) Submarket Volume Forecast for Compression Moulding 2020-2030 (KT,AGR%, CAGR%) 114
Table 3 34 Automotive Polymer Matrix Composites (PMC) Submarket Revenue Forecast forn Injection Moulding 2020-2030 (US$bn,AGR%, CAGR%) 116
Table 3 35 Automotive Polymer Matrix Composites (PMC) Submarket Volume Forecast for Injection Moulding 2020-2030 (KT,AGR%, CAGR%) 117
Table 3 36 Automotive Polymer Matrix Composites (PMC) Submarket Revenue Forecast forn Resin Transfer Moulding 2020-2030 (US$bn,AGR%, CAGR%) 118
Table 3 37 Automotive Polymer Matrix Composites (PMC) Submarket Volume Forecast for Resin Transfer Moulding 2020-2030 (KT,AGR%, CAGR%) 119
Table 3 38 Automotive Polymer Matrix Composites (PMC) Submarket Revenue Forecast forn Sheet Moulding 2020-2030 (US$bn,AGR%, CAGR%) 120
Table 3 39 Automotive Polymer Matrix Composites (PMC) Submarket Volume Forecast for Sheet Moulding 2020-2030 (KT,AGR%, CAGR%) 121
Table 3 40 Automotive Metal Matrix Composites Submarket Revenue Forecast 2020-2030 (US$bn, AGR%, CAGR%) 122
Table 3 41Automotive Metal Matrix Composites Submarket Volume Forecast 2020-2030 (KT, AGR%, CAGR%) 124
Table 3 42 Automotive Metal Matrix Composites Submarket Drivers & Restraints 128
Table 3 43 Automotive Ceramic Matrix Composites Submarket Revenue Forecast 2020-2030 (US$bn, AGR%, CAGR%) 128
Table 3 44 Automotive Ceramic Matrix Composites Submarket Volume Forecast 2020-2030 (KT, AGR%, CAGR%) 131
Table 3 45 Automotive Ceramic Matrix Composites Submarket Drivers & Restraints 136
Table 3 46 Global Automotive Composites Market Revenue Forecast 2020-2030 by Composite Components (US$bn, AGR) 137
Table 3 47 Automotive Composites Interior Components Submarket Revenue Forecast 2020-2030 (US$bn, AGR%, CAGR%) 140
Table 3 48 Automotive Composite Interior Components Submarket Drivers & Restraints 142
Table 3 49 Automotive Composite Body Components Submarket Forecast 2020-2030 (US$bn, AGR%, CAGR%) 143
Table 3 50Automotive Composites Body Components Submarket Drivers & Restraints 144
Table 3 51 Automotive Composite Engine & Drivetrain Components Submarket Forecast 2020-2030 (US$bn, AGR%, CAGR%) 145
Table 3 52 Automotive Composite Engine & Drivetrain Components Submarket Drivers & Restraints 146
Table 3 53 Other Automotive Composite Components Submarket Forecast 2020-2030 (US$bn, AGR%, CAGR%) 147
Table 3 54 Other Automotive Composites Components Submarket Drivers & Restraints 148
Table 4 1 Leading National Automotive Composites Market Forecast 2020-2030 (US$bn, AGR %, Cumulative) 149
Table 4 2Global Automotive Composites Market by National Market CAGR Forecast 2020-2025, 2025-2030, 2020-2030 (CAGR %) 152
Table 4 3National Automotive Composites Market Percentage Change in Market Share 2020-2025, 2025-2030, 2020-2030 (% Change) 156
Table 4 4 US Automotive Composites Market Forecast 2020-2030 (US$bn, AGR %, CAGR %, Cumulative) 159
Table 4 5 Canada Automotive Composites Market Forecast 2020-2030 (US$bn, AGR %, CAGR %, Cumulative) 161
Table 4 6 Mexico Automotive Composites Market Forecast 2020-2030 (US$bn, AGR %, CAGR %, Cumulative) 163
Table 4 7 Germany Automotive Composites Market Forecast 2020-2030 (US$bn, AGR %, CAGR %, Cumulative) 165
Table 4 8 France Automotive Composites Market Forecast 2020-2030 (US$bn, AGR %, CAGR %, Cumulative) 167
Table 4 9 United Kingdom Automotive Composites Market Forecast 2020-2030 (US$bn, AGR %, CAGR %, Cumulative) 169
Table 4 10 Italy Automotive Composites Market Forecast 2020-2030 (US$bn, AGR %, CAGR %, Cumulative) 171
Table 4 11 Rest of Europe (RoW) Automotive Composites Market Forecast 2020-2030 (US$bn, AGR %, CAGR %, Cumulative) 172
Table 4 12 China Automotive Composites Market Forecast 2020-2030 (US$bn, AGR %, CAGR %, Cumulative) 174
Table 4 13 China Automotive Composites & Restraints 2020 175
Table 4 14 Japan Automotive Composites Market Forecast 2020-2030 (US$bn, AGR %, CAGR %, Cumulative) 177
Table 4 15 Japan Automotive Composites & Restraints 2020 178
Table 4 16 India Automotive Composites Market Forecast 2020-2030 (US$bn, AGR %, CAGR %, Cumulative) 179
Table 4 17 India Automotive Composites & Restraints 2020 180
Table 4 18 South Korea Automotive Composites Market Forecast 2020-2030 (US$bn, AGR %, CAGR %, Cumulative) 182
Table 4 19 South Korea Automotive Composites & Restraints 2020 183
Table 4 20 Brazil Automotive Composites Market Forecast 2020-2030 (US$bn, AGR %, CAGR %, Cumulative) 184
Table 4 21 Argentina Automotive Composites Market Forecast 2020-2030 (US$bn, AGR %, CAGR %, Cumulative) 186
Table 5 1 Strategies adopted by key market participants 190
Table 6 1 BASF Profile 2020 (CEO, Total Company Sales US$mn, Net Income US$mn, Order Backlog US$mn, Strongest Business Region, Business Segment in the Market, Submarket Involvement, HQ, Founded, No. of Employees, IR Contact, Ticker, Website) 197
Table 6 2 BASF Total Company Sales 2014-2018 (US$mn, AGR %) 198
Table 6 3 BASF Sales by Segment of Business 2017-2018 (US$mn, AGR %) 198
Table 6 4 BASF Net Income 2014-2018 (US$mn, AGR %) 199
Table 6 5BASF Automotive Composites Enabled Products / Services (Product, Specification / Features) 199
Table 9 41 Selected Recent BASF. Automotive Composites Market Latest Developments (Year, Initiatives, Details) 200
Table 6 6BASF Mergers and Acquisitions (Date, Company Involved, Value US$mn, Details) 201
Table 6 7 DOW Inc. Profile 2020 (CEO, Total Company Sales US$mn, Net Income US$mn, Order Backlog US$mn, Strongest Business Region, Business Segment in the Market, Submarket Involvement, HQ, Founded, No. of Employees, IR Contact, Ticker, Website) 203
Table 6 8 DOW Inc. Total Company Sales 2015-2019 (US$mn, AGR %) 203
Table 6 9 DOW Inc. Sales by Segment of Business 2018-2019 (US$mn, AGR %) 204
Table 6 10DOW Inc. Automotive Composites Enabled Products / Services (Product, Specification / Features) 205
Table 9 41 Selected Recent DOW Inc. Automotive Composites Market Latest Developments (Year, Initiatives, Details) 205
Table 6 11 Gurit Profile 2020 (CEO, Total Company Sales US$mn, Net Income US$mn, Order Backlog US$mn, Strongest Business Region, Business Segment in the Market, Submarket Involvement, HQ, Founded, No. of Employees, IR Contact, Ticker, Website) 208
Table 6 12 Gurit Total Company Sales 2015-2018 (US$mn, AGR %) 208
Table 6 13 Gurit Sales by Segment of Business 2017-2018 (US$mn, AGR %) 209
Table 6 14Gurit Sales by Geographical Location 2017-2018 (US$mn, AGR %) 210
Table 6 15Gurit Automotive Composites Enabled Products / Services (Product, Specification / Features) 210
Table 6 16Gurit Mergers and Acquisitions (Date, Company Involved, Value US$mn, Details) 211
Table 9 41 Selected Recent Gurit Automotive Composites Market Latest Developments (Year, Initiatives, Details) 212
Table 6 17 Hexcel Profile 2020 (CEO, Total Company Sales US$mn, Net Income US$mn, Order Backlog US$mn, Strongest Business Region, Business Segment in the Market, Submarket Involvement, HQ, Founded, No. of Employees, IR Contact, Ticker, Website) 215
Table 6 18 Hexcel Total Company Sales 2014-2018 (US$mn, AGR %) 216
Table 6 19 Hexcel Sales by Segment of Business 2016-2018 (US$mn, AGR %) 216
Table 6 20 Hexcel Net Income 2014-2018 (US$mn, AGR %) 217
Table 6 21Hexcel Automotive Composites Enabled Products / Services (Product, Specification / Features) 217
Table 6 22Hexcel Mergers and Acquisitions (Date, Company Involved, Value US$mn, Details) 218
Table 9 41 Selected Recent Hexcel Automotive Composites Market Latest Developments (Year, Initiatives, Details) 218
Table 6 23 Mitsubishi Chemical CorporationProfile 2020 (CEO, Total Company Sales US$mn, Net Income US$mn, Order Backlog US$mn, Strongest Business Region, Business Segment in the Market, Submarket Involvement, HQ, Founded, No. of Employees, IR Contact, Ticker, Website) 221
Table 6 24 Mitsubishi Chemical Corporation Total Company Sales 2015-2018 (US$mn, AGR %) 222
Table 6 25 Mitsubishi Chemical Corporation Sales by Segment of Business 2017-2018 (US$mn, AGR %) 222
Table 6 26Mitsubishi Chemical Corporation Automotive Composites Enabled Products / Services (Product, Specification / Features) 223
Table 6 27Mitsubishi Chemical Corporation Mergers and Acquisitions (Date, Company Involved, Value US$mn, Details) 224
Table 9 41 Selected Recent Mitsubishi Chemical Corporation Automotive Composites Market Latest Developments (Year, Initiatives, Details) 224
Table 6 28 SGL Group Profile 2020 (CEO, Total Company Sales US$mn, Net Income US$mn, Order Backlog US$mn, Strongest Business Region, Business Segment in the Market, Submarket Involvement, HQ, Founded, No. of Employees, IR Contact, Ticker, Website) 228
Table 6 29 SGL Group Total Company Sales 2015-2018 (US$mn, AGR %) 229
Table 6 30 SGL Group Sales by Segment of Business 2017-2018 (US$mn, AGR %) 229
Table 6 31 SGL Group Sales by Geographical Location 2017-2018 (US$mn, AGR %) 230
Table 6 32SGLGroup Automotive Composites Enabled Products / Services (Product, Specification / Features) 231
Table 9 41 Selected Recent SGLGroup Automotive Composites Market Latest Developments (Year, Initiatives, Details) 231
Table 6 33 Solvey Group Profile 2020 (CEO, Total Company Sales US$mn, Net Income US$mn, Order Backlog US$mn, Strongest Business Region, Business Segment in the Market, Submarket Involvement, HQ, Founded, No. of Employees, IR Contact, Ticker, Website) 235
Table 6 34 Solvey Group Total Company Sales 2015-2018 (US$mn, AGR %) 236
Table 6 35 Solvey Group Sales by Segment of Business 2017-2018 (US$mn, AGR %) 236
Table 6 36Solvey Group Sales by Geographical Location 2017-2018 (US$mn, AGR %) 237
Table 6 37Solvey Group Automotive Composites Enabled Products / Services (Product, Specification / Features) 238
Table 6 38Solvey Group Mergers and Acquisitions (Date, Company Involved, Value US$mn, Details) 239
Table 9 41 Selected Recent Solvey Group Automotive Composites Market Latest Developments (Year, Initiatives, Details) 239
Table 6 39 Teijin Limited Profile 2020 (CEO, Total Company Sales US$mn, Net Income US$mn, Order Backlog US$mn, Strongest Business Region, Business Segment in the Market, Submarket Involvement, HQ, Founded, No. of Employees, IR Contact, Ticker, Website) 242
Table 6 40 Teijin Limited Total Company Sales 2015-2019 (US$mn, AGR %) 243
Table 6 41 Teijin Limited Sales by Segment of Business 2018-2019 (US$mn, AGR %) 243
Table 6 42Teijin Limited Sales by Geographical Location 2018-2019 (US$mn, AGR %) 244
Table 6 43Teijin Limited Automotive Composites Enabled Products / Services (Product, Specification / Features) 244
Table 6 44Teijin Limited Mergers and Acquisitions (Date, Company Involved, Value US$mn, Details) 246
Table 9 41 Selected Recent Teijin Automotive Composites Market Latest Developments (Year, Initiatives, Details) 246
Table 6 45 Toray Profile 2020 (CEO, Total Company Sales US$mn, Net Income US$mn, Order Backlog US$mn, Strongest Business Region, Business Segment in the Market, Submarket Involvement, HQ, Founded, No. of Employees, IR Contact, Ticker, Website) 249
Table 6 46 Toray Total Company Sales 2015-2019 (US$mn, AGR %) 250
Table 6 47 Toray Sales by Segment of Business 2015-2019 (US$mn, AGR %) 250
Table 6 48Toray Sales by Geographical Location 2018-2019 (US$mn, AGR %) 251
Table 6 49 Toray Net Income 2018-2019 (US$mn, AGR %) 252
Table 6 50Toray Automotive Composites Enabled Products / Services (Product, Specification / Features) 252
Table 6 51Toray Mergers and Acquisitions (Date, Company Involved, Value US$mn, Details) 253
Table 9 41 Selected Recent Toray Automotive Composites Market Latest Developments (Year, Initiatives, Details) 254
Table 6 52 UFP Technologies, Inc Profile 2020 (CEO, Total Company Sales US$mn, Net Income US$mn, Order Backlog US$mn, Strongest Business Region, Business Segment in the Market, Submarket Involvement, HQ, Founded, No. of Employees, IR Contact, Ticker, Website) 256
Table 6 53 UFP Technologies, Inc Total Company Sales 2014-2018 (US$mn, AGR %) 257
Table 6 54 UFP Technologies, Inc Sales by Segment of Business 2016-2018 (US$mn, AGR %) 257
Table 6 55 UFP Technologies, Inc Net Income 2014-2018 (US$mn, AGR %) 258
Table 6 56UFP Technologies, Inc Automotive Composites Enabled Products / Services (Product, Specification / Features) 258
Table 6 57UFP Technologies, Inc Mergers and Acquisitions (Date, Company Involved, Value US$mn, Details) 259
Table 6 58 Huntsman Profile 2020 (CEO, Total Company Sales US$mn, Net Income US$mn, Order Backlog US$mn, Strongest Business Region, Business Segment in the Market, Submarket Involvement, HQ, Founded, No. of Employees, IR Contact, Ticker, Website) 261
Table 6 59 Huntsman Total Company Sales 2016-2019 (US$mn, AGR %) 261
Table 6 60 Huntsman Sales by Segment of Business 2018-2019 (US$mn, AGR %) 262
Table 6 61Huntsman Automotive Composites Enabled Products / Services (Product, Specification / Features) 262
Table 6 62BASF Mergers and Acquisitions (Date, Company Involved, Value US$mn, Details) 263
Table 9 41 Selected Recent Huntsman Automotive Composites Market Latest Developments (Year, Initiatives, Details) 263
Table 6 63 ADVANCED COMPOSITES GROUP Profile 2020 (CEO, Total Company Sales US$mn, Net Income US$mn, Order Backlog US$mn, Strongest Business Region, Business Segment in the Market, Submarket Involvement, HQ, Founded, No. of Employees, IR Contact, Ticker, Website) 265
Table 6 64ADVANCED COMPOSITES GROUP Automotive Composites Enabled Products / Services (Product, Specification / Features) 265
Table 9 41 Selected Recent ADVANCED COMPOSITES GROUP Automotive Composites Market Latest Developments (Year, Initiatives, Details) 266
Table 6 65 SCOTT BADER Profile 2020 (CEO, Total Company Sales US$mn, Net Income US$mn, Order Backlog US$mn, Strongest Business Region, Business Segment in the Market, Submarket Involvement, HQ, Founded, No. of Employees, IR Contact, Ticker, Website) 267
Table 6 66SCOTT BADER Automotive Composites Enabled Products / Services (Product, Specification / Features) 267
Table 6 67SCOTT BADER Mergers and Acquisitions (Date, Company Involved, Value US$M, Details) 268
Table 9 41 Selected Recent Scott Bader Automotive Composites Market Latest Developments (Year, Initiatives, Details) 268
Table 7 1 Other Important Automotive Manufacturing Companies in the Automotive Composites Market 2020 272
3A Composites
3B – The Fibreglass Company
3M
Acrolab Ltd.
Advanced Composites Group
Ahlstrom
Aircelle
Airtech Europe
Alcan Baltek
Alfa Romeo
Alva Sweden AB
Amber Composites
AMEL automotive composites
AOC LLC
AOC Resins
Apogee Products
ARC Technologies
Argentine Association of Automotive Makers
Asahi Kasei Plastics
Ashland Performance Materials
Ashland Specialty Chemical
ATC
Attwater Group
Automotive Composite Alliance
Automotive Composites Consortium
Avtovaz
Azdel Inc.
BAE Systems
BASF
Bayer Corporation
Bayer Material Science
Beijing Automotive
Belgian internet platform UBench
Benet Automotive
Benteler-SGL
Bluestar Fibres
BMC Inc.
BMW
Bombardier
Borealis
Bosch GmbH
Brilliance
BYD Automotive
Canmet MATERIALS Laboratory
CCP Composites
Chang’an Automobile
Chemetall
Chery
Chrysler
CIDESI
Clean Motion
Cleanpart Group
Composite Integration Ltd
Composites Innovation Centre
Continental
Continental Structural Plastics
Core Molding Technologies
Coriolis Composites
CPC Group
Cristex
Crosby Composites
Cytec
Cytec Solvay
Daihatsu
Daimler
Dana Holding Corp.
Dassault Systemes
Delphi
Denso
DIAB Group
Dieffenbacher
DIELECTRICS, INC.
Dongfeng Motor Corporation
Dow Automotive Systems
Dow Chemical Company
Dow Chemicals
DSM Composite Resins
Dutch Filaments B.V.
ESI group
European Carbon Fiber GmbH
European Thermoplastic Automotive Composites (eTAC)
e-Xstream engineering
Faurecia
Faurecia Automotive Seating
Federal Mogul
Fibre Corporation
Ford
Formax
Formosa Plastics Corp
Fraunhofer ICT-A
Fuso
Gazechim Composites
General Motors
Gordon Murray Design Ltd.
Guangdong Yinfan Chemistry
Gurit
Henkel Corp.
Hexcel Corporation
Hexcel Total
Hino
Hivocomp Consortium
Holding B.V
Honda
Huntsman
Huntsman Advanced Materials
Icynene-Lapolla
IDI Composites International
IFS Chemicals Limited (IFS)
Inapal Plasticos SA (Inapal)
Innegrity
INVISTA Engineering Polymers
Jaguar XJR
Jaguar-LandRover
JDR AUTOMOTIVE COMPOSITES LIMITED
JEC Composites ltd,
JHM Technologies
Johnson Controls GmbH
JRL
Kia
Lamborghini
Lexus
Lotus Cars
LyondellBasell
MAG Industrial Automation Systems
Magna Exteriors and Interiors
Magna International Inc
Magnetti Marelli
Mahindra Mahindra
Mahle
MAN Truck & Bus AG
Matrasur Composites
Mazda
McLaren
Mclaren Automotive Composites
Mecaplast Group
Milliken Chemical
Mitsubishi
Mitsubishi Rayon
Molded Fibre Glass Companies
Momentive Specialty Chemicals
National Research Council Canada, Automotive and Surface Transportation
Nippon Graphite Fibre Corporation
Nissan
Norco GRP
OMNIA LLC,
Owens Corning
Owens Corning Automotive
Owens Corning4
Park Electrochemical Corporation
Paxford Composites
Plasan USA
PlasanCarbon Composites
Plasticolors Incorporated
PlastiComp, LLC
Polyscope Polymers
Polystrand
Porsche
PPG Industries
PRF Composite Materials
Propex Fabrics,
Pultrex
Quadrant Plastics Composites
Quantum Composites
Quickstep Technologies
Reichhold, Inc.
Renault
Reverie
Ricardo Plc
Roctool
Rolls-Royce Motor Cars Limited
RTP Company
Ryton® PPS
Saati S.p.A
SAIC
Saint-Gobain Adfors
Sasol
Scott Bader
SGL Group
Sigmatex
Solvay Specialty Polymers
Solvey Group
Sora Composites
Subaru
Suzuki Motor Corporation
Tata Motors
Technique Composites
Tecnoelastomeri
Teijin
Teijin Limited
TenCate
TenCate Advanced Composites
Teufelberger GmbH,
The Composites Group
Ticona Engineering Polymers
Toho Tenax
Toray
Toyota
Toyoto
Trexel, Inc.
UFP Technologies
Umeco Plc
URT Group Ltd
US Environmental Protection Agency
Valplastic S.r.l.
Voith
Volkswagen
Wacker Chemie
Welset Plast Extrusions
Williams, White & Co.
Woodward
Zoltek
Zotefoams Plc
Download sample pages
Complete the form below to download your free sample pages for Automotive Composites Market Report 2020-2030
Related reports
-

Automotive Bushing Market Report 2020-2030
The automotive bushing market is about to enter a period of phenomenal growth and innovation. The next ten years will...
Full DetailsPublished: 01 January 1970 -

Automotive Chassis Market Report 2020-2030
The global market for automotive chassis is expected to grow with the healthy CAGR of 5.1% during the forecast period...
Full DetailsPublished: 01 January 1970 -

Carbon Fibre Reinforced Plastic (CFRP) Composites Market Report 2018-2028
With this definitive 204-page report you will receive a highly granular market analysis segmented by region, by application and by...Full DetailsPublished: 13 September 2018 -

Automotive Chips Market Report 2021-2031
The US is ahead of the global automotive chips adoption and application in terms of automakers and vehicle owners approaching...Full DetailsPublished: 03 November 2020 -

Gigafactory Market Report 2020-2030
Recent rapid improvements in lithium-ion (Li-ion) battery costs and performance, coupled with growing demand for electric vehicles (EVs) and increased...
Full DetailsPublished: 09 September 2020 -

Electric Vehicle Supply Equipment (EVSE) Market Report 2020-2030
The latest report from business intelligence provider company name offers comprehensive analysis of the global Electric Vehicle Supply Equipment market....
Full DetailsPublished: 06 May 2020 -

Autonomous Trucks Market Report 2020-2030
Visiongain anticipates that the Global Autonomous Trucks Market is projected to surpass US$7,328.6 million in 2030 while growing at a...
Full DetailsPublished: 30 April 2020 -

Hybrid Powertrain Systems Market Report 2019-2029
The latest report from business intelligence provider Visiongain offers a comprehensive analysis of the global Hybrid powertrain systems market. Visiongain...
Full DetailsPublished: 31 July 2019 -

Top 20 Composites Companies 2018
We reveal the competitive positioning for the top 20 companies in the overall composites market- and also the leading companies...Full DetailsPublished: 24 October 2018 -

Battery Management System Market Report 2019-2029
This latest report by business intelligence provider Visiongain assesses that Battery Management System Market spending will reach $3.87 bn in...
Full DetailsPublished: 01 January 1970
Download sample pages
Complete the form below to download your free sample pages for Automotive Composites Market Report 2020-2030
Do you have any custom requirements we can help you with?
Any specific country, geo region, market segment or specific company information?
Email us today, we can discuss your needs and see how we can help: jamie.roberts@visiongain.com
Would you like a free report overview of the report of your choice?
If so, please drop an email to Jamie Roberts stating your chosen report title to jamie.roberts@visiongain.com
Visiongain automotive reports are compiled using a broad and rich mixture of both primary and secondary information to produce an overall industry outlook. In order to provide our clients with the best product possible product, we do not rely on any one single source of information. Visiongain analysts reach out to market-leading vendors and automotive industry experts but also review a wealth of financial data and product information from a vast range of sources. To find out more about our reports methodology please email jamie.roberts@visiongain.com
Would you like to get the latest Visiongain automotive reports catalogue?
What are the dynamic growth sectors? where are the regional business opportunities?
Which technologies will prevail and who are the leading companies succeeding in these sectors and why?
If you want definitive answers to business critical questions, discover Visiongain’s full range of business intelligence reports.
If so, please email Jamie Roberts on jamie.roberts@visiongain.com or call her today on +44 207 336 6100
Alliance of Automobile Manufacturers (USA)
Association of Russian Automakers
Audio Video Bridging (AVB)
China Association Of Automoblie Manufacturers
European Association of Automotive Suppliers
European Automobile Manufacturers’ Association
European Council for Automotive Research and Development
Former Society of Automotive Engineers
German Association of the Automotive Industry
International Organization of Motor Vehicle Manufacturers
In-Vehicle Infotainment (IVI)
Italian Association of the Automotive Industry
Japan Automobile Manufacturers Association
One-Pair Ether-Net
Society of Indian Automobile Manufacturers (SIAM)
Society of Motor Manufacturers and Traders
The International Council For Clean Transport
US National Highway Traffic Safety Administration
Latest Automotive news
Visiongain Publishes Connected Vehicle Market Report 2024-2034
The global Connected Vehicle market was valued at US$82.67 billion in 2023 and is projected to grow at a CAGR of 14.7% during the forecast period 2024-2034.
24 April 2024
Visiongain Publishes Automotive Electronics Market Report 2024-2034
The global Automotive Electronics market was valued at US$270.7 million in 2023 and is projected to grow at a CAGR of 8.7% during the forecast period 2024-2034.
15 April 2024
Visiongain Publishes Automobile AI and Generative Design Market Report 2024-2034
The global Automobile AI and Generative Design market was valued at US$630.7 million in 2023 and is projected to grow at a CAGR of 19% during the forecast period 2024-2034.
02 April 2024
Visiongain Publishes Vehicle to Grid (V2G) Market Report 2024-2034
The global Vehicle to Grid (V2G) market was valued at US$3,391 million in 2023 and is projected to grow at a CAGR of 27.6% during the forecast period 2024-2034.
08 March 2024
