Industries > Electronics > Lithium-Ion Battery Market Report 2020-2030
Lithium-Ion Battery Market Report 2020-2030
Forecasts ($bn) by Type of Application (Industrial, Automotive, Consumer, Renewable & Grid Energy Storage), by Component (Cathode, Anode, Electrolytic), by Cathode (LCO, LFP, NMC, LMO, NCA, Lithium Titanate), by Anode (Natural Graphite, Synthetic Graphite, Other), by Regions (North America, Europe, Asia-Pacific, Middle East, South America) Plus 22 Countries. Including Analysis of 16 Leading Companies in the Lithium-Ion Battery Market
Visiongain values the lithium-ion battery market at $43.8bn in 2019.
The lithium-ion battery market is anticipated to witness continual growth during the forecast period. In 2019, Asia-Pacific and Europe collectively represented more than half of the revenue share of the overall market. The largest segment in terms of revenue contribution is the automotive industry. This is primarily attributed to the growth in demand for lithium-ion batteries for electric and hybrid electric vehicles.
This brand-new in-depth report lithium-ion battery market, 2020-2030 describes trends in the market both quantitatively and qualitatively. In recent years, the global lithium-ion battery market, 2020-2030 market has developed as the popularity of lithium-ion batteries in both developed and developing nations has increased at a significant pace especially in the automotive industry. Fluctuating crude oil prices and rising political instability has led to increased demand for alternative energy sources. The global automotive market is rapidly shifting towards the next generation vehicles such as HEVs, PHEVs and EVs to reduce greenhouse gas emissions and dependency on crude oil. Lithium-ion batteries are the most appropriate technology for the electric vehicles due to its high energy efficiency, long shelf life and reasonable cost.
The key growth driver
Lithium ion batteries cost has been decreased by 87% from the 2010 levels, and it is estimated to fall lower than $100/kWh within the forecasting period, contributing to the increased popularity of the lithium ion technology Increasing usage of lithium-ion batteries in industrial applications and the automotive sector is anticipated to boost the market growth. Also, the demand for lithium-ion batteries is majorly driven by consumer electronics due to rapid evolution in mobile technologies and communication services including laptops, computers, cell phones and tablets. Compared with other traditional battery technologies, lithium-ion batteries have an advantage towards faster charging, high power density and light weight packaging. Additionally, an increase in foreign direct investment (FDI) has led to the rise in the participation of foreign and private players that boost retail infrastructure. Visiongain notes that many vendors are focused towards product launch, entering into strategic collaboration and mergers & acquisition with leading players to enhance their technological capabilities and market presence. The lithium-ion battery industry is responding with enhanced products, making full use of technological advances in lithium-ion battery production. This market has great developmental potential, both strategically and commercially. In addition, prominent vendors in the market are focused towards expanding their market presence to outperform competitors. Are you capturing as large a part of this market as you should be? This report will ensure you do.
In particular, Lithium-ion Battery market report concentrates on the following essential aspects of the packaging industry:
• Sales forecasts 2020-2030
• Examination of strengths, weakness, opportunities and threats facing the lithium-ion battery industry
• Identify the market structure through insightful val
• Analysis of the prospects for lithium-ion batteries
• Geographical breakdown of the lithium-ion battery market, including the leading emerging markets of China and India
• Coverage of future trends in lithium-ion battery technology and manufacturing
• Identification of key industrial players in the lithium-ion battery market.
The Lithium-ion Battery Market Report 2020-2030 examines the lithium-ion battery market comprehensively, using unique primary and secondary research. Also included are company profiles. Exclusively, Visiongain have applied their in-house analytical techniques for financial forecasting and analysis of drivers and restraints. Now available to you this comprehensive market-based report with detailed analyses, forecasts and informed opinion will be essential to your lithium-ion battery market development.
Visiongain predicts that government mandates and regulations for reduced vehicle emissions will significantly expand the market for lithium-ion batteries, contributing to rapid sales growth during the period 2020 to 2030
Reasons to buy
• Learn where the lithium-ion market is headed
• Understand how the technology can be monetised
• See where the business opportunities are
• Compare your own evaluations with a second opinion
• Discover who the first movers are within this market space
• See what the barriers to entry are likely to be
Key content
• 265 tables, charts and graphs
• Global Lithium-Ion Battery forecasts from 2020-2030
• Lithium-Ion Battery submarket forecasts by application from 2020-2030
• Industrial Lithium-Ion Battery Forecast 2020-2030
• Automotive Lithium-Ion Battery Forecast 2020-2030
• Consumer Lithium-Ion Battery Forecast 2020-2030
• Renewable & Grid Energy Storage Lithium-Ion Battery Forecast 2020-2030
• Lithium-Ion Battery submarket forecasts by component from 2020-2030
• Cathode Lithium-Ion Battery Forecast 2020-2030
• Anode Lithium-Ion Battery Forecast 2020-2030
• Electrolytic Lithium-Ion Battery Forecast 2020-2030
• National/Regional Lithium-Ion Battery forecasts from 2020-2030
• North America Lithium-Ion Battery forecast 2020-2030
• US Lithium-Ion Battery Forecast 2020-2030
• Canada Lithium-Ion Battery Forecast 2020-2030
• Mexico Lithium-Ion Battery Forecast 2020-2030
• Europe Lithium-Ion Battery forecast 2020-2030
• Germany Lithium-Ion Battery Forecast 2020-2030
• France Lithium-Ion Battery Forecast 2020-2030
• Italy Lithium-Ion Battery Forecast 2020-2030
• UK Lithium-Ion Battery Forecast 2020-2030
• Spain Lithium-Ion Battery Forecast 2020-2030
• Russia Lithium-Ion Battery Forecast 2020-2030
• Norway Lithium-Ion Battery Forecast 2020-2030
• Netherlands Lithium-Ion Battery Forecast 2020-2030
• Rest of Europe Lithium-Ion Battery Forecast 2020-2030
• Asia-Pacific Lithium-Ion Battery forecast 2020-2030
• China Lithium-Ion Battery Forecast 2020-2030
• Japan Lithium-Ion Battery Forecast 2020-2030
• South Korea Lithium-Ion Battery Forecast 2020-2030
• India Lithium-Ion Battery Forecast 2020-2030
• Indonesia Lithium-Ion Battery Forecast 2020-2030
• Australia Lithium-Ion Battery Forecast 2020-2030
• Rest of Asia Pacific Lithium-Ion Battery Forecast 2020-2030
• South America Lithium-Ion Battery forecast 2020-2030
• Argentina Lithium-Ion Battery Forecast 2020-2030
• Brazil Lithium-Ion Battery Forecast 2020-2030
• Rest of Latin America Lithium-Ion Battery Forecast 2020-2030
• Middle East & Africa Lithium-Ion Battery forecast 2020-2030
• Saudi Arabia Lithium-Ion Battery Forecast 2020-2030
• UAE Lithium-Ion Battery Forecast 2020-2030
• South Africa Lithium-Ion Battery Forecast 2020-2030
• Rest of Middle East & Africa Lithium-Ion Battery Forecast 2020-2030
• Supporting analysis explaining the trends
• Profiles of key players
• Panasonic Corporation
• Toshiba Corporation
• Johnson Controls
• Samsung SDI Co. Ltd.
• LG Chem Ltd.
• BYD Co. Ltd.
• GS Yuasa Corporation
• Hitachi Ltd
• Sony Energy Devices Corporation
• Automotive Energy Supply Corporation (AESC)
• Phillips
• Tesla
• Renault Group
• Umicore S.A.
• Asahi Kasei Corporation
• Sumitomo Corporation
• Toray Industries, Inc.
• Showa Denko K.K.
The lithium-ion market is forecast for continual growth. With a Visiongain report, you can learn how the development of this market could affect you. With 265 tables, charts and graphs, this 252-page report will be of interest to you.
• Target readership includes
• Lithium-ion battery manufacturers
• Utility companies
• Energy storage specialists
• Renewable energy companies
• Automotive OEMs
• Electric vehicle manufacturers
• Consumer electronics companies
• R&D specialists
• CEO’s
• COO’s
• CIO’s
• Business development managers
• Marketing managers
• Market analysts
• Consultants
• Banks
• Investors
• Government and agencies
Why you must buy this report:
This report features news, insights, the latest developments and an in-depth survey of the Lithium-Ion battery market with up-to-date analysis as well as tables, graphs and charts. This report is a vital addition to gaining an understanding of the sector and will give your company ‘the edge’ on your competitors. You cannot afford to be without this latest report from Visiongain.
Buy our report today Lithium-Ion Battery Market Report 2020-2030: Forecasts ($bn) by Type of Application (Industrial, Automotive, Consumer, Renewable & Grid Energy Storage), by Component (Cathode, Anode, Electrolytic), by Cathode (LCO, LFP, NMC, LMO, NCA, Lithium Titanate), by Anode (Natural Graphite, Synthetic Graphite, Other), by Regions (North America, Europe, Asia-Pacific, Middle East, South America) Plus 22 Countries. Including Analysis of 16 Leading Companies. Avoid missing out by staying informed – order our report now.
Visiongain is a trading partner with the US Federal Government
CCR Ref number: KD4R6
Do you have any custom requirements we can help you with? Any need for specific country, geo region, market segment or specific company information? Contact us today, we can discuss your needs and see how we can help: sara.peerun@visiongain.com
1. Report Overview
1.1. Global Lithium-Ion Battery Market Overview
1.2. Why You Should Read This Report
1.3. How This Report Delivers
1.4. Key Questions Answered by This Analytical Report Include:
1.5. Who is This Report For?
1.6. Methodology
1.6.1. Primary Research
1.6.2. Secondary Research
1.6.3. Market Evaluation & Methodology
1.7. Frequently Asked Questions (FAQ)
1.8. Associated Visiongain Reports
1.9. About Visiongain
2. Introduction to the Lithium-Ion Battery Market
2.1. Lithium-Ion Battery Market Structure
2.2. Lithium-Ion Battery Market Definition
2.3. Brief History of Lithium-Ion Battery
2.4. Lithium-Ion Battery Submarkets Definition
2.4.1. Industrial Submarket Definition
2.4.2. Automotive Submarket Definition
2.4.3. Consumer Submarket Definition
2.4.4. Renewable and Grid Energy Storage Submarket Definition
2.5. Lithium-Ion Battery Price Analysis
2.6. Value Chain Analysis
2.7. Porters Five Forces Analysis
3. Global Lithium-Ion Battery Market 2020-2030
3.1. Drivers
3.1.1. Declining lithium-ion battery prices
3.1.2. Growing adoption in energy storage industry
3.1.3. Emergence of electric vehicle industry
3.1.4. Increasing Usage in Industrial Applications
3.1.5. Automotive and Energy Sector Continues to Enhance Growth Prospects for Lithium-Ion Batteries
3.1.6. Growth in Mobile and Computing Technologies
3.2. Restraints
3.2.1. Availability of Alternatives
3.2.2. Safety Concerns
3.2.3. Graphene Battery as an Alternative
3.2.4. Relatively High Cost of Lithium-Ion Batteries
3.3. Opportunities
3.3.1. Growth of the lithium-ion recycling market
3.3.2. Upcoming technological advancements
3.3.3. Strict Regulations To Curb Air Pollution
3.4. SWOT Analysis of the Lithium-Ion Battery Market 2020-2030
3.4.1. Strengths
3.4.2. Weaknesses
3.4.3. Opportunities
3.4.4. Threats
4. Global Lithium-Ion Battery Market Forecast by Application 2020-2030
5. Global Lithium-Ion Battery Market Forecast by Material 2020-2030
6. Global Lithium-Ion Battery Market Forecast by Cathode 2020-2030
7. Global Lithium-Ion Battery Market Forecast by Anode 2020-2030
8. Regional and National Lithium-Ion Battery Market Forecast 2020-2030
8.1. Global Lithium-Ion Battery Market Forecast 2020-2030
8.2. North America Lithium-Ion Battery Market Forecast 2020-2030
8.3. EU5 Lithium-Ion Battery Market Forecast 2020-2030
8.4. BRIC Lithium-Ion Battery Market Forecast 2020-2030
8.5. North America Lithium-Ion Battery Market Forecast 2020-2030
8.5.1. U.S. Lithium-Ion Battery Market Forecast 2020-2030
8.5.2. Canada Lithium-Ion Battery Market Forecast 2020-2030
8.5.3. Mexico Lithium-Ion Battery Market Forecast 2020-2030
8.6. Europe Lithium-Ion Battery Market Forecast 2020-2030
8.6.1. Germany Lithium-Ion Battery Market Forecast 2020-2030
8.6.2. France Lithium-Ion Battery Market Forecast 2020-2030
8.6.3. Italy Lithium-Ion Battery Market Forecast 2020-2030
8.6.4. The UK Lithium-Ion Battery Market Forecast 2020-2030
8.6.5. Spain Lithium-Ion Battery Market Forecast 2020-2030
8.6.6. Russia Lithium-Ion Battery Market Forecast 2020-2030
8.6.7. Norway Lithium-Ion Battery Market Forecast 2020-2030
8.6.8. Netherlands Lithium-Ion Battery Market Forecast 2020-2030
8.6.9. Rest of Europe Lithium-Ion Battery Market Forecast 2020-2030
8.7. Asia Pacific Lithium-Ion Battery Market Forecast 2020-2030
8.7.1. China Lithium-Ion Battery Market Forecast 2020-2030
8.7.2. Japan Lithium-Ion Battery Market Forecast 2020-2030
8.7.3. South Korea Lithium-Ion Battery Market Forecast 2020-2030
8.7.4. India Lithium-Ion Battery Market Forecast 2020-2030
8.7.5. Australia Lithium-Ion Battery Market Forecast 2020-2030
8.7.6. Indonesia Lithium-Ion Battery Market Forecast 2020-2030
8.7.7. Rest of Asia Pacific Lithium-Ion Battery Market Forecast 2020-2030
8.8. Middle East and Africa Lithium-Ion Battery Market Forecast 2020-2030
8.8.1. Saudi Arabia Lithium-Ion Battery Market Forecast 2020-2030
8.8.2. UAE Lithium-Ion Battery Market Forecast 2020-203
8.8.3. South Africa Lithium-Ion Battery Market Forecast 2020-2030
8.8.4. Turkey Lithium-Ion Battery Market Forecast 2020-2030
8.8.5. Rest of Middle East and Africa Lithium-Ion Battery Market Forecast 2020-2030
8.9. Latin America Lithium-Ion Battery Market Forecast 2020-2030
8.9.1. Argentina Lithium-Ion Battery Market Forecast 2020-2030
8.9.2. Brazil Lithium-Ion Battery Market Forecast 2020-2030
8.9.3. Rest of Latin America Lithium-Ion Battery Market Forecast 2020-2030
9. Leading Companies in the Lithium-Ion Battery Market
9.1. Panasonic Corporation
9.1.1. Panasonic Corporation Total Company Sales 2015-2019
9.1.2. Recent developments
9.2. Toshiba Corporation
9.2.1. Toshiba Corporation Total Company Sales 2015-2019
9.2.2. Recent developments
9.3. Johnson Controls
9.3.1. Johnson Controls Total Company Sales 2015-2018
9.3.2. Recent developments
9.4. Samsung SDI Co. Ltd.
9.4.1. Samsung SDI Co. Ltd. Total Company Sales 2015-2019
9.4.2. Recent developments
9.5. LG Chem Ltd.
9.5.1. LG Chem Ltd. Total Company Sales 2015-2018
9.5.2. Recent developments
9.6. BYD Co. Ltd.
9.6.1. BYD Co. Ltd. Total Company Sales 2015-2018
9.6.2. Recent developments
9.7. GS Yuasa Corporation
9.7.1. GS Yuasa Corporation Total Company Sales 2015-2019
9.7.2. Recent developments
9.8. Hitachi Ltd.
9.8.1. Hitachi Ltd Total Company Sales 2015-2019
9.8.2. Recent developments
9.9. Philips AG
9.9.1. Koninklijke Philips N.V.Total Company Sales 2015-2019
9.9.2. Recent developments
9.10. Tesla Inc.
9.10.1. Tesla Inc. Total Company Sales 2015-2019
9.10.2. Recent developments
9.11. Renault Group
9.11.1. Renault Group Total Company Sales 2015-2019
9.11.2. Recent developments
9.12. Umicore S.A.
9.12.1. Financial performance
9.12.2. Recent developments
9.13. Asahi Kasei Corporation
9.13.1. Financial performance
9.13.2. Recent developments
9.14. Sumitomo Corporation
9.14.1. Financial performance
9.14.2. Recent developments
9.15. TORAY INDUSTRIES, INC.
9.15.1. Financial performance
9.15.2. Recent developments
9.16. SHOWA DENKO K.K.
9.16.1. Financial performance
9.16.2. Recent developments
9.17. Other Companies Involved in the Lithium-Ion Battery Market 2020
10. Conclusions and Recommendations
11. Glossary
Associated Visiongain Reports
Visiongain Report Sales Order Form
Appendix A
About Visiongain
Appendix B
Visiongain report evaluation form
List of Tables
Table 3.1 Electric vehicle and battery manufacturing plant investments
Table 3.2 Vehicle models, assembly locations, and estimated sales
Table 4.1 Global Lithium-Ion Battery by Application Forecast 2020-2030 (US$ billion, AGR %, CAGR %, Cumulative)
Table 5.1 Global Lithium-Ion Battery by Material Forecast 2020-2030 (US$ billion, AGR %, CAGR %, Cumulative)
Table 6.1 Global Lithium-Ion Battery by Cathode Forecast 2020-2030 (US$ billion, AGR %, CAGR %, Cumulative)
Table 7.1 Global Lithium-Ion Battery by Anode Forecast 2020-2030 (US$ billion, AGR %, CAGR %, Cumulative)
Table 8.1 North America Lithium-Ion Battery by Application Forecast2020-2030 (US$ billion, AGR %, CAGR %, Cumulative)
Table 8.2 North America Lithium-Ion Battery by Material Forecast 2020-2030 (US$ billion, AGR %, CAGR %, Cumulative)
Table 8.3 North America Lithium-Ion Battery by Cathode Forecast 2020-2030 (US$ billion, AGR %, CAGR %, Cumulative)
Table 8.4 North America Lithium-Ion Battery by Anode Forecast 2020-2030 (US$ billion, AGR %, CAGR %, Cumulative)
Table 8.5 U.S. Lithium-Ion Battery by Application Forecast2020-2030 (US$ billion, AGR %, CAGR %, Cumulative)
Table 8.6 U.S. Lithium-Ion Battery by Material Forecast 2020-2030 (US$ billion, AGR %, CAGR %, Cumulative)
Table 8.7 U.S. Lithium-Ion Battery by Cathode Forecast 2020-2030 (US$ billion, AGR %, CAGR %, Cumulative)
Table 8.8 U.S. Lithium-Ion Battery by Anode Forecast 2020-2030 (US$ billion, AGR %, CAGR %, Cumulative)
Table 8.9 Canada Lithium-Ion Battery by Application Forecast2020-2030 (US$ billion, AGR %, CAGR %, Cumulative)
Table 8.10 Canada Lithium-Ion Battery by Material Forecast 2020-2030 (US$ billion, AGR %, CAGR %, Cumulative)
Table 8.11 Canada Lithium-Ion Battery by Cathode Forecast 2020-2030 (US$ billion, AGR %, CAGR %, Cumulative)
Table 8.12 Canada Lithium-Ion Battery by Anode Forecast 2020-2030 (US$ billion, AGR %, CAGR %, Cumulative)
Table 8.13 Mexico Lithium-Ion Battery by Application Forecast2020-2030 (US$ billion, AGR %, CAGR %, Cumulative)
Table 8.14 Mexico Lithium-Ion Battery by Material Forecast 2020-2030 (US$ billion, AGR %, CAGR %, Cumulative)
Table 8.15 Mexico Lithium-Ion Battery by Cathode Forecast 2020-2030 (US$ billion, AGR %, CAGR %, Cumulative)
Table 8.16 Mexico Lithium-Ion Battery by Anode Forecast 2020-2030 (US$ billion, AGR %, CAGR %, Cumulative)
Table 8.17 Europe Lithium-Ion Battery by Application Forecast 2020-2030 (US$ billion, AGR %, CAGR %, Cumulative)
Table 8.18 Europe Lithium-Ion Battery by Material Forecast 2020-2030 (US$ billion, AGR %, CAGR %, Cumulative)
Table 8.19 Europe Lithium-Ion Battery by Cathode Forecast 2020-2030 (US$ billion, AGR %, CAGR %, Cumulative)
Table 8.20 Europe Lithium-Ion Battery by Anode Forecast 2020-2030 (US$ billion, AGR %, CAGR %, Cumulative)
Table 8.21 Germany Lithium-Ion Battery by Application Forecast2020-2030 (US$ billion, AGR %, CAGR %, Cumulative)
Table 8.22 Germany Lithium-Ion Battery by Material Forecast 2020-2030 (US$ billion, AGR %, CAGR %, Cumulative)
Table 8.23 Germany Lithium-Ion Battery by Cathode Forecast 2020-2030 (US$ billion, AGR %, CAGR %, Cumulative)
Table 8.24 Germany Lithium-Ion Battery by Anode Forecast 2020-2030 (US$ billion, AGR %, CAGR %, Cumulative)
Table 8.25 France Lithium-Ion Battery by Application Forecast2020-2030 (US$ billion, AGR %, CAGR %, Cumulative)
Table 8.26 France Lithium-Ion Battery by Material Forecast 2020-2030 (US$ billion, AGR %, CAGR %, Cumulative)
Table 8.27 France Lithium-Ion Battery by Cathode Forecast 2020-2030 (US$ billion, AGR %, CAGR %, Cumulative)
Table 8.28 France Lithium-Ion Battery by Anode Forecast 2020-2030 (US$ billion, AGR %, CAGR %, Cumulative)
Table 8.29 Italy Lithium-Ion Battery by Application Forecast2020-2030 (US$ billion, AGR %, CAGR %, Cumulative)
Table 8.30 Italy Lithium-Ion Battery by Material Forecast 2020-2030 (US$ billion, AGR %, CAGR %, Cumulative)
Table 8.31 Italy Lithium-Ion Battery by Cathode Forecast 2020-2030 (US$ billion, AGR %, CAGR %, Cumulative)
Table 8.32 Italy Lithium-Ion Battery by Anode Forecast 2020-2030 (US$ billion, AGR %, CAGR %, Cumulative)
Table 8.33 UK Lithium-Ion Battery by Application Forecast2020-2030 (US$ billion, AGR %, CAGR %, Cumulative)
Table 8.34 UK Lithium-Ion Battery by Material Forecast 2020-2030 (US$ billion, AGR %, CAGR %, Cumulative)
Table 8.35 UK Lithium-Ion Battery by Cathode Forecast 2020-2030 (US$ billion, AGR %, CAGR %, Cumulative)
Table 8.36 UK Lithium-Ion Battery by Anode Forecast 2020-2030 (US$ billion, AGR %, CAGR %, Cumulative)
Table 8.37 Spain Lithium-Ion Battery by Application Forecast2020-2030 (US$ billion, AGR %, CAGR %, Cumulative)
Table 8.38 Spain Lithium-Ion Battery by Material Forecast 2020-2030 (US$ billion, AGR %, CAGR %, Cumulative)
Table 8.39 Spain Lithium-Ion Battery by Cathode Forecast 2020-2030 (US$ billion, AGR %, CAGR %, Cumulative)
Table 8.40 Spain Lithium-Ion Battery by Anode Forecast 2020-2030 (US$ billion, AGR %, CAGR %, Cumulative)
Table 8.41 Russia Lithium-Ion Battery by Application Forecast2020-2030 (US$ billion, AGR %, CAGR %, Cumulative)
Table 8.42 Russia Lithium-Ion Battery by Material Forecast 2020-2030 (US$ billion, AGR %, CAGR %, Cumulative)
Table 8.43 Russia Lithium-Ion Battery by Cathode Forecast 2020-2030 (US$ billion, AGR %, CAGR %, Cumulative)
Table 8.44 Russia Lithium-Ion Battery by Anode Forecast 2020-2030 (US$ billion, AGR %, CAGR %, Cumulative)
Table 8.45 Norway Lithium-Ion Battery by Application Forecast2020-2030 (US$ billion, AGR %, CAGR %, Cumulative)
Table 8.46 Norway Lithium-Ion Battery by Material Forecast 2020-2030 (US$ billion, AGR %, CAGR %, Cumulative)
Table 8.47 Norway Lithium-Ion Battery by Cathode Forecast 2020-2030 (US$ billion, AGR %, CAGR %, Cumulative)
Table 8.48 Norway Lithium-Ion Battery by Anode Forecast 2020-2030 (US$ billion, AGR %, CAGR %, Cumulative)
Table 8.49 Netherlands Lithium-Ion Battery by Application Forecast2020-2030 (US$ billion, AGR %, CAGR %, Cumulative)
Table 8.50 Netherlands Lithium-Ion Battery by Material Forecast 2020-2030 (US$ billion, AGR %, CAGR %, Cumulative)
Table 8.51 Netherlands Lithium-Ion Battery by Cathode Forecast 2020-2030 (US$ billion, AGR %, CAGR %, Cumulative)
Table 8.52 Netherlands Lithium-Ion Battery by Anode Forecast 2020-2030 (US$ billion, AGR %, CAGR %, Cumulative)
Table 8.53 Rest of Europe Lithium-Ion Battery by Application Forecast2020-2030 (US$ billion, AGR %, CAGR %, Cumulative)
Table 8.54 Rest of Europe Lithium-Ion Battery by Material Forecast 2020-2030 (US$ billion, AGR %, CAGR %, Cumulative)
Table 8.55 Rest of Europe Lithium-Ion Battery by Cathode Forecast 2020-2030 (US$ billion, AGR %, CAGR %, Cumulative)
Table 8.56 Rest of Europe Lithium-Ion Battery by Anode Forecast 2020-2030 (US$ billion, AGR %, CAGR %, Cumulative)
Table 8.57 Asia Pacific Lithium-Ion Battery by Application Forecast2020-2030 (US$ billion, AGR %, CAGR %, Cumulative)
Table 8.58 Asia Pacific Lithium-Ion Battery by Material Forecast 2020-2030 (US$ billion, AGR %, CAGR %, Cumulative)
Table 8.59 Asia Pacific Lithium-Ion Battery by Cathode Forecast 2020-2030 (US$ billion, AGR %, CAGR %, Cumulative)
Table 8.60 Asia Pacific Lithium-Ion Battery by Anode Forecast 2020-2030 (US$ billion, AGR %, CAGR %, Cumulative)
Table 8.61 China Lithium-Ion Battery by Application Forecast2020-2030 (US$ billion, AGR %, CAGR %, Cumulative)
Table 8.62 China Lithium-Ion Battery by Material Forecast 2020-2030 (US$ billion, AGR %, CAGR %, Cumulative)
Table 8.63 China Lithium-Ion Battery by Cathode Forecast 2020-2030 (US$ billion, AGR %, CAGR %, Cumulative)
Table 8.64 China Lithium-Ion Battery by Anode Forecast 2020-2030 (US$ billion, AGR %, CAGR %, Cumulative)
Table 8.65 Japan Lithium-Ion Battery by Application Forecast2020-2030 (US$ billion, AGR %, CAGR %, Cumulative
Table 8.66 Japan Lithium-Ion Battery by Material Forecast 2020-2030 (US$ billion, AGR %, CAGR %, Cumulative)
Table 8.67 Japan Lithium-Ion Battery by Cathode Forecast 2020-2030 (US$ billion, AGR %, CAGR %, Cumulative)
Table 8.68 Japan Lithium-Ion Battery by Anode Forecast 2020-2030 (US$ billion, AGR %, CAGR %, Cumulative)
Table 8.69 South Korea Lithium-Ion Battery by Application Forecast2020-2030 (US$ billion, AGR %, CAGR %, Cumulative)
Table 8.70 South Korea Lithium-Ion Battery by Material Forecast 2020-2030 (US$ billion, AGR %, CAGR %, Cumulative)
Table 8.71 South Korea Lithium-Ion Battery by Cathode Forecast 2020-2030 (US$ billion, AGR %, CAGR %, Cumulative)
Table 8.72 South Korea Lithium-Ion Battery by Anode Forecast 2020-2030 (US$ billion, AGR %, CAGR %, Cumulative)
Table 8.73 India Lithium-Ion Battery by Application Forecast2020-2030 (US$ billion, AGR %, CAGR %, Cumulative)
Table 8.74 India Lithium-Ion Battery by Material Forecast 2020-2030 (US$ billion, AGR %, CAGR %, Cumulative)
Table 8.75 India Lithium-Ion Battery by Cathode Forecast 2020-2030 (US$ billion, AGR %, CAGR %, Cumulative)
Table 8.76 India Lithium-Ion Battery by Anode Forecast 2020-2030 (US$ billion, AGR %, CAGR %, Cumulative)
Table 8.77 Australia Lithium-Ion Battery by Application Forecast2020-2030 (US$ billion, AGR %, CAGR %, Cumulative)
Table 8.78 Australia Lithium-Ion Battery by Material Forecast 2020-2030 (US$ billion, AGR %, CAGR %, Cumulative)
Table 8.79 Australia Lithium-Ion Battery by Cathode Forecast 2020-2030 (US$ billion, AGR %, CAGR %, Cumulative)
Table 8.80 Australia Lithium-Ion Battery by Anode Forecast 2020-2030 (US$ billion, AGR %, CAGR %, Cumulative)
Table 8.81 Indonesia Lithium-Ion Battery by Application Forecast2020-2030 (US$ billion, AGR %, CAGR %, Cumulative)
Table 8.82 Indonesia Lithium-Ion Battery by Material Forecast 2020-2030 (US$ billion, AGR %, CAGR %, Cumulative)
Table 8.83 Indonesia Lithium-Ion Battery by Cathode Forecast 2020-2030 (US$ billion, AGR %, CAGR %, Cumulative)
Table 8.84 Indonesia Lithium-Ion Battery by Anode Forecast 2020-2030 (US$ billion, AGR %, CAGR %, Cumulative)
Table 8.85 Rest of Asia Pacific Lithium-Ion Battery by Application Forecast2020-2030 (US$ billion, AGR %, CAGR %, Cumulative)
Table 8.87 Rest of Asia Pacific Lithium-Ion Battery by Material Forecast 2020-2030 (US$ billion, AGR %, CAGR %, Cumulative)
Table 8.88 Rest of Asia Pacific Lithium-Ion Battery by Cathode Forecast 2020-2030 (US$ billion, AGR %, CAGR %, Cumulative)
Table 8.89 Rest of Asia Pacific Lithium-Ion Battery by Anode Forecast 2020-2030 (US$ billion, AGR %, CAGR %, Cumulative)
Table 8.90 Middle East and Africa Lithium-Ion Battery by Application Forecast2020-2030 (US$ billion, AGR %, CAGR %, Cumulative)
Table 8.91 Middle East and Africa Lithium-Ion Battery by Material Forecast 2020-2030 (US$ billion, AGR %, CAGR %, Cumulative)
Table 8.92 Middle East and Africa Lithium-Ion Battery by Cathode Forecast 2020-2030 (US$ billion, AGR %, CAGR %, Cumulative)
Table 8.93 Middle East and Africa Lithium-Ion Battery by Anode Forecast 2020-2030 (US$ billion, AGR %, CAGR %, Cumulative)
Table 8.94 Saudi Arabia Lithium-Ion Battery by Application Forecast2020-2030 (US$ billion, AGR %, CAGR %, Cumulative)
Table 8.95 Saudi Arabia Lithium-Ion Battery by Material Forecast 2020-2030 (US$ billion, AGR %, CAGR %, Cumulative)
Table 8.96 Saudi Arabia Lithium-Ion Battery by Cathode Forecast 2020-2030 (US$ billion, AGR %, CAGR %, Cumulative)
Table 8.97 Saudi Arabia Lithium-Ion Battery by Anode Forecast 2020-2030 (US$ billion, AGR %, CAGR %, Cumulative)
Table 8.98 UAE Lithium-Ion Battery by Application Forecast2020-2030 (US$ billion, AGR %, CAGR %, Cumulative)
Table 8.99 UAE Lithium-Ion Battery by Material Forecast 2020-2030 (US$ billion, AGR %, CAGR %, Cumulative)
Table 8.100 UAE Lithium-Ion Battery by Cathode Forecast 2020-2030 (US$ billion, AGR %, CAGR %, Cumulative)
Table 8.101 UAE Lithium-Ion Battery by Anode Forecast 2020-2030 (US$ billion, AGR %, CAGR %, Cumulative)
Table 8.102 South Africa Lithium-Ion Battery by Application Forecast2020-2030 (US$ billion, AGR %, CAGR %, Cumulative)
Table 8.103 South Africa Lithium-Ion Battery by Material Forecast 2020-2030 (US$ billion, AGR %, CAGR %, Cumulative)
Table 8.104 South Africa Lithium-Ion Battery by Cathode Forecast 2020-2030 (US$ billion, AGR %, CAGR %, Cumulative)
Table 8.105 South Africa Lithium-Ion Battery by Anode Forecast 2020-2030 (US$ billion, AGR %, CAGR %, Cumulative)
Table 8.106 Turkey Lithium-Ion Battery by Application Forecast2020-2030 (US$ billion, AGR %, CAGR %, Cumulative)
Table 8.107 Turkey Lithium-Ion Battery by Material Forecast 2020-2030 (US$ billion, AGR %, CAGR %, Cumulative)
Table 8.108 Turkey Lithium-Ion Battery by Cathode Forecast 2020-2030 (US$ billion, AGR %, CAGR %, Cumulative)
Table 8.109 Turkey Lithium-Ion Battery by Anode Forecast 2020-2030 (US$ billion, AGR %, CAGR %, Cumulative)
Table 8.110 Rest of MEA Lithium-Ion Battery by Application Forecast2020-2030 (US$ billion, AGR %, CAGR %, Cumulative)
Table 8.111 Rest of MEA Lithium-Ion Battery by Material Forecast 2020-2030 (US$ billion, AGR %, CAGR %, Cumulative)
Table 8.112 Rest of MEA Lithium-Ion Battery by Cathode Forecast 2020-2030 (US$ billion, AGR %, CAGR %, Cumulative)
Table 8.113 Rest of MEA Lithium-Ion Battery by Anode Forecast 2020-2030 (US$ billion, AGR %, CAGR %, Cumulative)
Table 8.114 Latin America Lithium-Ion Battery by Application Forecast2020-2030 (US$ billion, AGR %, CAGR %, Cumulative)
Table 8.115 Latin America Lithium-Ion Battery by Material Forecast 2020-2030 (US$ billion, AGR %, CAGR %, Cumulative)
Table 8.116 Latin America Lithium-Ion Battery by Cathode Forecast 2020-2030 (US$ billion, AGR %, CAGR %, Cumulative)
Table 8.117 Latin America Lithium-Ion Battery by Anode Forecast 2020-2030 (US$ billion, AGR %, CAGR %, Cumulative)
Table 8.118 Argentina Lithium-Ion Battery by Application Forecast2020-2030 (US$ billion, AGR %, CAGR %, Cumulative)
Table 8.119 Argentina Lithium-Ion Battery by Material Forecast 2020-2030 (US$ billion, AGR %, CAGR %, Cumulative)
Table 8.120 Argentina Lithium-Ion Battery by Cathode Forecast 2020-2030 (US$ billion, AGR %, CAGR %, Cumulative)
Table 8.121 Argentina Lithium-Ion Battery by Anode Forecast 2020-2030 (US$ billion, AGR %, CAGR %, Cumulative)
Table 8.122 Brazil Lithium-Ion Battery by Application Forecast2020-2030 (US$ billion, AGR %, CAGR %, Cumulative)
Table 8.123 Brazil Lithium-Ion Battery by Material Forecast 2020-2030 (US$ billion, AGR %, CAGR %, Cumulative)
Table 8.124 Brazil Lithium-Ion Battery by Cathode Forecast 2020-2030 (US$ billion, AGR %, CAGR %, Cumulative)
Table 8.125 Brazil Lithium-Ion Battery by Anode Forecast 2020-2030 (US$ billion, AGR %, CAGR %, Cumulative)
Table 8.126 Rest of Latin America Lithium-Ion Battery by Application Forecast2020-2030 (US$ billion, AGR %, CAGR %, Cumulative)
Table 8.127 Rest of Latin America Lithium-Ion Battery by Material Forecast 2020-2030 (US$ billion, AGR %, CAGR %, Cumulative)
Table 8.128 Rest of Latin America Lithium-Ion Battery by Cathode Forecast 2020-2030 (US$ billion, AGR %, CAGR %, Cumulative)
Table 8.129 Rest of Latin America Lithium-Ion Battery by Anode Forecast 2020-2030 (US$ billion, AGR %, CAGR %, Cumulative)
Table 9.1 Other Companies Involved in the Lithium-Ion Battery Market 2020 (Company, Location)
Table 10.1 Global Lithium-Ion Battery Market by Region Market Forecast 2020-2030 (US$bn, AGR %, Cumulative)
List of Figures
Figure 2.1 Global Lithium-Ion Battery Market Segmentation Overview
Figure 2.2 Global Lithium-Ion Battery Price Analysis
Figure 2.3 Average cost structure of lithium-ion cell in 2017 (%)
Figure 2.4 Value chain analysis
Figure 2.5 Porter’s Five Forces
Figure 3.1: Annual lithium-ion battery price, 2010 – 2017 (USD/kWh)
Figure 3.2: Global lithium demand, 2015 – 2025, (LCE Kilo Tons)
Figure 3.3 Lithium from recycled lithium-ion batteries in 2025(tonnes)
Figure 4.1 Global Lithium-Ion Battery by Application AGR Forecast 2020-2030 (AGR %)
Figure 5.1 Global Lithium-Ion Battery by Material AGR Forecast 2020-2030 (AGR %)
Figure 6.1 Global Lithium-Ion Battery by Cathode AGR Forecast 2020-2030 (AGR %)
Figure 7.1 Global Lithium-Ion Battery by Anode AGR Forecast 2020-2030 (AGR %)
Figure 8.1 Global Lithium-Ion Battery by Region Forecast 2020-2030 (US$ billion, Total Market Sales AGR %)
Figure 8.2 North America Lithium-Ion Battery by Country Forecast 2020-2030 (US$ billion, Total Market Sales AGR %)
Figure 8.3 EU5 Lithium-Ion Battery by Country Forecast 2020-2030 (US$ billion, Total Market Sales AGR %)
Figure 8.4 BRIC Lithium-Ion Battery by Country Forecast 2020-2030 (US$ billion, Total Market Sales AGR %)
Figure 8.5 North America Lithium-Ion Battery by Application AGR Forecast 2020-2030 (AGR %)
Figure 8.6 North America Lithium-Ion Battery by Application Forecast 2020-2030 (US$ billion, North America Total Market Sales AGR %)
Figure 8.7 North America Lithium-Ion Battery Market Share Forecast by Application 2020, 2025, 2030 (% Share)
Figure 8.8 1U.S. Lithium-Ion Battery by Application AGR Forecast 2020-2030 (AGR %)
Figure 8.9 U.S. Lithium-Ion Battery by Application Forecast 2020-2030 (US$ billion, U.S. Total Market Sales AGR %)
Figure 8.10 U.S. Lithium-Ion Battery Market Share Forecast by Application 2020, 2025, 2030 (% Share)
Figure 8.11 Canada Lithium-Ion Battery by Application AGR Forecast 2020-2030 (AGR %)
Figure 8.12 Canada Lithium-Ion Battery by Application Forecast 2020-2030 (US$ billion, Canada Total Market Sales AGR %)
Figure 8.13 Canada Lithium-Ion Battery Market Share Forecast by Application 2020, 2025, 2030 (% Share)
Figure 8.14 Mexico Lithium-Ion Battery by Application AGR Forecast 2020-2030 (AGR %)
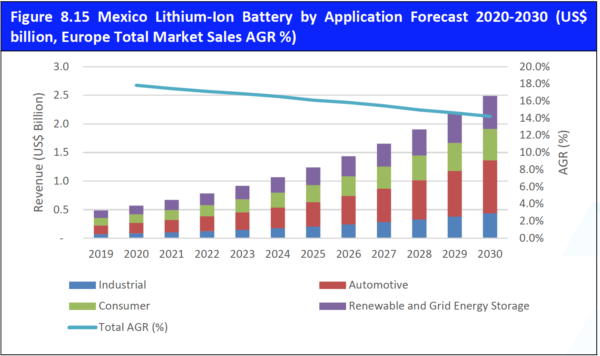
Figure 8.15 Mexico Lithium-Ion Battery by Application Forecast 2020-2030 (US$ billion, Europe Total Market Sales AGR %)
Figure 8.16 Mexico Lithium-Ion Battery Market Share Forecast by Application 2020, 2025, 2030 (% Share)
Figure 8.17 Europe Lithium-Ion Battery by Application AGR Forecast 2020-2030 (AGR %)
Figure 8.18 Europe Lithium-Ion Battery by Application Forecast 2020-2030 (US$ billion, Europe Total Market Sales AGR %)
Figure 8.19 Europe Lithium-Ion Battery Market Share Forecast by Application 2020, 2025, 2030 (% Share)
Figure 8.20 Germany Lithium-Ion Battery by Application AGR Forecast 2020-2030 (AGR %)
Figure 8.21 Germany Lithium-Ion Battery by Application Forecast 2020-2030 (US$ billion, Germany Total Market Sales AGR %)
Figure 8.22 Germany Lithium-Ion Battery Market Share Forecast by Application 2020, 2025, 2030 (% Share)
Figure 8.23 France Lithium-Ion Battery by Application AGR Forecast 2020-2030 (AGR %)
Figure 8.24 France Lithium-Ion Battery by Application Forecast 2020-2030 (US$ billion, France Total Market Sales AGR %)
Figure 8.25 France Lithium-Ion Battery Market Share Forecast by Application 2020, 2025, 2030 (% Share)
Figure 8.26 Italy Lithium-Ion Battery by Application AGR Forecast 2020-2030 (AGR %)
Figure 8.27 Italy Lithium-Ion Battery by Application Forecast 2020-2030 (US$ billion, Italy Total Market Sales AGR %)
Figure 8.28 Italy Lithium-Ion Battery Market Share Forecast by Application 2020, 2025, 2030 (% Share)
Figure 8.29 UK Lithium-Ion Battery by Application AGR Forecast 2020-2030 (AGR %)
Figure 8.30 UK Lithium-Ion Battery by Application Forecast 2020-2030 (US$ billion, UK Total Market Sales AGR %)
Figure 8.31 UK Lithium-Ion Battery Market Share Forecast by Application 2020, 2025, 2030 (% Share)
Figure 8.32 Spain Lithium-Ion Battery by Application AGR Forecast 2020-2030 (AGR %)
Figure 8.33 Spain Lithium-Ion Battery by Application Forecast 2020-2030 (US$ billion, Spain Total Market Sales AGR %)
Figure 8.34 Spain Lithium-Ion Battery Market Share Forecast by Application 2020, 2025, 2030 (% Share)
Figure 8.35 Russia Lithium-Ion Battery by Application AGR Forecast 2020-2030 (AGR %)
Figure 8.36 Russia Lithium-Ion Battery by Application Forecast 2020-2030 (US$ billion, Russia Total Market Sales AGR %)
Figure 8.37 Russia Lithium-Ion Battery Market Share Forecast by Application 2020, 2025, 2030 (% Share)
Figure 8.37 Norway Lithium-Ion Battery by Application AGR Forecast 2020-2030 (AGR %)
Figure 8.38 Norway Lithium-Ion Battery by Application Forecast 2020-2030 (US$ billion, Norway Total Market Sales AGR %)
Figure 8.39 Norway Lithium-Ion Battery Market Share Forecast by Application 2020, 2025, 2030 (% Share)
Figure 8.40 Netherlands Lithium-Ion Battery by Application AGR Forecast 2020-2030 (AGR %)
Figure 8.41 Netherlands Lithium-Ion Battery by Application Forecast 2020-2030 (US$ billion, Netherlands Total Market Sales AGR %)
Figure 8.42 Netherlands Lithium-Ion Battery Market Share Forecast by Application 2020, 2025, 2030 (% Share)
Figure 8.43 Rest of Europe Lithium-Ion Battery by Application AGR Forecast 2020-2030 (AGR %)
Figure 8.44 Rest of Europe Lithium-Ion Battery by Application Forecast 2020-2030 (US$ billion, Rest of Europe Total Market Sales AGR %)
Figure 8.45 Rest of Europe Lithium-Ion Battery Market Share Forecast by Application 2020, 2025, 2030 (% Share)
Figure 8.46 Asia Pacific Lithium-Ion Battery by Application AGR Forecast 2020-2030 (AGR %)
Figure 8.47 Asia Pacific Lithium-Ion Battery by Application Forecast 2020-2030 (US$ billion, Asia Pacific Total Market Sales AGR %)
Figure 8.48 Asia Pacific Lithium-Ion Battery Market Share Forecast by Application 2020, 2025, 2030 (% Share)
Figure 8.49 China Lithium-Ion Battery by Application AGR Forecast 2020-2030 (AGR %)
Figure 8.50 China Lithium-Ion Battery by Application Forecast 2020-2030 (US$ billion, China Total Market Sales AGR %)
Figure 8.51 China Lithium-Ion Battery Market Share Forecast by Application 2020, 2025, 2030 (% Share
Figure 8.52 Japan Lithium-Ion Battery by Application AGR Forecast 2020-2030 (AGR %)
Figure 8.53 Japan Lithium-Ion Battery by Application Forecast 2020-2030 (US$ billion, Japan Total Market Sales AGR %)
Figure 8.54 Japan Lithium-Ion Battery Market Share Forecast by Application 2020, 2025, 2030 (% Share)
Figure 8.55 South Korea Lithium-Ion Battery by Application AGR Forecast 2020-2030 (AGR %)
Figure 8.56 South Korea Lithium-Ion Battery by Application Forecast 2020-2030 (US$ billion, South Korea Total Market Sales AGR %)
Figure 8.57 South Korea Lithium-Ion Battery Market Share Forecast by Application 2020, 2025, 2030 (% Share)
Figure 8.59 New registrations of battery electric cars in India from 2008 to 2017
Figure 8.60 India Lithium-Ion Battery by Application AGR Forecast 2020-2030 (AGR %)
Figure 8.61 India Lithium-Ion Battery by Application Forecast 2020-2030 (US$ billion, India Total Market Sales AGR %)
Figure 8.62 India Lithium-Ion Battery Market Share Forecast by Application 2020, 2025, 2030 (% Share)
Figure 8.63 Australia Lithium-Ion Battery by Application AGR Forecast 2020-2030 (AGR %)
Figure 8.64 Australia Lithium-Ion Battery by Application Forecast 2020-2030 (US$ billion, Australia Total Market Sales AGR %)
Figure 8.65 Australia Lithium-Ion Battery Market Share Forecast by Application 2020, 2025, 2030 (% Share)
Figure 8.66 Indonesia Lithium-Ion Battery by Application AGR Forecast 2020-2030 (AGR %)
Figure 8.67 Indonesia Lithium-Ion Battery by Application Forecast 2020-2030 (US$ billion, Indonesia Total Market Sales AGR %)
Figure 8.68 Indonesia Lithium-Ion Battery Market Share Forecast by Application 2020, 2025, 2030 (% Share)
Figure 8.86 Rest of Asia Pacific Lithium-Ion Battery by Application AGR Forecast 2020-2030 (AGR %)
Figure 8.69 Rest of Asia Pacific Lithium-Ion Battery by Application Forecast 2020-2030 (US$ billion, Rest of Asia Pacific Total Market Sales AGR %)
Figure 8.70 Rest of Asia Pacific Lithium-Ion Battery Market Share Forecast by Application 2020, 2025, 2030 (% Share)
Figure 8.71 Middle East and Africa Lithium-Ion Battery by Application AGR Forecast 2020-2030 (AGR %)
Figure 8.72 Middle East and Africa Lithium-Ion Battery by Application Forecast 2020-2030 (US$ billion, Middle East and Africa Total Market Sales AGR %)
Figure 8.73 Middle East and Africa Lithium-Ion Battery Market Share Forecast by Application 2020, 2025, 2030 (% Share)
Figure 8.74 Saudi Arabia Lithium-Ion Battery by Application AGR Forecast 2020-2030 (AGR %)
Figure 8.75 Saudi Arabia Lithium-Ion Battery by Application Forecast 2020-2030 (US$ billion, Saudi Arabia Total Market Sales AGR %)
Figure 8.76 Saudi Arabia Lithium-Ion Battery Market Share Forecast by Application 2020, 2025, 2030 (% Share)
Figure 8.77 UAE Lithium-Ion Battery by Application AGR Forecast 2020-2030 (AGR %)
Figure 8.78 UAE Lithium-Ion Battery by Application Forecast 2020-2030 (US$ billion, UAE Total Market Sales AGR %)
Figure 8.79 UAE Lithium-Ion Battery Market Share Forecast by Application 2020, 2025, 2030 (% Share)
Figure 8.80 South Africa Lithium-Ion Battery by Application AGR Forecast 2020-2030 (AGR %)
Figure 8.81 South Africa Lithium-Ion Battery by Application Forecast 2020-2030 (US$ billion, South Africa Total Market Sales AGR %)
Figure 8.82 South Africa Lithium-Ion Battery Market Share Forecast by Application 2020, 2025, 2030 (% Share)
Figure 8.83 Turkey Lithium-Ion Battery by Application AGR Forecast 2020-2030 (AGR %)
Figure 8.84 Turkey Lithium-Ion Battery by Application Forecast 2020-2030 (US$ billion, Turkey Total Market Sales AGR %)
Figure 8.85 Turkey Lithium-Ion Battery Market Share Forecast by Application 2020, 2025, 2030 (% Share)
Figure 8.86 Rest of MEA Lithium-Ion Battery by Application AGR Forecast 2020-2030 (AGR %)
Figure 8.87 Rest of MEA Lithium-Ion Battery by Application Forecast 2020-2030 (US$ billion, Rest of MEA Total Market Sales AGR %)
Figure 8.88 Rest of MEA Lithium-Ion Battery Market Share Forecast by Application 2020, 2025, 2030 (% Share)
Figure 8.89 Latin America Lithium-Ion Battery by Application AGR Forecast 2020-2030 (AGR %)
Figure 8.90 Latin America Lithium-Ion Battery by Application Forecast 2020-2030 (US$ billion, Latin America Total Market Sales AGR %)
Figure 8.91 Latin America Lithium-Ion Battery Market Share Forecast by Application 2020, 2025, 2030 (% Share)
Figure 8.92 Argentina Lithium-Ion Battery by Application AGR Forecast 2020-2030 (AGR %)
Figure 8.93 Argentina Lithium-Ion Battery by Application Forecast 2020-2030 (US$ billion, Argentina Total Market Sales AGR %)
Figure 8.94 Argentina Lithium-Ion Battery Market Share Forecast by Application 2020, 2025, 2030 (% Share)
Figure 8.95 Brazil Lithium-Ion Battery by Application AGR Forecast 2020-2030 (AGR %)
Figure 8.96 Brazil Lithium-Ion Battery by Application Forecast 2020-2030 (US$ billion, Brazil Total Market Sales AGR %)
Figure 8.97 Brazil Lithium-Ion Battery Market Share Forecast by Application 2020, 2025, 2030 (% Share)
Figure 8.98 Rest of Latin America Lithium-Ion Battery by Application AGR Forecast 2020-2030 (AGR %)
Figure 8.99 Rest of Latin America Lithium-Ion Battery by Application Forecast 2020-2030 (US$ billion, Rest of Latin America Total Market Sales AGR %)
Figure 8.100 Rest of Latin America Lithium-Ion Battery Market Share Forecast by Application 2020, 2025, 2030 (% Share)
Figure 9.1 Panasonic Corporation Total Company Sales 2015-2019 (US$m, AGR %)
Figure 9.2 Toshiba Corporation Total Company Sales 2015-2019 (US$m, AGR %)
Figure 9.3 Johnson Controls Total Company Sales 2015-2018 (US$m, AGR %)
Figure 9.4 Samsung SDI Co. Ltd. Total Company Sales 2015-2019 (US$m, AGR %)
Figure 9.5 LG Chem Ltd. Total Company Sales 2015-2018 (US$m, AGR %)
Figure 9.6 BYD Co. Ltd Total Company Sales 2015-2018 (US$m, AGR %)
Figure 9.7 GS Yuasa Corporation Total Company Sales 2015-2019 (US$m, AGR %)
Figure 9.8 Hitachi Ltd Total Company Sales 2015-2019 (US$m, AGR %)
Figure 9.9 Koninklijke Philips N.V. Company Sales 2015-2019 (US$m, AGR %)
Figure 9.10 Tesla Inc. Company Sales 2015-2019 (US$m, AGR %)
Figure 9.11Renault Group Company Sales 2015-2019 (US$m, AGR %)
Figure 9.12 Umicore S.A. Sales 2015-2019 (US$m, AGR %)
Figure 9.13 Asahi Kasei Corporation Sales 2015-2018 (US$m, AGR %)
Figure 9.14 Sumitomo Corporation Sales 2017-2019 (US$m, AGR %)
Figure 9.15 Toray Industries, Inc. Sales 2015-2019 (US$m, AGR %)
Figure 9.16 Showa Denko K.K. Sales 2015-2015 (US$m, AGR %)
A123 Systems
AAP Global Limited
ABB
ABSL Power Solutions
AC Solar Warehouse
Accutronics Ltd.
Advanced Battery Management Ltd
AGM Batteries Ltd.
Anesco UK
Automotive Energy Supply Corporation (AESC)
Aved Electronics, Inc.
Axion Power International, Inc.
BAK Battery
Batech South Korea, Inc.
Battery Power Technology Ltd.
Battery-Biz Inc.
Bender GmbH
Boston-Power
Bren-Tronics Inc.
BYD Co. Ltd
Camelion Battery Ltd.
CBAK Energy Technology, Inc
Cell Pack Solutions Ltd.
Cell-Con Inc.
China BAK Battery, Inc.
Chint Group
Contemporary Amperex Technology Ltd. (CATL)
Corvus Energy Inc.
Customer S
Cyber-Power Electronic Corp.
Daimler AG
Dell Labs
Denso Corporation
Ding Tai Battery Co. Ltd.
Dong Yang R&D Co., Ltd.
Dow Kokam
Duracell, Inc.
EaglePicher Technologies, LLC
ElecSys France
Electrovaya Inc.
Ener1, Inc.
Enevate Corporation
Envia Systems, Inc.
Envision
E-One Moli Energy Ltd.
Excell Battery Group
Fundação Parque Tecnológico Itaipu (FPTI)
Genport srl
GlobTek, Inc.
GP Batteries USA
Graphenano
GS Battery USA
GS Yuasa Corporation
GSR Capital
Hitachi Ltd.
HYB Battery Co. Ltd.
IBT Power Limited
INCJ
J&A Electronics Co. Ltd.
Jade technologies
Japone International Inc.
JD.com
Johnson Controls.
Johnson Controls-Hitachi Air Conditioning Company
Johnson Matthey
Kendoo Manufacturing Ltd.
LG Chem Ltd.
Litarion GmbH
Lithium Werks
Matthews Associates Inc.
Maxell Holdings
MIRA
Mitsubishi Electric Corporation
NEC Corporation
NEC Energy Devices, Ltd.
NEC Tokin Corporation
NICA Power Battery Corp.
Nissan Motor Co. Ltd.
Novofuel Inc.
Padre Electronics Co. Ltd.
Panasonic Appliances Company
Panasonic Corporation
Power Connection
Qnovo
Red Electrica de Espana
Reliance Jio
Renault Group
S.P. Electronics
SABIC
Saft Batteries
Saft Groupe S.A.
Samsung SDI Co. Ltd
Sanyo Electric Co. Ltd.
Shanghai Zhenhua Heavy Industries Company Limited
Shecom K.K.
Siemens
SK Innovation
Sony Corporation
Sony Energy Devices Corporation
Super B
Suzuki Motor Corporation
Tesla
Test Rite Battery Co. Ltd.
Textron Specialized Vehicles Inc. (TSV)
Tohoku Electric Power Company
Toshiba Corporation
Toyota
Tyco
UK Power Networks
Uniross Batteries Corp.
Valence Technology
Varta Storage
Waxman Energy
Zhejiang Jiashan Economic and Technological Development Zone Industry Corporation
Organisations mentioned
Binghamton University
Central Electrochemical Research Institute
Environmental Protection Agency (EPA)
Japan Aerospace Exploration Agency (JAXA)
Masdar Institute of Science and Technology
Ministry of Industry and Information Technology (MIIT), China
National Research Council of Canada Industrial Research Assistance Program (NRC-IRAP)
Oxford University
South Korea Advanced Institute of Science and Technology (KAIST)
U.S. Army
University of Twente
Download sample pages
Complete the form below to download your free sample pages for Lithium-Ion Battery Market Report 2020-2030
Related reports
-

Green (Renewable) Diesel Market Report 2020-2030
Visiongain’s global green diesel market report can keep you informed and up to date with the developments in the market,...
Full DetailsPublished: 16 June 2020 -

Gas to Liquids (GTL) Market Forecast 2020-2030
Visiongain assesses that the Global Gas to Liquids (GTL) market was valued at $2,915 million in 2019, and it is...
Full DetailsPublished: 25 February 2020 -

Small Scale Liquefied Natural Gas (LNG) Market Forecast 2019-2029
Visiongain has calculated that the global Small Scale Liquefied Natural Gas (LNG) Market will see a capital expenditure (CAPEX) of...
Full DetailsPublished: 18 June 2019 -

Lithium Iron Phosphate Battery Market Report 2020-2030
Are you aware that global Lithium Iron Phosphate Battery market spending reached $7,284.4 million in 2019? ...Full DetailsPublished: 27 March 2020 -
Flat Lithium-ion Battery Market Report 2020-2030
Factors Driving the Market Growth:
- Growth in E-Commerce Industry
- Development of Battery-Operated Equipment for Mining Industry
- Replacement...Full DetailsPublished: 01 January 1970 -

Concentrated Solar Power (CSP) Market Report 2019-2029
Visiongain calculates that the concentrated solar power (CSP) market will reach $37.3bn in 2019....Full DetailsPublished: 15 April 2019 -

Grid-Scale Battery Storage Technologies Market Report 2020-2030
Energy storage is the process of capturing the produced energy in devices. These devices discharge energy at any time desired...
Full DetailsPublished: 16 June 2020 -

Carbon Capture, Transportation & Storage Market Report 2021-2031
Government funding initiatives are crucial to ensure that government GHG emissions reduction targets are translated into tangible CCS projects. Visiongain...Full DetailsPublished: 29 September 2020 -

The Microgrid Market Forecast 2019-2029
Visiongain has calculated that the Microgrid Market will see a capital expenditure (CAPEX) of $12.6bn in 2019. Read on to...Full DetailsPublished: 25 February 2019 -

Advanced Energy Storage Systems Market Report 2019-2029
Distributed energy storage systems enhance system resilience, prevent blackouts and surges, and increase end user overall reliability while saving them...
Full DetailsPublished: 01 January 1970
Download sample pages
Complete the form below to download your free sample pages for Lithium-Ion Battery Market Report 2020-2030
Do you have any custom requirements we can help you with?
Any specific country, geo region, market segment or specific company information?
Email us today, we can discuss your needs and see how we can help: jamie.roberts@visiongain.com
Would you like a free report overview of the report of your choice?
If so, please drop an email to Jamie Roberts stating your chosen report title to jamie.roberts@visiongain.com
Visiongain electronics related reports are compiled using a broad and rich mixture of both primary and secondary information to produce an overall industry outlook. In order to provide our clients with the best product possible product, Visiongain analysts reach out to market-leading vendors and industry experts but also review a wealth of financial data and product information from a vast range of sources. To find out more about our reports methodology, please email jamie.roberts@visiongain.com
Would you like to get the latest Visiongain electronics reports catalogue?
What are the dynamic growth sectors? where are the regional business opportunities?
Which technologies will prevail and who are the leading companies succeeding in these sectors and why?
If you want definitive answers to business critical questions, discover Visiongain’s full range of business intelligence reports.
If so, please email Jamie Roberts on jamie.roberts@visiongain.com or call her today on +44 207 336 6100
Latest Electronics news
Visiongain Publishes Printed Electronics Market Report 2023-2033
The global Printed Electronics market was valued at US$9.94 million in 2022 and is projected to grow at a CAGR of 15.5% during the forecast period 2023-2033.
27 March 2023
Visiongain Publishes Smart TV Market Report 2023-2033
The global Smart TV market was valued at US$224 billion in 2022 and is projected to grow at a CAGR of 10.9% during the forecast period 2023-2033. And in terms of volume the market is projected to reach 320.4 million units by 2033.
08 March 2023
Visiongain Publishes Smart Manufacturing Market Report 2023-2033
The global Smart Manufacturing market was valued at US$97.81 billion in 2022 and is projected to grow at a CAGR of 14.7% during the forecast period 2023-2033.
24 January 2023
Visiongain Publishes Smart Sensors Market Report 2023-2033
The global Smart Sensors market was valued at US$57.77 billion in 2022 and is projected to grow at a CAGR of 20.5% during the forecast period 2023-2033.
23 December 2022
