• Do you need definitive CSP market data?
• Succinct CSP market analysis?
• Sectoral insights?
• Clear competitor analysis?
• Actionable business recommendations?
Read on to discover how this definitive report can transform your own research and save you time.
Concentrated Solar Power (CSP) uses lenses to concentrate large area of sunlight into a small area to produce steam and heat to generate electricity. Large CSP plants consist of heat storage systems to generate electricity at night or under a cloudy sky. The four major CSP technologies comprises of parabolic trough, linear fresnel reflector, power tower and solar dish. The CSP technology has an ability to store energy so as to provide electricity as and when required and thus helps reduce the development cost of new power plants. This can be beneficial to meet future demand for electricity. Despite this, the technology is not yet widely deployed leading to a global cumulative installation of only about 6 GW as recorded in 2018.
In addition, the supportive government policies and attractive incentives and tax exemptions are the prime factor propelling the demand of CSP globally. However, factors like high initial cost and increasing adoption of other renewable technologies such as wind energy, solar PV, etc. may hamper the growth of the CSP market. Spain accounts for the largest market share for the CSP market, accounting to the favourable geographic condition and growing demand of sustainable energy over fossil fuel.
Visiongain calculates that the concentrated solar power (CSP) market will reach $37.3bn in 2019. The parabolic trough segment dominates the concentrated solar power (CSP) market during the forecast period. The overall revenue of the CSP market will increase during the analysis period between 2019 and 2029. This latest in-depth report on the global CSP market describes trends in the market both quantitatively and qualitatively. In recent years, the global CSP market has recorded to have a growing market share owing to the supportive government policies and incentives to promote clean energy across the globe.
Report highlights
145 quantitative tables, charts, and graphs
Analysis of Key Players in Concentrated Solar Power (CSP) Market
• Abengoa Solar S.A.
• BrightSource Energy Inc
• eSolar Inc.
• Acciona S.A
• SolarReserve LLC
• SCHOTT Solar AG
• TSK Flagsol Engineering GmbH
• GDF SUEZ/Engie
• Nextera Energy, Inc.
• ACS GROUP
• FCC Recycling (UK) Ltd
• ACWA Power
• Lointek
Global Concentrated Solar Power (CSP) Market Outlook And Analysis From 2019-2029
Global Concentrated Solar Power (CSP) Market By Technology Projections Analysis And Potential From 2019-2029
• Parabolic Trough (PT) CSP Forecast 2019-2029
• Linear Fresnel Reflector (FR) CSP Forecast 2019-2029
• Power Tower (PWT) CSP Forecast 2019-2029
• Solar Dish (SD) CSP Forecast 2019-2029
Regional Concentrated Solar Power (CSP) Forecasts From 2019-2029
• US CSP Forecast 2019-2029
• Spain CSP Forecast 2019-2029
• India CSP Forecast 2019-2029
• China CSP Forecast 2019-2029
• South Africa CSP Forecast 2019-2029
• Morocco CSP Forecast 2019-2029
• UAE CSP Forecast 2019-2029
• Algeria CSP Forecast 2019-2029
• Egypt CSP Forecast 2019-2029
• Australia CSP Forecast 2019-2029
• Iran CSP Forecast 2019-2029
• Oman CSP Forecast 2019-2029
• Italy CSP Forecast 2019-2029
• Israel CSP Forecast 2019-2029
• Thailand CSP Forecast 2019-2029
• Rest of World CSP Forecast 2019-2029
The report Forecasts and Analyses the Concentrated Solar Power (CSP) Market by Nation from 2018-2028
Key questions answered
• How is the Concentrated Solar Power market evolving?
• What is driving and restraining Concentrated Solar Power dynamics?
• How will each Concentrated Solar Power submarket segment grow over the forecast period and how much sales will these submarkets account for in 2029?
• How will market shares of each Concentrated Solar Power submarket develop from 2019-2029?
• Which individual technologies will prevail and how will these shifts be responded to?
• Which Concentrated Solar Power submarket will be the main driver of the overall market from 2019-2029?
• How will political and regulatory factors influence national Concentrated Solar Power markets and submarkets?
• How will market shares of the national markets change by 2029 and which nation will lead the market in 2029?
• Who are the leading players and what are their prospects over the forecast period?
• How will the sector evolve as alliances form during the period between 2019 and 2029?
Who should read this report?
• Solar power companies
• Utility companies
• Renewable companies
• Electronics companies
• Component suppliers
• Energy storage specialists
• Engineers
• R&D staff
• Market analysts
• Consultants
• Executives
• Business development managers
• Investors
• Banks
• Industry associations
• Regulators
• Government departments
Visiongain is a trading partner with the US Federal Government
CCR Ref number: KD4R6
1. Report Overview
1.1. Global Concentrated Solar Power Market Overview
1.2. Why You Should Read This Report
1.3. How This Report Delivers
1.4. Key Questions Answered by This Analytical Report Include
1.5. Who is This Report For?
1.6. Methodology
1.7. Frequently Asked Questions (FAQ)
1.8. Associated Visiongain Reports
1.9. About Visiongain
2. Introduction to the Concentrated Solar Power Market
2.1. Concentrated Solar Power Structure
2.2. Concentrated Solar Power Definition
2.3. Brief History of Concentrated Solar Power
2.4. Concentrated Solar Power Submarkets Definition
2.4.1. Concentrated Solar Power – Parabolic Trough (PT) Submarket Definition
2.4.2. Concentrated Solar Power –Linear Fresnel Reflector Submarket Definition
2.4.3. Concentrated Solar Power –Power Tower Submarket Definition
2.4.4. Concentrated Solar Power –Solar Dish Submarket Definition
2.5. Concentrated Solar Power in Total Solar Power Market
3. Global Concentrated Solar Power Market 2019-2029
3.1. Global Concentrated Solar Power Market Forecast 2019-2029
3.2. Concentrated Solar Power Market Drivers & Restraints
3.2.1. Drivers in the Concentrated Solar Power
3.2.2. Restraints in the Concentrated Solar Power
4. Global Concentrated Solar Power By Technology Forecast 2019-2029
4.1. Global Concentrated Solar Power Parabolic Trough Technology Forecast 2019 – 2029
4.1.1. Spain Will Drive the Parabolic Trough Technology Concentrated Solar Power Market
4.2. Global Concentrated Solar Power Linear Fresnel Reflector Technology Forecast 2019 – 2029
4.2.1. Expansion in Concentrated Solar Power Adoption Will Drive The Technology Market
4.3. Global Concentrated Solar Power Power Tower Technology Forecast 2019-2029
4.3.1. Power Tower Technology Will Witness A Significant Growth During the Forecast Period
4.4. Global Concentrated Solar Power Solar Dish Technology Forecast 2019-2029
4.4.1. Solar Dish Is Predicted To Witness A Highest Growth
5. Leading National Concentrated Solar Power Market Forecast 2019-2029
5.1. The US Concentrated Solar Power Market Forecast 2019-2029
5.1.1 The US Concentrated Solar Power Market Overview 2019-2029
5.1.2 The US Concentrated Solar Power Market - Current Projects 2019-2029
5.1.3 Drivers and Restraints in the US Concentrated Solar Power Market
5.2. Spain Concentrated Solar Power Market Forecast 2019-2029
5.2.1 Spain Concentrated Solar Power Market Overview 2019-2029
5.2.2 Spain Concentrated Solar Power Market - Current Projects 2019-2029
5.2.3 Drivers And Restraints In Spain Concentrated Solar Power Market
5.3. Australia Concentrated Solar Power Market Forecast 2019-2029
5.3.1 Australia Concentrated Solar Power Market Overview 2019-2029
5.3.2 Australia Concentrated Solar Power Market - Current Projects 2019-2029
5.3.3 Drivers And Restraints in Australia Concentrated Solar Power Market
5.4. China Concentrated Solar Power Market Forecast 2019-2029
5.4.1 China Concentrated Solar Power Market Overview 2019-2029
5.4.2 China Concentrated Solar Power Market - Current Projects 2019-2029
5.4.3 Drivers and Restraints in China Concentrated Solar Power Market
5.5. India Concentrated Solar Power Market Forecast 2019-2029
5.5.1 India Concentrated Solar Power Market Overview 2019-2029
5.5.2 India Concentrated Solar Power Market - Current Projects 2019-2029
5.5.3 Drivers and Restraints in India Concentrated Solar Power Market
5.6. Morocco Concentrated Solar Power Market Forecast 2019-2029
5.6.1 Morocco Concentrated Solar Power Market Overview 2019-2029
5.6.2 Morocco Concentrated Solar Power Market - Current Projects 2019-2029
5.6.3 Drivers and Restraints in Morocco Concentrated Solar Power Market
5.7. South Africa Concentrated Solar Power Market Forecast 2019-2029
5.7.1 South Africa Concentrated Solar Power Market Overview 2019-2029
5.7.2 South Africa Concentrated Solar Power Market - Current Projects 2019-2029
5.7.3 Drivers and Restraints in South Africa Concentrated Solar Power Market
5.8. UAE Concentrated Solar Power Market Forecast 2019-2029
5.8.1 UAE Concentrated Solar Power Market Overview 2019-2029
5.8.2 Drivers and Restraints in UAE Concentrated Solar Power Market
5.9. Algeria Concentrated Solar Power Market Forecast 2019-2029
5.9.1 Algeria Concentrated Solar Power Market Overview 2019-2029
5.10. Egypt Concentrated Solar Power Market Forecast 2019-2029
5.10.1 Egyptian Concentrated Solar Power Market Overview 2019-2029
5.11. Iran Concentrated Solar Power Market Forecast 2019-2029
5.11.1 Iran Concentrated Solar Power Market Overview 2019-2029
5.12. Oman Concentrated Solar Power Market Forecast 2019-2029
5.12.1 Oman Concentrated Solar Power Market Overview 2019-2029
5.13. Italy Concentrated Solar Power Market Forecast 2019-2029
5.13.1 Italy Concentrated Solar Power Market Overview 2019-2029
5.14. Israel Concentrated Solar Power Market Forecast 2019-2029
5.14.1 Israel Concentrated Solar Power Market Overview 2019-2029
5.15. Thailand Concentrated Solar Power Market Forecast 2019-2029
5.15.1 Thailand Concentrated Solar Power Market Overview 2019-2029
5.16. Rest of World Concentrated Solar Power Market Forecast 2019-2029
5.16.1 Rest of the World Concentrated Solar Power Market Overview 2019-2029
5.16.2 Drivers and Restraints in Rest of World Concentrated Solar Power Market
6. SWOT Analysis of the Concentrated Solar Power Market Forecast 2019-2029
6.1 Strengths
6.2 Weaknesses
6.3 Opportunities
6.4 Threats
7. The Leading Companies in the Concentrated Solar Power Market
7.1. Abengoa Solar S.A.
7.1.1 Abengoa Solar S.A. Concentrated Solar Power Selected Recent Contracts / Projects / Programmes 2018
7.1.2 Abengoa Solar S.A. Total Company Sales 2013-2017
7.2. BrightSource Energy Inc.
7.2.1 BrightSource Energy Inc. Concentrated Solar Power Selected Recent Contracts / Projects / Programmes 2018
7.3. eSolarInc
7.3.1 eSolar Inc. Concentrated Solar Power Selected Recent Contracts / Projects / Programmes 2018
7.4. Acciona S.A.
7.4.1 Acciona S.A. Concentrated Solar Power Selected Recent Contracts / Projects / Programmes 2018
7.4.2 Acciona S.A. Total Company Sales 2013-2017
7.5. SolarReserve LLC
7.5.1 SolarReserve LLC Concentrated Solar Power Selected Recent Contracts / Projects / Programmes 2018
7.6. SCHOTT Solar AG
7.7. TSK Flagsol Engineering GmbH
7.7.1 TSKFlagsol Engineering GmbH Concentrated Solar Power Selected Recent Contracts / Projects / Programmes 2018
7.7.2 TSK Flagsol Engineering GmbH Total Company Sales 2013-2017
7.8. GDF SUEZ/Engie
7.8.1 GDF SUEZ/Engie Concentrated Solar Power Selected Recent Contracts / Projects / Programmes 2016
7.8.2 GDF SUEZ/Engie Total Company Sales 2013-2017
7.9. Nextera Energy, Inc.
7.9.1 NextEra Energy Resources LLC Concentrated Solar Power Selected Recent Contracts / Projects / Programmes 2018
7.9.2 NextEra Energy Resources LLC Total Company Sales 2013-2017
7.10. ACS GROUP
7.10.1 ACS Group Total Company Sales 2013-2017
7.11. FCC Recycling (UK) Ltd
7.12. ACWA Power
7.12.1 ACWA Power Concentrated Solar Power Selected Recent Contracts / Projects / Programmes 2018
7.13. Lointek
7.13.1 LOINTEK Total Company Sales 2013-2017
8. Conclusions and Recommendations
8.1. Key Findings
8.2. Recommendations
9. Glossary
List of Tables
Table 3.1 Global Concentrated Solar Power Market Forecast 2019-2029 (US$mn, AGR %, CAGR %, Cumulative)
Table 3.2 Concentrated Solar Power Market Drivers & Restraints
Table 4.1 Global Concentrated Solar Power By Technology Forecast 2019-2029 (US$mn, AGR %, Cumulative)
Table 4.2 Global Concentrated Solar Power By Technology CAGR Forecast 2019-2024, 2024-2029, 2019-2029 (CAGR %)
Table 4.3 Global Concentrated Solar Power Parabolic Trough Technology Submarket by Country Market Forecast 2019-2029 (US$mn, AGR %, CAGR %, Cumulative)
Table 4.4 Global Concentrated Solar Power Market by Parabolic Trough Technology By Country Market CAGR Forecast 2019-2024, 2024-2029, 2019-2029 (CAGR %)
Table 4.5 Global Concentrated Solar Power Linear Fresnel Reflector Technology Submarket by Country Market Forecast 2019-2029 (US$mn, AGR %, CAGR %, Cumulative)
Table 4.6 Global Concentrated Solar Power Market By Linear Fresnel Reflector Technology By Country Market CAGR Forecast 2019-2024, 2024-2029, 2019-2029 (CAGR %)
Table 4.7 Global Concentrated Solar Power Power Tower Technology Submarket by Country Market Forecast 2019-2029 (US$mn, AGR %, CAGR %, Cumulative)
Table 4.8 Global Concentrated Solar Power Market by Power Tower Technology By Country Market CAGR Forecast 2019-2024, 2024-2029, 2019-2029 (CAGR %)
Table 4.9 Global Concentrated Solar Power Solar Dish Technology Submarket by Country Market Forecast 2019-2029 (US$mn, AGR %, CAGR %, Cumulative)
Table 4.10 Global Concentrated Solar Power Market by Solar Dish Technology By Country Market CAGR Forecast 2019-2024, 2024-2029, 2019-2029 (CAGR %)
Table 5.1 Leading National Concentrated Solar Power Market Forecast 2019-2029 (US$mn, AGR %, CAGR %, Cumulative)
Table 5.2U.S. Concentrated Solar Power Market by Technology Forecast 2019-2029 (US$mn, AGR %, CAGR %, Cumulative)
Table 5.3 U.S. Concentrated Solar Power Projects, Project Name, Subcontractor, Technology, Capacity (MW), Status
Table 5.4 Drivers and Restraints in the US Concentrated Solar Power Market
Table 5.5 Spain Concentrated Solar Power Market by Technology Forecast 2019-2029 (US$mn, AGR %, CAGR %, Cumulative)
Table 5.6 Spain Concentrated Solar Power Projects, Project Name, Subcontractor, Technology, Capacity (MW), Status
Table 5.7 Drivers and Restraints in Spain Concentrated Solar Power Market
Table 5.8 Australia Concentrated Solar Power Market by Technology Forecast 2019-2029 (US$mn, AGR %, CAGR %, Cumulative)
Table 5.9 Australia Concentrated Solar Power Projects, Project Name, Subcontractor, Technology, Capacity (MW), Status
Table 5.10 Drivers and Restraints in Australia Concentrated Solar Power Market
Table 5.11 China Concentrated Solar Power Market by Technology Forecast 2019-2029 (US$mn, AGR %, CAGR %, Cumulative)
Table 5.12 China Concentrated Solar Power Projects, Project Name, Subcontractor, Technology, Capacity (MW), Status
Table 5.13 Drivers and Restraints in China Concentrated Solar Power Market
Table 5.14 India Concentrated Solar Power Market by Technology Forecast 2019-2029 (US$mn, AGR %, CAGR %, Cumulative)
Table 5.15 India Concentrated Solar Power Projects, Project Name, Subcontractor, Technology, Capacity (MW), Status
Table 5.16 Drivers and Restraints in India Concentrated Solar Power Market
Table 5.17 Morocco Concentrated Solar Power Market by Technology Forecast 2019-2029 (US$mn, AGR %, CAGR %, Cumulative)
Table 5.18 Morocco Concentrated Solar Power Projects, Project Name, Subcontractor, Technology, Capacity (MW), Status
Table 5.19 Drivers and Restraints in Morocco Concentrated Solar Power Market
Table 5.20 South Africa Concentrated Solar Power Market by Technology Forecast 2019-2029 (US$mn, AGR %, CAGR %, Cumulative)
Table 5.21 South Africa Concentrated Solar Power Projects, Project Name, Subcontractor, Technology, Capacity (MW), Status
Table 5.22 Drivers and Restraints in South Africa Concentrated Solar Power Market
Table 5.23 UAE Concentrated Solar Power Market by Technology Forecast 2019-2029 (US$mn, AGR %, CAGR %, Cumulative)
Table 5.24 Drivers and Restraints in UAE Concentrated Solar Power Market
Table 5.25 Algeria Concentrated Solar Power Market by Technology Forecast 2019-2029 (US$mn, AGR %, CAGR %, Cumulative)
Table 5.26 Egypt Concentrated Solar Power Market by Technology Forecast 2019-2029 (US$mn, AGR %, CAGR %, Cumulative)
Table 5.27 Iran Concentrated Solar Power Market by Technology Forecast 2019-2029 (US$mn, AGR %, CAGR %, Cumulative)
Table 5.28 Oman Concentrated Solar Power Market by Technology Forecast 2019-2029 (US$mn, AGR %, CAGR %, Cumulative)
Table 5.29 Italy Concentrated Solar Power Market by Technology Forecast 2019-2029 (US$mn, AGR %, CAGR %, Cumulative)
Table 5.30 Israel Concentrated Solar Power Market by Technology Forecast 2019-2029 (US$mn, AGR %, CAGR %, Cumulative)
Table 5.31 Thailand Concentrated Solar Power Market by Technology Forecast 2019-2029 (US$mn, AGR %, CAGR %, Cumulative)
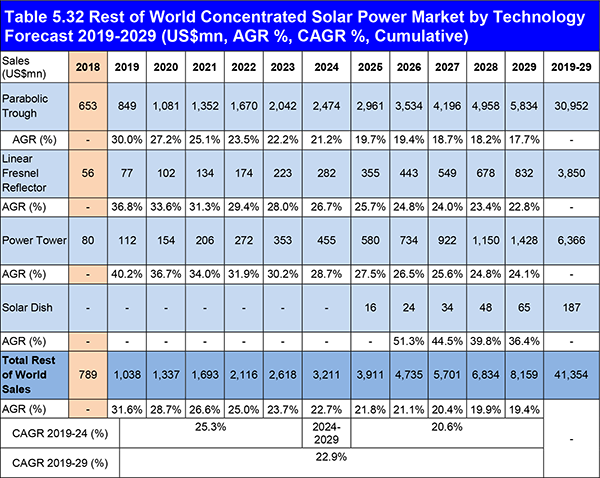
Table 5.32 Rest of World Concentrated Solar Power Market by Technology Forecast 2019-2029 (US$mn, AGR %, CAGR %, Cumulative)
Table 5.33 Drivers and Restraints in Rest of World Concentrated Solar Power Market
Table 6.1 Global Concentrated Solar Power Market SWOT Analysis 2019-2029
Table 7.1 Abengoa Solar S.A. Profile 2018 (CEO, Total Company Sales US$m, Net Income / Loss US$m, Net Capital Expenditure US$m, Strongest Business Region, Business Segment in the Market, HQ, Founded, No. of Employees, IR Contact, Ticker, Website)
Table 7.2 Selected Recent Abengoa Solar S.A. Concentrated Solar Power Contracts / Projects / Programmes 2017 (Projects, Country, Technology, Status and Capacity (MW))
Table 7.3 Abengoa Solar S.A. Total Company Sales 2013-2017 (US$m, AGR %)
Table 7.4 BrightSource Energy Inc. 2018 (CEO, Business Segment in the Market, HQ, Founded, Website)
Table 7.5 Selected Recent BrightSource Energy Inc. Concentrated Solar Power Contracts / Projects / Programmes 2018(Projects, Country, Subcontractor, Technology, Status and Capacity (MW))
Table 7.6 eSolar Inc. 2018 (CEO, HQ, Founded, Website)
Table 7.7 Selected Recent eSolar Inc. Concentrated Solar Power Contracts / Projects / Programmes 2018(Projects, Country, Subcontractor, Technology, Status, Capacity (MW))
Table 7.8 Acciona S.A. 2018 (CEO, Total Company Sales US$m, Net Income / Loss US$m, Net Capital Expenditure US$m, Business Segment in the Market, HQ, Founded, No. of Employees, IR Contact, Ticker, Website)
Table 7.9 Selected Recent Acciona S.A. Concentrated Solar Power Contracts / Projects / Programmes 2018 (Projects, Country, Subcontractor, Technology, Status, Capacity (MW))
Table 7.10 Acciona S.A. Total Company Sales 2013-2017 (US$m, AGR %)
Table 7.11 SolarReserve LLC (CEO, Business Segment in the Market, HQ, Founded, Website)
Table 7.12 Selected Recent SolarReserve LLC Concentrated Solar Power Contracts / Projects / Programmes 2018 (Projects, Country, Subcontractor, Technology, Status, Capacity (MW))
Table 7.13 SCHOTT Solar AG (CEO, Strongest Business Region, HQ, Founded, Website)
Table 7.14 TSK Flagsol Engineering GmbH (CEO, Total Company Sales US$m, Sales, Strongest Business Region, Business Segment in the Market, HQ, Founded, No. of Employees, IR Contact, Ticker, Website)
Table 7.15 Selected Recent TSK Flagsol Engineering GmbH Concentrated Solar Power Contracts / Projects / Programmes 2018 (Products, Country, Subcontractor, Technology, Status, Capacity (MW))
Table 7.16 TSK Flagsol Engineering GmbH Total Company Sales 2013-2017 (US$m, AGR %)
Table 7.17 GDF Suez/Engie(CEO, Total Company Sales US$m, Net Income / Loss US$m, Net Capital Expenditure US$m, Strongest Business Region, Business Segment in the Market, HQ, Founded, No. of Employees, IR Contact, Ticker, Website)
Table 7.18 Selected Recent GDF SUEZ/Engie Concentrated solar power Contracts / Projects / Programmes 2016 (Projects, Country, Subcontractor, Technology, Status, Capacity (MW))
Table 7.19 GDF Suez/Engie Total Company Sales 2013-2017 (US$m, AGR %)
Table 7.20 Nextera Energy, Inc.(CEO, Total Company Sales US$m, Net Income / Loss US$m, Strongest Business Region, Business Segment in the Market, HQ, Founded, No. of Employees, IR Contact, Ticker, Website)
Table 7.21 Selected Recent NextEra Energy Resources LLC Concentrated Solar Power Contracts / Projects / Programmes 2018 (Projects, Country, Subcontractor, Technology, Status, Capacity (MW))
Table 7.22 Nextera Energy, Inc. Total Company Sales 2013-2017 (US$m, AGR %)
Table 7.23 ACS Group2017 (CEO, Total Company Sales US$m, Business Segment in the Market, HQ, Founded, No. of Employees, IR Contact, Ticker, Website)
Table 7.24 ACS Group Total Company Sales 2013-2017 (US$m, AGR %)
Table 7.25 FCC Recycling Ltd. 2017 (CEO, Total Company Sales US$m, Business segment in the market, HQ, Founded, No. of Employees, IR Contact, Ticker, Website)
Table 7.26 ACWA Power Profile 2017 (CEO, Total Company Sales US$m, Sales in the Market US$m, Share of Company Sales from Concentrated Solar Power Market %, Net Income / Loss US$m, Net Capital Expenditure US$m, Strongest Business Region, Business Segment in the Market, HQ, Founded, No. of Employees, IR Contact, Ticker, Website)
Table 7.27 Selected Recent ACWA Power Concentrated Solar Power Contracts / Projects / Programmes 2017 (Projects, Country, Subcontractor, Technology, Status and Capacity (MW))
Table 7.28 ACWA Power Total Company Sales 2013-2017 (US$m, AGR %)
Table 7.29 Lointek Profile 2017 (CEO, Total Company Sales US$m, Sales in the Market US$m, Share of Company Sales from Concentrated Solar Power Market %, Net Income / Loss US$m, Net Capital Expenditure US$m, Strongest Business Region, Business Segment in the Market, HQ, Founded, No. of Employees, IR Contact, Ticker, Website)
Table 8.1 Global Concentrated Solar Power by Country Market Forecast 2019-2029 (US$mn, AGR %, CAGR %, Cumulative)
Table 8.2 Global Concentrated Solar Power By Technology Forecast 2019-2029 (US$mn, AGR %, Cumulative)
List of Figures
Figure 2.1 Global Concentrated Solar Power Market Segmentation Overview
Figure 2.2 Global Solar Power Market in 2018 (US$Bn))
Figure 3.1 Global Concentrated Solar Power Market Forecast 2019-2029 (US$mn, AGR %)
Figure 4.1 Global Concentrated Solar Power By Technology AGR Forecast 2019-2029 (AGR %)
Figure 4.2 Global Concentrated Solar Power By Technology Share Forecast 2019 (% Share)
Figure 4.3 Global Concentrated Solar Power By Technology Share Forecast 2024 (% Share)
Figure 4.4 Global Concentrated Solar Power By Technology Range Share Forecast 2029 (% Share)
Figure 4.5 Global Concentrated Solar Power Parabolic Trough Technology by Country Market 2019-2029 (US$mn, Global AGR %)
Figure 4.6 Global Concentrated Solar Power Parabolic Trough Technology By Country Market Forecast 2019 (% Share)
Figure 4.7 Global Concentrated Solar Power Parabolic Trough Technology By Country Market Forecast 2024 (% Share)
Figure 4.8 Global Concentrated Solar Power Parabolic Trough Technology By Country Market Forecast 2029 (% Share)
Figure 4.9 Global Concentrated Solar Power Linear Fresnel Reflector By Country Market 2019-2029 (US$mn, Global AGR %)
Figure 4.10 Global Concentrated Solar Power Linear Fresnel Reflector Technology By Country Market Forecast 2019 (% Share)
Figure 4.11 Global Concentrated Solar Power Linear Fresnel Reflector Technology By Country Market Forecast 2024 (% Share)
Figure 4.12 Global Concentrated Solar Power Linear Fresnel Reflector Technology By Country Market Forecast 2029 (% Share)
Figure 4.13 Global Concentrated Solar Power Power Tower By Country Market 2019-2029 (US$mn, Global AGR %)
Figure 4.14 Global Concentrated Solar Power Power Tower Technology By Country Market Forecast 2019 (% Share)
Figure 4.15 Global Concentrated Solar Power Power Tower Technology By Country Market Forecast 2024 (% Share)
Figure 4.16 Global Concentrated Solar Power Power Tower Technology By Country Market Forecast 2029 (% Share)
Figure 4.17 Global Concentrated Solar Power Solar Dish By Country Market 2019-2029 (US$Mn, Global AGR %)
Figure 4.18 Global Concentrated Solar Power Solar Dish Technology By Country Market Forecast 2019 (% Share)
Figure 4.19 Global Concentrated Solar Power Solar Dish Technology By Country Market Forecast 2024 (% Share)
Figure 4.20 Global Concentrated Solar Power Solar Dish Technology By Country Market Forecast 2029 (% Share)
Figure 5.1 Leading National Concentrated Solar Power Market Forecast 2019-2029 (US$mn, AGR%)
Figure 5.2 Leading National Concentrated Solar Power Market Forecast 2019 (%)
Figure 5.3 Leading National Concentrated Solar Power Market Forecast 2024 (%)
Figure 5.4 Leading National Concentrated Solar Power Market Forecast 2029 (%)
Figure 5.5 Leading National Concentrated Solar Power Market Forecast 2019-2029 (US$mn)
Figure 5.6 Leading National Concentrated Solar Power Market Cumulative Total Sales 2019-2029 (US$mn)
Figure 5.7 U.S. Concentrated Solar Power Market Forecast by Technology 2019-2029 (US$mn, AGR%)
Figure 5.8 U.S. Concentrated Solar Power Market Share by Technology Forecast 2019, 2024, 2029 (% Share)
Figure 5.9 Spain Concentrated Solar Power Market by Technology Forecast 2017-2027 (US$mn, AGR%)
Figure 5.10 Spain Concentrated Solar Power Market Share by Technology Forecast 2019, 2024, 2029 (% Share)
Figure 5.11 Australia Concentrated Solar Power Market by Technology Forecast 2019-2029 (US$mn, AGR%)
Figure 5.12 Australia Concentrated Solar Power Market by Technology Share Forecast 2019, 2024, 2029 (% Share)
Figure 5.13 China Concentrated Solar Power Market by Technology Forecast 2019-2029 (US$mn, AGR%)
Figure 5.14 China Concentrated Solar Power Market Share by Technology Forecast 2019, 2024, 2029 (% Share)
Figure 5.15 India Concentrated Solar Power Market by Technology Forecast 2019-2029 (US$mn, AGR%)
Figure 5.16 India Concentrated Solar Power Market Share by Technology Forecast 2019, 2024, 2029 (% Share)
Figure 5.17 Morocco Concentrated Solar Power Market by Technology Forecast 2019-2029 (US$mn, AGR%)
Figure 5.18 Morocco Concentrated Solar Power Market Share by Technology Forecast 2019, 2024, 2029 (% Share)
Figure 5.19 South Africa Concentrated Solar Power Market Technology Forecast 2019-2029 (US$mn, AGR%)
Figure 5.20 South Africa Concentrated Solar Power Market Share by Technology Forecast 2019, 2024, 2029 (% Share)
Figure 5.21 UAE Concentrated Solar Power Market by Technology Forecast 2019-2029 (US$mn, AGR%)
Figure 5.23 UAE Concentrated Solar Power Market Share by Technology Forecast 2019, 2024, 2029 (% Share)
Figure 5.24 Algeria Concentrated Solar Power Market by Technology Forecast 2019-2029 (US$mn, AGR%)
Figure 5.26 Algeria Concentrated Solar Power Market Share by Technology Forecast 2019, 2024, 2029 (% Share)
Figure 5.25 Egypt Concentrated Solar Power Market by Technology Forecast 2019-2029 (US$mn, AGR%)
Figure 5.26 Egypt Concentrated Solar Power Market Share by Technology Forecast 2019, 2024, 2029 (% Share)
Figure 5.27 Iran Concentrated Solar Power Market by Technology Forecast 2019-2029 (US$mn, AGR%)
Figure 5.28 Iran Concentrated Solar Power Market Share by Technology Forecast 2019, 2024, 2029 (% Share)
Figure 5.29 Oman Concentrated Solar Power Market by Technology Forecast 2019-2029 (US$mn, AGR%)
Figure 5.30 Oman Concentrated Solar Power Market Share by Technology Forecast 2019, 2024, 2029 (% Share)
Figure 5.31 Italy Concentrated Solar Power Market by Technology Forecast 2019-2029 (US$mn, AGR%)
Figure 5.32 Italy Concentrated Solar Power Market Share by Technology Forecast 2019, 2024, 2029 (% Share)
Figure 5.33 Israel Concentrated Solar Power Market by Technology Forecast 2019-2029 (US$mn, AGR%)
Figure 5.34 Israel Concentrated Solar Power Market Share by Technology Forecast 2019, 2024, 2029 (% Share)
Figure 5.35 Thailand Concentrated Solar Power Market by Technology Forecast 2019-2029 (US$mn, AGR%)
Figure 5.36 Thailand Concentrated Solar Power Market Share by Technology Forecast 2019, 2024, 2029 (% Share)
Figure 5.37 Rest of World Concentrated Solar Power Market by Technology Forecast 2019-2029 (US$mn, AGR%)
Figure 5.38 Rest of World Concentrated Solar Power Market Share by Technology Forecast 2019, 2024, 2029 (% Share)
Figure 7.1 Abengoa Solar S.A. Total Company Sales 2013-2017 (US$m, AGR %)
Figure 7.2 Acciona S.A. Total Company Sales 2013-2017 (US$m, AGR %)
Figure 7.3 TSK Flagsol Engineering GmbH Total Company Sales 2013-2017 (US$m, AGR %)
Figure 7.4 GDF Suez/Engie Company Sales 2013-2017 (US$m, AGR %)
Figure 7.5 NextEra Energy Resources LLC Company Sales 2013-2017 (US$m, AGR %)
Figure 7.6 ACS Group Total Company Sales 2013-2017 (US$m, AGR %)
Figure 7.7 ACWA Power Total Company Sales 2013-2017 (US$m, AGR %)
Figure 7.8 LOINTEK Total Company Sales 2013-2017 (US$m, AGR %)
Abengoa Solar S.A
Abhijeet Projects Ltd.
Acciona Energia
Acciona S.A.
AccionaEnergia
ACS Group
ACWA
African Development Bank (AfDB)
Alstom
AREVA Solar
Aries
Asian Development Bank (ADB)
Aurum Renewable Energy
BrightSource Energy LLC
Broad-Based Black Economic Empowerment (BBBEE).
Carbon Reduction Ventures
Cargo Power & Infrastructure
Chevron Technology
China Datang Corporation
China Datang Group
China Guangdong Nuclear Power Group
China Huaneng Group
China Power Investments Corporation
Climate Investment Funds (CIF)
Corporate Ispat Alloys Ltd
Lanco Infratech
Cimar
CNIM
CS Energy
Engie
Entegra Limited
eSolar, Inc
European Development Bank
Export-Import Bank of China
FCC Recycling (UK)
Ferrostaal
French Development Bank
GDF Suez
General Electric
Grupo Ortiz
Hanas New Energy Group
Himin Solar
Huludao Ruixinda Industry Co.,
Hyspan.
Iberdrola
Ilangalethu Solar Power
Industrial Development Corporation
Infrastructure Private Limited.
Italcementi Group
KaXu Community Trust
KfW Bankengruppe
KVK Energy
Lanco Solar Energy
Magtel
Megha Engineering & Infrastructure
Mitsubishi Corporation
NextEra Energy Resources, LLC
NOY Infrastructure & Energy Investment Fund
NP Power,
PG&E.
Pratt & Whitney Rocketdyne
Public Investment Corporation
RATCH Australia Corporation Limited
Rhein E
Rio Glass
RWE
SCHOTT Solar AG
SENER
Shanghai Electric
Shriram EPC Ltd
Siemens
SkyFuel
Solafrica
Solar Energy Generating Station (SEGS)
Solar Millenium
Solar Power Group
SolarReserve
Solastor
Solutia
Southern California Edison (SCE)
Sustainable Power Partners
SWM
TaiQing
Tianwei New Energy Holding
TSK Flagsol Engineering GmbH
TSK Group
Tucson Electric Power
Wizard Power
World Bank Clean Technology Fund
World Bank Group
Zhejiang SUPCON Solar Energy Technology
Organisations mentioned
Arizona Corporation Commission
Assets Supervision & Administration Commission (SASAC
Australian Renewable Energy Agency (ARENA)
Australian National University.
Dubai Electricity and Water Authority (DEWA)
Moroccan Solar Energy Agency (MASEN).
National Energy Administration
National Office of Electricity and Drinking Water (ONE).
National Renewable Energy Lab (NREL)
U.S. Energy Information Administration (EIA)
US Department of Energy
US-China Economic and Cultural Development Alliance (US-China ECDA)
South Africa Department of Energy

