Industries > Energy > Global Energy Infrastructure Resilience Market Forecast 2020-2030
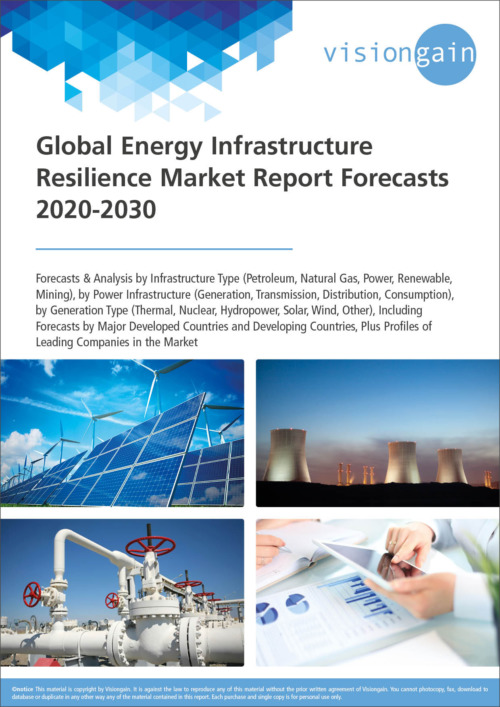
Global Energy Infrastructure Resilience Market Forecast 2020-2030
Forecasts & Analysis by Infrastructure Type (Petroleum, Natural Gas, Power, Renewable, Mining), by Power Infrastructure (Generation, Transmission, Distribution, Consumption), by Generation Type (Thermal, Nuclear, Hydropower, Solar, Wind, Other), Including Forecasts by Major Developed Countries and Developing Countries, Plus Profiles of Leading Companies in the Market
Are you aware that global energy infrastructure resilience market spending reached $8,901.8 million in 2019?
Read on to explore how you can maximise your gains from this dynamic sector.
The report discusses:
• What are the key drivers and restraints for each regional market during the 2020-2030 and how these will shape the Energy Infrastructure Resilience market.
• How will each submarket grow in the Energy Infrastructure Resilience Market, what type of power infrastructure is going to receive the largest share of investment and what type of generation is dominant in the 2020-2030 period.
• The leading players of the Energy Infrastructure resilience market and what are their prospects over the forecast period
• What will you learn from this energy infrastructure resilience report?
You will discover the Energy Infrastructure resilience global and regional outlook over a 10-year horizon including:
• US
• Canada
• UK
• Germany
• France
• Italy
• Spain
• China
• Japan
• Australia
• Saudi Arabia
• South Korea
• Brazil
• Russia
• India
• Mexico
• Indonesia
• Malaysia
• South Africa
• Iran
• Iraq
• Understand the energy infrastructure resilience competitive landscape
View a succinct analysis of the Energy Infrastructure Resilience industry outlook with an examination and analysis of some of the top companies operating within the Energy Infrastructure Resilience market space, including:
• NRG Energy
• Centrica Plc.
• Siemens AG
• EDF Group
• AECOM
• TetraTech Inc.
• BLUWAVE AI
• Black & Veatch Holding Company
• ICF International
• ARUP Group Limited
• Guidehouse
• See detailed energy infrastructure resilience submarket forecasts & analysis 2020-2030
• By Infrastructure Type
• By Power Infrastructure
• By Generation Type
• Read forward looking energy infrastructure resilience market analysis
Visiongain is an independent business intelligence consultancy with years of Electricity and Power Generation Infrastructure industry experience.
• Get instant energy infrastructure resilience market insight
Find 216 tables & figures over 329 pages, illustrating the Energy Infrastructure resilience market outlook
Buy our report today Global Energy Infrastructure Resilience Market Report Forecasts 2020-2030: Forecasts & Analysis by Infrastructure Type (Petroleum, Natural Gas, Power, Renewable, Mining), by Power Infrastructure (Generation, Transmission, Distribution, Consumption), by Generation Type (Thermal, Nuclear, Hydropower, Solar, Wind, Other), Including Forecasts by Major Developed Countries and Developing Countries, Plus Profiles of Leading Companies in the Market. Avoid missing out by staying informed – order our report now.
Visiongain is a trading partner with the US Federal Government
CCR Ref number: KD4R6
Do you have any custom requirements we can help you with? Any need for specific country, geo region, market segment or specific company information? Contact us today, we can discuss your needs and see how we can help: sara.peerun@visiongain.com
1.Report Overview
1.1 Global Energy Infrastructure Resilience Market Overview
1.2 What Are the Climate Risks We Face?
1.2.1 Climate Change and Demand for Electricity
1.3 Global Energy Infrastructure Resilience Market Segmentation
1.4 Market Definition
1.4.1 What Is Climate-Resilient Infrastructure
1.5 How This Report Delivers
1.6 Key Questions Answered by This Analytical Report Include:
1.7 Why You Should Read This Report?
1.8 Who is This Report for?
1.9 Methodology
1.10 Frequently Asked Questions (FAQ)
1.11 Associated Visiongain Reports
1.12 About Visiongain
2. Introduction to Energy Infrastructure Resilience
2.1 Infrastructure Disruptions Due to Climate Change Cause Economic Losses to the Nation
2.2 Resilience of Infrastructure Assets
2.3 Resilience of Infrastructure Users
2.4 How Much Would It Cost To Implement Resilient Technologies And Solutions
2.5 What Are the Returns On Investments for Making Exposed Infrastructure More Resilient to Natural Disasters?
2.6 From Resilient Infrastructure Assets to Resilient Infrastructure Services
2.7 From Resilient Infrastructure Services to Resilient Users And Economies
3. Climate Change Impact on Global Energy Sector
3.1 Temperature, Energy Demand, and Energy Supply
3.2 Water Availability and Energy
3.3 Sea Level Rise, Storm Surge, and Extreme Events
3.4 Wind Speed, Cloud Cover, and Renewable Energy
3.5 The Intergovernmental Panel on Climate Change (IPCC)
4. Importance of Resilience in Global Energy Sector
4.1 Valuing Resilience in Electricity Systems
4.1.1 Reliability versus Resilience
4.1.2 Value of Lost Load (VoLL)
4.1.3 Valuing Resilience
4.2 Monetizing Resilience
4.3 Levels of Rigor in Resilience Analysis
5. Global Energy Infrastructure Resilience Market: What are the Factors Affecting Global Market?
5.1 Resilience Is Central to Achieving Many International Objectives
5.2 More Resilient Infrastructure Assets Are Cost-Effective
5.3 The Additional Up-Front Cost of More Resilient Assets Depends On the Asset and The Hazard
5.4 The Additional Up-Front Cost of More Resilient Assets Could Be Offset by Lower Maintenance and Repair Costs
5.5 Improving Maintenance and Operations Is an Option for Boosting Resilience and Reducing Costs
5.6 How Would Those Costs Increase to Make Power Systems More Resilient?
5.7 From Resilient Assets to Resilient Infrastructure Services
5.8 Diversifying Assets To Increase Network Resilience
5.9 Decentralizing And Using New Technologies
5.10 Working Across Systems To Capture Synergies
5.11 Protecting Infrastructure Systems with Dikes in Dense Areas
5.12 Combining Infrastructure with Nature-Based Solutions to Reduce Investment Needs
5.13 Opportunities in the Global Market
5.13.1 Funding opportunities
5.13.2 Opportunities to Enhance Climate Adaptation Practice
6. Financial Aspects of Energy Sector Resilience
6.1 Green Banks
6.1.1 Public International Climate and Environmental Funds
6.1.2 Multilateral Development Banks and Bilateral Development Assistance
6.2 Resilience Finance
6.2.1 Internal Organizational Budgets
6.2.2 Public-Private Partnerships
6.2.3 Insurance
6.2.4 Catastrophe and Resilience Bonds
6.2.5 Bond Financing and Green Bonds
6.2.6 Green Bonds
6.2.7 Insurance-linked Loan Packages
6.2.8 Resilience Impact Bond
6.2.9 Resilience Bond
6.2.10 Resilience Service Company
7. Energy Resilience Infrastructure Market in Developed Countries
7.1 U.S. Energy Profile
7.1.1 Energy Sector Overview
7.1.2 U.S. Climate Change Risk to Energy Infrastructure
7.1.3 U.S. Energy Infrastructure Resilience Market
7.2 Canada Energy Profile
7.2.1 Canada Energy Sector Overview
7.2.3 Canada Climate Change Risk to Energy Infrastructure
7.2.4 Canada Energy Infrastructure Resilience Market
7.3 U.K. Energy Profile
7.3.1 U.K. Energy Sector Overview
7.3.2 U.K. Climate Change Risk to Energy Infrastructure
7.3.3 U.K. Energy Infrastructure Resilience Market
7.4 Germany Energy Profile
7.4.1 Energy Sector Overview
7.4.2 Germany Climate Change Risk to Energy Infrastructure
7.4.3 Germany Energy Infrastructure Resilience Market
7.5 France Energy Profile
7.5.1 Energy Sector Overview
7.5.2 France Climate Change Risk to Energy Infrastructure
7.5.3 France Energy Infrastructure Resilience Market
7.6 Italy Energy Profile
7.6.1 Energy Sector Overview
7.6.2 Italy Climate Change Risk to Energy Infrastructure
7.6.3 Italy Energy Infrastructure Resilience Market
7.7 Spain Energy Profile
7.7.1 Energy Sector Overview
7.7.2 Spain Climate Change Risk to Energy Infrastructure
7.7.3 Spain Energy Infrastructure Resilience Market
7.8 China Energy Profile
7.8.1 Energy Sector Overview
7.8.2 China Climate Change Risk to Energy Infrastructure
7.8.3 China Energy Infrastructure Resilience Market
7.9 Japan Energy Profile
7.9.1 Energy Sector Overview
7.9.2 Japan Climate Change Risk to Energy Infrastructure
7.9.3 Japan Energy Infrastructure Resilience Market
7.10 Australia Energy Profile
7.10.1 Energy Sector Overview
7.10.2 Australia Climate Change Risk to Energy Infrastructure
7.10.3 Australia Energy Infrastructure Resilience Market
7.11 Saudi Arabia Energy Profile
7.11.1 Energy Sector Overview
7.11.2 Saudi Arabia Climate Change Risk to Energy Infrastructure
7.11.3 Saudi Arabia Energy Infrastructure Resilience Market
7.12 South Korea Energy Profile
7.12.1 Energy Sector Overview
7.12.2 South Korea Climate Change Risk to Energy Infrastructure
7.12.3 South Korea Energy Infrastructure Resilience Market
7.13 Brazil Energy Profile
7.13.1 Brazil Energy Sector Overview
7.13.2 Brazil Climate Change Risk to Energy Infrastructure
7.13.3 Brazil Energy Infrastructure Resilience Market
7.14 Russia Energy Profile
7.14.1 Russia Energy Sector Overview
7.14.2 Russia Climate Change Risk to Energy Infrastructure
7.14.3 Russia Energy Infrastructure Resilience Market
8. Energy Resilience Infrastructure Market in Developing Countries
8.1 India Energy Profile
8.1.1 India Energy Sector Overview
8.1.2 Investment Scenario
8.1.3 Government Initiatives
8.1.4 India Climate Change Risk to Energy Infrastructure
8.1.5 India Energy Infrastructure Resilience Market
8.2 Mexico Energy Profile
8.2.1 Energy Sector Overview
8.2.2 Mexico Climate Change Risk to Energy Infrastructure
8.2.3 Mexico Energy Infrastructure Resilience Market
8.3 Indonesia Energy Profile
8.3.1 Energy Sector Overview
8.3.2 Indonesia Climate Change Risk to Energy Infrastructure
8.3.3 Indonesia Energy Infrastructure Resilience Market
8.4 Malaysia Energy Profile
8.4.1 Malaysia Energy Sector Overview
8.4.2 Malaysia Climate Change Risk to Energy Infrastructure
8.4.3 Malaysia Energy Infrastructure Resilience Market
8.5 South Africa Energy Profile
8.5.1 Energy Sector Overview
8.5.2 South Africa Climate Change Risk to Energy Infrastructure
8.5.3 South Africa Energy Infrastructure Resilience Market
8.6 Iran Energy Profile
8.6.1 Iran Energy Sector Overview
8.6.2 Iran Climate Change Risk to Energy Infrastructure
8.6.3 Iran Energy Infrastructure Resilience Market
8.7 Iraq Energy Profile
8.7.1 Iraq Energy Sector Overview
8.7.2 Iraq Climate Change Risk to Energy Infrastructure
8.7.3 Iraq Energy Infrastructure Resilience Market
9. Climate-Resilience of Power Plants
9.1 How to Improve Climate-Resilience of Power Plants?
9.1.1 Anticipate
9.1.2 Plan
9.1.3 Inform
9.1.4 Respond
9.1.5 Recover
9.1.6 Longer-Term Adaptation
9.1.7 Adaptation: Renewable generation
10. Projects Integrating Climate-Resilience
10.1 Selected Infrastructure Projects Integrating Climate-Resilience In OECD And G20 Countries
10.1.1 Eyre Peninsula (Australia)
10.1.2 Japanese Railways (JR) (Japan)
10.1.3 Sponge City (Hong Kong, China)
10.1.4 Hurricane Sandy Rebuilding Strategy (USA)
10.2 Modelling The Macro-Economic Impacts Of A Major Flood In Paris
10.3 Stakeholder Engagement for Climate-Resilient Infrastructure
10.3.1 Northwest Territories, Canada
10.3.2 Indore, India
10.3.3 Semarang, Indonesia
10.4 Initiatives for Communicating Climate Risks And Supporting Decision‑Making
10.4.1 Argentina’s Climate Risks Map System (SIMARCC)
10.4.2 Brazil’s AdaptaClima Platform
10.4.3 Copernicus Climate Data Store
10.4.4 European Climate-Adapt Platform
10.4.5 United States Climate Change Adaptation Resource Center (ARC-X)
10.5 Promoting Ecosystem-Based Adaptation In South Africa
10.5.1 Copenhagen: Working With Ecosystems To Cost-Effectively Build Resilience
10.6 Examples of Infrastructure Pathways
10.6.1 Delta Programme (Netherlands)
10.6.2 Colorado River Basin (United States)
10.6.3 National Infrastructure Commission (United Kingdom)
10.7 Integrating Climate Risks Into Public Infrastructure Planning
10.7.1 Queensland and Tasmania (Australia)
10.7.2 COAG (Australia)
10.7.3 West Coast Infrastructure Exchange (Canada and USA)
10.8 Mobilising Finance for Climate-Resilient Infrastructure
10.8.1 Land Development Taxes (Morocco)
10.8.2 The Reef and Beach Resilience and Insurance (Mexico)
10.8.3 Environmental Impact Bond (US)
11. Company Profiles
11.1 NRG Energy, Inc.
11.1.1 Company Overview
11.1.2 Company Financial Performance
11.1.3 Company Products and Services
11.1.4 Company Recent Developments
11.2 Centrica plc
11.2.1 Company Overview
11.2.2 Centrica Business Solutions
11.2.3 SmartWatt
11.2.4 Company Financial Performance
11.2.5 Company Product and Service Offerings
11.2.6 Company Recent Developments
11.3 Siemens
11.3.1 Company Overview
11.3.2 Siemens Corporation
11.3.3 Company Financial Performance
11.3.4 Company Recent Developments
11.4 The EDF Group
11.4.1 Company Overview
11.4.2 Company Financial Performance
11.4.3 Company Recent Developments
11.5 Black & Veatch Holding Company
11.5.1 Company Overview
11.5.2 Company Recent Developments
11.5.3 Company Projects
11.6 BLUWAVE-AI
11.6.1 Company Overview
11.6.2 Company Product and Services
11.6.3 Company Recent Developments
11.7 Tetra Tech, Inc
11.7.1 Company Overview
11.7.2 Company Financial Performance
11.7.3 Company Recent Developments
11.7.4 Company Projects
11.8 AECOM
11.8.1 Company Overview
11.8.2 Company Operations
11.8.3 Geographic Reach
11.8.4 Sales and Marketing
11.8.5 Company’s Financial Performance
11.8.6 Business Strategy
11.8.7 Company Recent Developments
11.9 ICF International Inc.
11.9.1 Company Overview
11.9.2 Key Competitors in the Market
11.9.3 Company Financial Performance
11.9.4 Company Product & Service Offerings
11.9.5 Company Recent Developments
11.10 Guidehouse
11.10.1 Company Overview
11.10.2 Company Recent Development
11.11 ARUP GROUP LIMITED
11.11.1 Company Overview
11.11.2 Company’s Operations
11.11.3 Company Sales and Marketing
11.11.4 Company Financial Performance
11.11.5 Business Strategy
11.11.6 Company’s Financial Performance
11.11.7 Company Recent Development
11.12 List of Other Companies
11.12.1 Law Firms and Climate Change Practices
11.12.2 Management Consultant for Resilient Infrastructure
11.12.3 Oil & Gas Resilient Infrastructure Consulting Companies
11.12.4 Climate Change Consulting Companies
12. Conclusion and Recommendations
12.1 Conclusion
12.2 Recommendations
12.2.1 Recommendations for Policy Makers
12.2.2 Recommendations for Insurance Industry
12.2.3 Recommendations at the Project Conceptual Stage
13. Glossary
13.1 Organizations to Consider in Exploring Resilience Finance
Associated Visiongain Reports
Visiongain Report Sales Order Form
Appendix A
About Visiongain
Appendix B
Visiongain report evaluation form
List of Tables
Table 1.1 Disrupted Infrastructure Services Have Multiple Impacts on Firms
Table 4.1 Costs Associated With Electric Grid Outages
Table 7.1 U.S. Energy Production & Consumption, 2016-2019
Table 7.2 U.S. Energy Infrastructure Resilience Investment, 2019-2030, (USD Million, AGR%, CAGR %)
Table 7.3 U.S. Power Generation Infrastructure Investment, by Type, 2019-2030, (USD Million, AGR%, CAGR %)
Table 7.4 U.S. Power Resilient Infrastructure Investment, 2019-2030, (USD Million, AGR%, CAGR %)
Table 7.5 Canada Energy Production & Consumption, 2016-2019
Table 7.6 Canada Energy Infrastructure Resilience Investment, 2019-2030, (USD Million, AGR%, CAGR %)
Table 7.7 Canada Power Generation Infrastructure Investment, by Type, 2019-2030, (USD Million, AGR%, CAGR %)
Table 7.8 Canada Power Resilient Infrastructure Investment, 2019-2030, (USD Million, AGR%, CAGR %)
Table 7.9 U.K. Energy Production & Consumption, 2016-2019
Table 7.10 U.K. Energy Infrastructure Resilience Investment, 2019-2030, (USD Million, AGR%, CAGR %)
Table 7.11 U.K. Power Generation Infrastructure Investment, by Type, 2019-2030, (USD Million, AGR%, CAGR %)
Table 7.12 U.K. Power Resilient Infrastructure Investment, 2019-2030, (USD Million, AGR%, CAGR %)
Table 7.13 Germany Energy Production & Consumption, 2016-2019
Table 7.14 Assessment of Climate Impacts in the German Energy Sector
Table 7.15 Germany Energy Infrastructure Resilience Investment, 2019-2030, (USD Million, AGR%, CAGR %)
Table 7.16 Germany Power Generation Infrastructure Investment, by Type, 2019-2030, (USD Million, AGR%, CAGR %)
Table 7.17 Germany Power Resilient Infrastructure Investment, 2019-2030, (USD Million, AGR%, CAGR %)
Table 7.18 France Energy Production & Consumption, 2016-2019
Table 7.19 France Energy Infrastructure Resilience Investment, 2019-2030, (USD Million, AGR%, CAGR %)
Table 7.20 France Power Generation Infrastructure Investment, by Type, 2019-2030, (USD Million, AGR%, CAGR %)
Table 7.21 France Power Resilient Infrastructure Investment, 2019-2030, (USD Million, AGR%, CAGR %)
Table 7.22 Italy Energy Production & Consumption, 2016-2019
Table 7.23 Italy Energy Infrastructure Resilience Investment, 2019-2030, (USD Million, AGR%, CAGR %)
Table 7.24 Italy Power Generation Infrastructure Investment, by Type, 2019-2030, (USD Million, AGR%, CAGR %)
Table 7.25 Italy Power Resilient Infrastructure Investment, 2019-2030, (USD Million, AGR%, CAGR %)
Table 7.26 Spain Energy Production & Consumption, 2016-2019
Table 7.27 Spain Energy Infrastructure Resilience Investment, 2019-2030, (USD Million, AGR%, CAGR %)
Table 7.28 Spain Power Generation Infrastructure Investment, by Type, 2019-2030, (USD Million, AGR%, CAGR %)
Table 7.29 Spain Power Resilient Infrastructure Investment, 2019-2030, (USD Million, AGR%, CAGR %)
Table 7.30 China Energy Production & Consumption, 2016-2019
Table 7.31 China Energy Infrastructure Resilience Investment, 2019-2030, (USD Million, AGR%, CAGR %)
Table 7.32 China Power Generation Infrastructure Investment, by Type, 2019-2030, (USD Million, AGR%, CAGR %)
Table 7.33 China Power Resilient Infrastructure Investment, 2019-2030, (USD Million, AGR%, CAGR %)
Table 7.34 Japan Energy Production & Consumption, 2016-2019
Table 7.35 Japan Energy Infrastructure Resilience Investment, 2019-2030, (USD Million, AGR%, CAGR %)
Table 7.36 Japan Power Generation Infrastructure Investment, by Type, 2019-2030, (USD Million, AGR%, CAGR %)
Table 7.37 Japan Power Resilient Infrastructure Investment, 2019-2030, (USD Million, AGR%, CAGR %)
Table 7.38 Australia Energy Production & Consumption, 2016-2019
Table 7.39 Australia Energy Infrastructure Resilience Investment, 2019-2030, (USD Million, AGR%, CAGR %)
Table 7.40 Australia Power Generation Infrastructure Investment, by Type, 2019-2030, (USD Million, AGR%, CAGR %)
Table 7.41 Australia Power Resilient Infrastructure Investment, 2019-2030, (USD Million, AGR%, CAGR %)
Table 7.42 Saudi Arabia Energy Production & Consumption, 2016-2019
Table 7.43 Saudi Arabia Energy Infrastructure Resilience Investment, 2019-2030, (USD Million, AGR%, CAGR %)
Table 7.44 Saudi Arabia Power Generation Infrastructure Investment, by Type, 2019-2030, (USD Million, AGR%, CAGR %)
Table 7.45 Saudi Arabia Power Resilient Infrastructure Investment, 2019-2030, (USD Million, AGR%, CAGR %)
Table 7.46 South Korea Energy Production & Consumption, 2016-2019
Table 7.47 South Korea Energy Infrastructure Resilience Investment, 2019-2030, (USD Million, AGR%, CAGR %)
Table 7.48 South Korea Power Generation Infrastructure Investment, by Type, 2019-2030, (USD Million, AGR%, CAGR %)
Table 7.49 South Korea Power Resilient Infrastructure Investment, 2019-2030, (USD Million, AGR%, CAGR %)
Table 7.50 Brazil Energy Production & Consumption, 2016-2019
Table 7.51 Brazil Energy Infrastructure Resilience Investment, 2019-2030, (USD Million, AGR%, CAGR %)
Table 7.52 Brazil Power Generation Infrastructure Investment, by Type, 2019-2030, (USD Million, AGR%, CAGR %)
Table 7.53 Brazil Power Resilient Infrastructure Investment, 2019-2030, (USD Million, AGR%, CAGR %)
Table 7.54 Russia Energy Production & Consumption, 2016-2019
Table 7.55 Russia Energy Infrastructure Resilience Investment, 2019-2030, (USD Million, AGR%, CAGR %)
Table 7.56 Russia Power Generation Infrastructure Investment, by Type, 2019-2030, (USD Million, AGR%, CAGR %)
Table 7.57 Russia Power Resilient Infrastructure Investment, 2019-2030, (USD Million, AGR%, CAGR %)
Table 7.58 India Energy Production & Consumption, 2016-2019
Table 8.1 India Energy Infrastructure Resilience Investment, 2019-2030, (USD Million, AGR%, CAGR %)
Table 8.2 India Power Generation Infrastructure Investment, by Type, 2019-2030, (USD Million, AGR%, CAGR %)
Table 8.3 India Power Resilient Infrastructure Investment, 2019-2030, (USD Million, AGR%, CAGR %)
Table 8.4 Mexico Energy Production & Consumption, 2016-2019
Table 8.5 Mexico Energy Infrastructure Resilience Investment, 2019-2030, (USD Million, AGR%, CAGR %)
Table 8.6 Mexico Power Generation Infrastructure Investment, by Type, 2019-2030, (USD Million, AGR%, CAGR %)
Table 8.7 Mexico Power Resilient Infrastructure Investment, 2019-2030, (USD Million, AGR%, CAGR %)
Table 8.8 Indonesia Energy Production & Consumption, 2016-2019
Table 8.9 Indonesia Energy Infrastructure Resilience Investment, 2019-2030, (USD Million, AGR%, CAGR %)
Table 8.10 Indonesia Power Generation Infrastructure Investment, by Type, 2019-2030, (USD Million, AGR%, CAGR %)
Table 8.11 Indonesia Power Resilient Infrastructure Investment, 2019-2030, (USD Million, AGR%, CAGR %)
Table 8.12 Malaysia Energy Production & Consumption, 2016-2019
Table 8.13 Malaysia Energy Infrastructure Resilience Investment, 2019-2030, (USD Million, AGR%, CAGR %)
Table 8.14 Malaysia Power Generation Infrastructure Investment, by Type, 2019-2030, (USD Million, AGR%, CAGR %)
Table 8.15 Malaysia Power Resilient Infrastructure Investment, 2019-2030, (USD Million, AGR%, CAGR %)
Table 8.16 South Africa Energy Production & Consumption, 2016-2019
Table 8.17 South Africa Energy Infrastructure Resilience Investment, 2019-2030, (USD Million, AGR%, CAGR %)
Table 8.18 South Africa Power Generation Infrastructure Investment, by Type, 2019-2030, (USD Million, AGR%, CAGR %)
Table 8.18 South Africa Power Resilient Infrastructure Investment, 2019-2030, (USD Million, AGR%, CAGR %)
Table 8.19 Iran Energy Production & Consumption, 2016-2019
Table 8.20 Iran Energy Infrastructure Resilience Investment, 2019-2030, (USD Million, AGR%, CAGR %)
Table 8.21 Iran Power Generation Infrastructure Investment, by Type, 2019-2030, (USD Million, AGR%, CAGR %)
Table 8.22 Iran Power Resilient Infrastructure Investment, 2019-2030, (USD Million, AGR%, CAGR %)
Table 8.23 Iraq Energy Infrastructure Resilience Investment, 2019-2030, (USD Million, AGR%, CAGR %)
Table 8.24 Iraq Power Generation Infrastructure Investment, by Type, 2019-2030, (USD Million, AGR%, CAGR %)
Table 8.25 Iraq Power Resilient Infrastructure Investment, 2019-2030, (USD Million, AGR%, CAGR %)
Table 9.1 Impact of Natural Catastrophes on Power Plants
Table 9.2 Planning for Supply Interruptions
Table 9.3 Adaptation: Thermal Generation
Table 9.4 Adaptation: Hydropower
Table 9.5 Adaptation: Wind
Table 9.6 Adaptation: Solar
Table 9.7 Adaptation: Biomass
Table 9.8 Adaptation: Transmission and Distribution
Table 11.1 NRG Energy, Inc. Profile 2020 (CEO, Parent Company Sales US$m, Sales in the Market US$m, HQ, Founded, No. of Employees, Website)
Table 11.2 Total Revenue, 2014-2018, USD Million, AGR %
Table 11.3 NRG Energy Company Recent Developments till Feb,2020
Table 11.4 Centrica plc Profile 2020 (CEO, Parent Company Sales US$m, Sales in the Market US$m, HQ, Founded, No. of Employees, Website)
Table 11.5 Centrica plc Total Revenue, 2015-2019, USD Million, AGR %
Table 11.6 Centrica plc: Company Product & Service Offerings
Table 11.7 Centrica plc: Recent Developments, till Feb-2020
Table 11.8 Siemens AG Profile 2020 (CEO, Parent Company Sales US$m, Sales in the Market US$m, HQ, Founded, No. of Employees, Website)
Table 11.9 Siemens AG Total Revenue, 2015-2019, USD Million, AGR %
Table 11.10 Siemens AG: Recent Developments, till Feb-2020
Table 11.11 EDF Group Profile 2020 (CEO, Parent Company Sales US$m, Sales in the Market US$m, HQ, Founded, No. of Employees, Website)
Table 11.12 EDF Group Total Revenue, 2014-2018, USD Million, AGR %
Table 11.13 EDF Group: Recent Developments, till Feb-2020
Table 11.14 Black & Veatch Holding Company Profile 2020 (CEO, Parent Company Sales US$m, Sales in the Market US$m, HQ, Founded, No. of Employees, Website)
Table 11.15 Black & Veatch Holding: Company Product & Service Offerings
Table 11.16 Black & Veatch Holding: Recent Developments, till Feb-2020
Table 11.17 Black & Veatch Holding: List of Projects
Table 11.18 BLUEWAVE-AI Profile 2020 (CEO, Parent Company Sales US$m, Sales in the Market US$m, HQ, Founded, No. of Employees, Website)
Table 11.19 BluWave-AI Recent Developments, till Feb-2020
Table 11.20 Tetra Tech, Inc. Profile 2020 (CEO, Parent Company Sales US$m, Sales in the Market US$m, HQ, Founded, No. of Employees, Website)
Table 11.21 Tetra Tech, Inc. Total Revenue, 2015-2019, USD Million, AGR %
Table 11.23 Tetra Tech, Inc. Recent Developments, till Feb-2020
Table 11.24 Tetra Tech, Inc. : List of Projects
Table 11.25 AECOM Profile 2020 (CEO, Parent Company Sales US$m, Sales in the Market US$m, HQ, Founded, No. of Employees, Website)
Table 11.26 AECOM Total Revenue, 2015-2019, USD Million, AGR %
Table 11.27 AECOM: Recent Developments, till Feb-2020
Table 11.28 ICF International Inc. Profile 2020 (CEO, Parent Company Sales US$m, Sales in the Market US$m, HQ, Founded, No. of Employees, Website)
Table 11.29 ICF International, Inc. Total Revenue, 2014-2018, USD Million, AGR %
Table 11.30 ICF International, Inc: Company Product & Service Offerings
Table 11.31 Recent Developments, till Feb-2020
Table 11.32 Guidehouse LLP Profile 2020 (CEO, Parent Company Sales US$m, Sales in the Market US$m, HQ, Founded, No. of Employees, Website)
Table 11.33 Recent Developments, till Feb-2020
Table 11.34 ARUP Group Limited Profile 2020 (CEO, Parent Company Sales US$m, Sales in the Market US$m, HQ, Founded, No. of Employees, Website)
Table 11.35 ARUP Group Limited Total Revenue, 2015-2018, USD Million, AGR %
Table 11.36 ARUP Group Limited Recent Developments, till Feb-2020
Table 12.1 Engineering Options to Improve Energy Infrastructure Resilience
Table 12.2 Recommendations to Develop Resilient Infrastructures
List of Figures
Figure 1.1 Overview of Climate Change on Various Infrastructures
Figure 1.2 Key Factors of Pre-Disaster Preparedness
Figure 1.3 Global Energy Infrastructure Resilience Market, 2019-2030, USD Million
Figure 1.4 How Should We Respond to Climate Change Risks
Figure 1.5 Potential Climate Impact Per Asset Class
Figure 1.6 Global Energy Infrastructure Resilience Market Segmentation
Figure 4.1 Evaluating a Resilience Investment Requires Quantifying, Valuing, and Monetizing Its Impact on System Resilience
Figure 4.2 The Metric Of Days Of Survivability Is Used To Quantify The Resilience Benefit Of Adding Solar And Storage To Existing Diesel Generators In A Micro Grid.
Figure 4.3 Comparison of Valuing Resilience v/s Non- Valuing Resilience
Figure 7.1 U.S. Energy Infrastructure, Power Plants by Type, 2020
Figure 7.2 U.S. Climate Change Risk to Energy Infrastructures
Figure 7.3 Canada Energy Infrastructure, Power Plants by Type, 2020
Figure 7.4 Canada Climate Change Risk to Energy Infrastructures
Figure 7.5 U.K. Energy Infrastructure, Power Plants by Type, 2020
Figure 7.6 U.K. Climate Change Risk to Energy Infrastructures
Figure 7.7 Germany Energy Infrastructure, Power Plants by Type, 2020
Figure 7.8 Germany Climate Change Risk to Energy Infrastructures
Figure 7.9 France Energy Infrastructure, Power Plants by Type, 2020
Figure 7.10 France Climate Change Risk to Energy Infrastructures
Figure 7.11 Italy Energy Infrastructure, Power Plants by Type, 2020
Figure 7.12 Italy Climate Change Risk to Energy Infrastructures
Figure 7.13 Spain Energy Infrastructure, Power Plants by Type, 2020
Figure 7.14 Spain Climate Change Risk to Energy Infrastructures
Figure 7.15 China Energy Infrastructure, Power Plants by Type, 2020
Figure 7.16 China Climate Change Risk to Energy Infrastructures
Figure 7.17 Japan Energy Infrastructure, Power Plants by Type, 2020
Figure 7.18 Japan Climate Change Risk to Energy Infrastructures
Figure 7.19 Australia Energy Infrastructure, Power Plants by Type, 2020
Figure 7.20 Australia Climate Change Risk to Energy Infrastructures
Figure 7.21 Saudi Arabia Energy Infrastructure, Power Plants by Type, 2020
Figure 7.22 Saudi Arabia Climate Change Risk to Energy Infrastructures
Figure 7.23 South Korea Energy Infrastructure, Power Plants by Type, 2020
Figure 7.24 South Korea Climate Change Risk to Energy Infrastructures
Figure 7.25 Brazil Energy Infrastructure, Power Plants by Type, 2020
Figure 7.26 Brazil Climate Change Risk to Energy Infrastructures
Figure 7.27 Russia Energy Infrastructure, Power Plants by Type, 2020
Figure 7.28 Russia Climate Change Risk to Energy Infrastructures
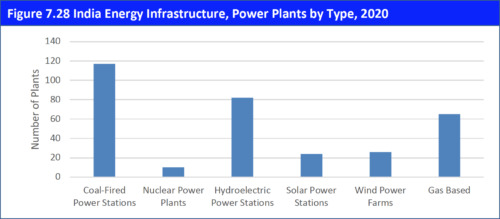
Figure 7.28 India Energy Infrastructure, Power Plants by Type, 2020
Figure 8.1 India Climate Change Risk to Energy Infrastructures
Figure 8.2 Mexico Energy Infrastructure, Power Plants by Type, 2020
Figure 8.3 Mexico Climate Change Risk to Energy Infrastructures
Figure 8.4 Indonesia Energy Infrastructure, Power Plants by Type, 2020
Figure 8.5 Indonesia Climate Change Risk to Energy Infrastructures
Figure 8.6 Malaysia Energy Infrastructure, Power Plants by Type, 2020
Figure 8.7 Malaysia Climate Change Risk to Energy Infrastructures
Figure 8.8 South Africa Energy Infrastructure, Power Plants by Type, 2020
Figure 8.9 South Africa Climate Change Risk to Energy Infrastructures
Figure 8.10 Iran Energy Infrastructure, Power Plants by Type, 2020
Figure 8.11 Iran Climate Change Risk to Energy Infrastructures
Figure 8.12 Iraq Energy Infrastructure, Power Plants by Type, 2020
Figure 8.13 Iraq Climate Change Risk to Energy Infrastructures
Figure 11.1 NRG Energy, Inc. Total Revenue, 2014-2018, USD Million, AGR %
Figure 11.3 NRG Energy, Inc. Operating Income, 2014-2018, USD Million
Figure 11.4 NRG Energy, Inc. Net Income, 2014-2018, USD Million
Figure 11.5 NRG Energy, Inc. EBITDA, 2014-2018, USD Million
Figure 11.6 Centrica plc Total Revenue, 2015-2019, USD Million, AGR %
Figure 11.7 Centrica plc Gross Profit, 2015-2019, USD Million
Figure 11.8 Centrica plc Operating Income, 2015-2019, USD Million
Figure 11.9 Siemens AG Total Revenue, 2015-2019, USD Million, AGR %
Figure 11.10 Siemens AG Operating Income, 2015-2019, USD Million
Figure 11.11 Siemens AG Net Income, 2015-2019, USD Million
Figure 11.12 Siemens AG EBITDA, 2015-2019, USD Million
Figure 11.13 EDF Group Total Revenue, 2014-2018, USD Million, AGR %
Figure 11.14 EDF Group Operating Income, 2014-2018, USD Million
Figure 11.15 EDF Group Net Income, 2014-2018, USD Million
Figure 11.16 EDF Group EBITDA, 2014-2018, USD Million
Figure 11.17 Significant Economic And Environmental Returns On Their Investments
Figure 11.18 BluWave-AI: Company Product & Service Offerings Overview
Figure 11.19 BluWave-AI: Micro-Grids in Distributions
Figure 11.20 BluWave-AI: Application Overview
Figure 11.20 Tetra Tech, Inc. Total Revenue, 2015-2019, USD Million, AGR %
Figure 11.21 Tetra Tech, Inc. Operating Income, 2015-2019, USD Million
Figure 11.22 Tetra Tech, Inc. Net Income, 2015-2019, USD Million
Figure 11.23 Tetra Tech, Inc. EBITDA, 2014-2018, USD Million
Figure 11.24 AECOM Total Revenue, 2015-2019, USD Million, AGR %
Figure 11.25 AECOM Operating Income, 2015-2019, USD Million
Figure 11.26 AECOM Net Income, 2015-2019, USD Million
Figure 11.27 AECOM EBITDA, 2015-2019, USD Million
Figure 11.28 ICF International, Inc. Total Revenue, 2014-2018, USD Million, AGR %
Figure 11.29 ICF International, Inc. Operating Income, 2015-2018, USD Million
Figure 11.30 ICF International, Inc. Net Income, 2015-2018, USD Million
Figure 11.31 ICF International, Inc. EBITDA, 2014-2018, USD Million
Figure 11.32 ARUP Group Limited Total Revenue, 2015-2018, USD Million, AGR %
Figure 11.33 ARUP Group Limited Net Profit, 2015-2018, USD Million
Figure 11.34 ARUP Group Limited EBITDA, 2015-2018, USD Million
AECOM
ARUP Group Limited
Black & Veatch Holding Company
BLUWAVE AI
Centrica Plc.
EDF Group
Guidehouse
ICF International
NRG Energy
Siemens AG
TetraTech Inc.
Download sample pages
Complete the form below to download your free sample pages for Global Energy Infrastructure Resilience Market Forecast 2020-2030
Related reports
-
Carbon Capture, Transportation & Storage Market Report 2021-2031
Government funding initiatives are crucial to ensure that government GHG emissions reduction targets are translated into tangible CCS projects. Visiongain...Full DetailsPublished: 29 September 2020 -
Lithium-Ion Battery Market Report 2021-2031
Enormous growth in the production of lithium-ion batteries is driven by its demand in automobile, industrial, and commercial applications. Big...Full DetailsPublished: 15 March 2021 -
Lithium Iron Phosphate Battery Market Report 2020-2030
Are you aware that global Lithium Iron Phosphate Battery market spending reached $7,284.4 million in 2019? ...Full DetailsPublished: 27 March 2020 -
Gas to Liquids (GTL) Market Forecast 2020-2030
Visiongain assesses that the Global Gas to Liquids (GTL) market was valued at $2,915 million in 2019, and it is...
Full DetailsPublished: 25 February 2020 -
Lithium-Ion Battery Market Report 2020-2030
Visiongain values the lithium-ion battery market at $43.8bn in 2019.
...Full DetailsPublished: 30 March 2020 -
Non-Destructive Testing (NDT) Market Report 2020-2030
The global non-destructive market (NDT) is on the brink of accelerated development as demand from end-users such as automobile, shipping,...
Full DetailsPublished: 02 September 2020 -
Deepwater Drilling Market Report 2020-2030
Deepwater drilling market size in 2030 is largely affected by political and economic instabilities, tensions between the US and Middle...
Full DetailsPublished: 07 April 2020 -
Grid Scale Battery Storage Technologies Market Report 2021-2031
The increasing demand for storage for energy losses, in particular for portable batteries, is predicted to increase. ...Full DetailsPublished: 10 August 2021 -

Solar Thermal Collectors Market Report 2019-2029
According to International Energy Association, renewables will have the fastest growth in the electricity sector, providing almost 30% of power...
Full DetailsPublished: 01 January 1970 -
Global Gas Insulated Switchgear Market Forecast 2020-2030
Visiongain’s analysis indicates that total spending on Gas Insulated Switchgear Market will be $20,293 million in 2020 as global energy...
Full DetailsPublished: 06 March 2020
Download sample pages
Complete the form below to download your free sample pages for Global Energy Infrastructure Resilience Market Forecast 2020-2030
Do you have any custom requirements we can help you with?
Any specific country, geo region, market segment or specific company information?
Email us today, we can discuss your needs and see how we can help: jamie.roberts@visiongain.com
Would you like a free report overview of the report of your choice?
If so, please drop an email to Jamie Roberts stating your chosen report title to jamie.roberts@visiongain.com
Visiongain energy reports are compiled using a broad and rich mixture of both primary and secondary information to produce an overall industry outlook. In order to provide our clients with the best product possible product, we do not rely on any one single source of information. Visiongain analysts reach out to market-leading vendors and industry experts where possible but also review a wealth of financial data and product information from a vast range of sources. To find out more about our reports methodology, please email jamie.roberts@visiongain.com
Would you like to get the latest Visiongain energy reports catalogue?
What are the dynamic growth sectors? where are the regional business opportunities?
Which technologies will prevail and who are the leading companies succeeding in these sectors and why?
If you want definitive answers to business critical questions, discover Visiongain’s full range of business intelligence reports.
If so, please email Jamie Roberts on jamie.roberts@visiongain.com or call her today on +44 207 336 6100
“The Visiongain report was extremely insightful and helped us construct our basic go-to market strategy for our solution.”
H.
“F.B has used Visiongain to prepare two separate market studies on the ceramic proppants market over the last 12 months. These reports have been professionally researched and written and have assisted FBX greatly in developing its business strategy and investment plans.”
F.B
“We just received your very interesting report on the Energy Storage Technologies (EST) Market and this is a very impressive and useful document on that subject.”
I.E.N
“Visiongain does an outstanding job on putting the reports together and provides valuable insight at the right informative level for our needs. The EOR Visiongain report provided confirmation and market outlook data for EOR in MENA with the leading countries being Oman, Kuwait and eventually Saudi Arabia.”
E.S
“Visiongain produced a comprehensive, well-structured GTL Market report striking a good balance between scope and detail, global and local perspective, large and small industry segments. It is an informative forecast, useful for practitioners as a trusted and upto-date reference.”
Y.N Ltd
Association of Dutch Suppliers in the Oil & Gas Industry
Society of Naval Architects & Marine Engineers
Association of Diving Contractors
Association of Diving Contractors International
Associazione Imprese Subacquee Italiane
Australian Petroleum Production & Exploration Association
Brazilian Association of Offshore Support Companies
Brazilian Petroleum Institute
Canadian Energy Pipeline
Diving Medical Advisory Committee
European Diving Technology Committee
French Oil and Gas Industry Council
IMarEST – Institute of Marine Engineering, Science & Technology
International Association of Drilling Contractors
International Association of Geophysical Contractors
International Association of Oil & Gas Producers
International Chamber of Shipping
International Shipping Federation
International Marine Contractors Association
International Tanker Owners Pollution Federation
Leading Oil & Gas Industry Competitiveness
Maritime Energy Association
National Ocean Industries Association
Netherlands Oil and Gas Exploration and Production Association
NOF Energy
Norsk olje og gass Norwegian Oil and Gas Association
Offshore Contractors’ Association
Offshore Mechanical Handling Equipment Committee
Oil & Gas UK
Oil Companies International Marine Forum
Ontario Petroleum Institute
Organisation of the Petroleum Exporting Countries
Regional Association of Oil and Natural Gas Companies in Latin America and the Caribbean
Society for Underwater Technology
Society of Maritime Industries
Society of Petroleum Engineers
Society of Petroleum Enginners – Calgary
Step Change in Safety
Subsea UK
The East of England Energy Group
UK Petroleum Industry Association
All the events postponed due to COVID-19.
Latest Energy news
Visiongain Publishes Carbon Capture Utilisation and Storage (CCUS) Market Report 2024-2034
The global carbon capture utilisation and storage (CCUS) market was valued at US$3.75 billion in 2023 and is projected to grow at a CAGR of 20.6% during the forecast period 2024-2034.
19 April 2024
Visiongain Publishes Liquid Biofuels Market Report 2024-2034
The global Liquid Biofuels market was valued at US$90.7 billion in 2023 and is projected to grow at a CAGR of 6.7% during the forecast period 2024-2034.
03 April 2024
Visiongain Publishes Hydrogen Generation Market Report 2024-2034
The global Hydrogen Generation market was valued at US$162.3 billion in 2023 and is projected to grow at a CAGR of 3.7% during the forecast period 2024-2034.
28 March 2024
Visiongain Publishes Biofuel Industry Market Report 2024-2034
The global Biofuel Industry market was valued at US$123.2 billion in 2023 and is projected to grow at a CAGR of 7.6% during the forecast period 2024-2034.
27 March 2024
