Are you aware that global Lithium Iron Phosphate Battery market spending reached $7,284.4 million in 2019?
Read on to explore how you can maximise your gains from this dynamic sector.
The report discusses:
• What are the key drivers and restraints for each regional market during the 2020-2030 and how these will shape the Lithium Iron Phosphate Battery market.
• How will each submarket grow in Lithium Iron Phosphate Battery Market, what type of end user is going to receive the largest share of investment and what type of application will be dominant in the 2020-2030 period.
• The leading players of the Lithium Iron Phosphate Battery market and what are their prospects over the forecast period
• What will you learn from this lithium iron phosphate battery report?
You will discover the Lithium Iron Phosphate Battery global and regional outlook over a 10-year horizon including:
• US
• Canada
• UK
• Germany
• France
• Rest of Europe
• China
• Japan
• India
• South Korea
• Rest of Asia Pacific
• Brazil
• Argentina
• Rest of Latin America
• GCC
• South Africa
• Rest of Middle East & Africa
• Understand the Lithium Iron Phosphate Battery competitive landscape
View a succinct analysis of Lithium Iron Phosphate Battery industry outlook with an examination and analysis of some of the top companies operating within the Lithium Iron Phosphate Battery market space, including:
• Victron Energy
• Ultralife Corporation
• BYD Company Limited
• Valence Technology
• Umicore S.A.
• Other companies of interest
• Automotive Energy Supply Corporation (AESC)
• Aleees
• Tohoku Murata Manufacturing
• Bestgo Battery Company Limited
• RELiON Batteries
• See detailed Lithium Iron Phosphate Battery submarket forecasts & analysis 2020-2030
• By End User
• By Application
• Read forward looking Lithium Iron Phosphate Battery market analysis
Visiongain is an independent business intelligence consultancy with years of Next Generation Technologies, Storage and Power Generation industry experience.
• Get instant Lithium Iron Phosphate Battery market insight
Find 182 tables & figures over 162 pages, illustrating the Lithium Iron Phosphate Battery market outlook.
Buy our report today Lithium Iron Phosphate Battery Market Report 2020-2030: Forecasts & Analysis by End User (Consumer Electronics, Automotive, Energy Grid, Others), by Application (Portable, Stationery), Including Forecasts by Region (North America, Europe, Asia Pacific, Latin America, Middle East & Africa) Plus Profiles of Leading Companies in the Market. Avoid missing out by staying informed – order our report now.
Visiongain is a trading partner with the US Federal Government
CCR Ref number: KD4R6
Do you have any custom requirements we can help you with? Any need for specific country, geo region, market segment or specific company information? Contact us today, we can discuss your needs and see how we can help: sara.peerun@visiongain.com
1. Report Overview
1.1. Global Lithium Iron Phosphate Battery Overview
1.2. Why You Should Read This Report
1.3. How This Report Delivers
1.4. Key Questions Answered By This Analytical Report
1.5. Who Is This Report For?
1.6. Methodology
1.6.1. Primary Research
1.6.2. Secondary Research
1.6.3. Market Evaluation & Forecasting Methodology
1.7. Frequently Asked Questions (FAQ)
1.8. Associated Visiongain Reports
1.9. About Visiongain
2. Lithium Iron Phosphate Battery: Executive Summary
3. Introduction to the Lithium-ion Battery Materials Industry
3.1. Lithium-ion Battery Materials Industry
3.2. Lithium-ion Battery Materials Industry: Market Dynamics
3.2.1. Declining Lithium-Ion Battery Prices
3.2.2. Availability of Alternatives
3.2.3. Growth of Lithium-Ion Battery Recycling Market
3.2.4. Lithium-ion Battery Materials: Value Chain Analysis
3.2.5. Lithium-ion Battery Materials: Vendor Landscape Analysis
3.2.6. Lithium-ion Battery Materials: Porter’s Five Forces Model
3.2.7. Lithium-ion Battery Materials: Manufacturing Process
4. Lithium Iron Phosphate Battery Market Outlook
4.1. Lithium Outlook
4.2. Lithium Iron Phosphate Battery Industry by Preparation Methods
4.3. Market Trends
4.3.1. Low temperature charging batteries
4.4. Opportunities and Drivers
4.4.1. Increase in The Use of Electric Vehicles
4.4.2. Increase in The Use of Energy Storage
4.5. Market Challenges
4.6. Porter's Five Forces Analysis
4.7. Lithium Iron Phosphate Manufacturing Cost Analysis
4.7.1. Lithium Iron Phosphate Key Raw Materials Analysis
4.7.2. Proportion of Manufacturing Cost Structure
4.7.3. Manufacturing Process Analysis of Lithium Iron Phosphate
4.7.4. Lithium Iron Phosphate Industrial Chain Analysis
4.8. Distribution Channels
4.8.1. Direct Marketing
4.8.2. Indirect Marketing
4.8.3. Marketing Channel Trend
5. Lithium Iron Phosphate Battery Market By End User
5.1. Lithium Iron Phosphate Battery Market Outlook By End User
5.2. Consumer Electronics Revenue Forecast
5.3. Automotive Revenue Forecast
5.4. Grid Energy Storage Revenue Forecast
5.5. Other End Users Revenue Forecast
6. Lithium Iron Phosphate Battery Market By Application
6.1. Lithium Iron Phosphate Battery Market Outlook By Application
6.2. Portable Application Revenue Forecast
6.3. Stationary Application Revenue Forecast
7. Lithium Iron Phosphate Battery Market By Region
7.1. North America Lithium Iron Phosphate Battery Market 2020 – 2030
7.1.1. U.S. Lithium Iron Phosphate Battery Market 2020 – 2030
7.1.2. Canada Lithium Iron Phosphate Battery Market 2020 – 2030
7.2. Europe Lithium Iron Phosphate Battery Market 2020 – 2030
7.2.1. UK Lithium Iron Phosphate Battery Market 2020 – 2030
7.2.2. Germany Lithium Iron Phosphate Battery Market 2020 – 2030
7.2.3. France Lithium Iron Phosphate Battery Market 2020 – 2030
7.2.4. Rest of Europe Lithium Iron Phosphate Battery Market 2020 – 2030
7.3. Asia Pacific Lithium Iron Phosphate Battery Market 2020 – 2030
7.3.1. China Lithium Iron Phosphate Battery Market 2020 – 2030
7.3.2. Japan Lithium Iron Phosphate Battery Market 2020 – 2030
7.3.3. India Lithium Iron Phosphate Battery Market 2020 – 2030
7.3.4. South Korea Lithium Iron Phosphate Battery Market 2020 – 2030
7.3.5. Rest of Asia Pacific Lithium Iron Phosphate Battery Market 2020 – 2030
7.4. Latin America Lithium Iron Phosphate Battery Market 2020 – 2030
7.4.1. Brazil Lithium Iron Phosphate Battery Market 2020 – 2030
7.4.2. Argentina Lithium Iron Phosphate Battery Market 2020 – 2030
7.4.3. Rest of Latin America Lithium Iron Phosphate Battery Market 2020 – 2030
7.5. Middle East & Africa Lithium Iron Phosphate Battery Market 2020 – 2030
7.5.1. GCC Lithium Iron Phosphate Battery Market 2020 – 2030
7.5.2. South Africa Lithium Iron Phosphate Battery Market 2020 – 2030
7.5.3. Rest of Middle East & Africa Lithium Iron Phosphate Battery Market 2020 – 2030
8. The Leading Lithium Iron Phosphate Battery Companies
8.1. Valence Technology
8.1.1. Company Overview
8.1.2. Product Benchmarking
8.1.3. Financials
8.1.4. Recent News
8.2. Automotive Energy Supply Corporation (AESC)
8.2.1. Company Overview
8.2.2. Product Benchmarking
8.2.3. Recent News
8.3. Aleees
8.3.1. Company Overview
8.3.2. Product Benchmarking
8.3.3. Financials
8.4. BYD Company Limited
8.4.1. Company Overview
8.4.2. Product Benchmarking
8.4.3. Financials
8.4.4. Recent News
8.5. Umicore
8.5.1. Company Overview
8.5.2. Product Benchmarking
8.5.3. Financials
8.5.4. Recent News
8.6. Victron Energy
8.6.1. Company Overview
8.6.2. Product Benchmarking
8.6.3. Financials
8.7. Bestgo Battery Co., Ltd.
8.7.1. Company Overview
8.7.2. Product Benchmarking
8.7.3. Financials
8.8. Ultralife Corporation
8.8.1. Company Overview
8.8.2. Financials
8.8.3. Product Benchmarking
8.8.4. Recent News
8.9. Tohoku Murata Manufacturing
8.9.1. Company Overview
8.9.2. Financials
8.9.3. Product Benchmarking
8.9.4. Recent News
8.10. RELiON Batteries
8.10.1. Company Overview
8.10.2. Product Benchmarking
8.10.3. Financials
8.10.4. Recent News
9. Conclusion & Recommendations
10. Glossary
Visiongain Report Sales Order Form
Appendix A
About Visiongain
Appendix B
Visiongain report evaluation form
List of Figures
Figure 3.1 Annual lithium-ion battery price, 2010 – 2019 (USD/kWh)
Figure 3.2 Global lithium demand, 2015 – 2025, (LCE Kilo Tons)
Figure 3.3 Value Chain Analysis: Raw Material Analysis
Figure 3.4 Value Chain Analysis: Battery and Other Components
Figure 3.5 Value Chain Analysis: Battery Pack
Figure 3.6 Value Chain Analysis: Application
Figure 3.7 Average cost structure of lithium-ion cell in 2019 (%)
Figure 3.8 Company market share, by volume, 2019 (%)
Figure 3.9 Company market share, by revenue, 2019 (%)
Figure 3.10 Lithium-ion Battery Materials: Porter’s Five Forces Model
Figure 3.11 Lithium-ion battery manufacturing process
Figure 3.12 Coating process in lithium battery manufacturing
Figure 4.1 Countries with the largest lithium reserves worldwide as of 2019 (Tons)
Figure 4.2 Worldwide number of battery electric vehicles in use from 2012 to 2018 (Thousand Units)
Figure 4.3 Global energy storage market, 2015 – 2025 (USD Billion)
Figure 4.4 Proportion of manufacturing cost structure, 2019 (%)
Figure 4.5 Manufacturing Process of Lithium Iron Phosphate Cathode Solid State
Figure 4.6 Manufacturing Process of Lithium Iron Phosphate Cathode Solid State
Figure 4.7 Manufacturing Process of Lithium Iron Phosphate Cathode Solution Based
Figure 4.8 Lithium extraction to battery cell manufacturing
Figure 4.9 Lithium- ion battery industry chain
Figure 5.1 Global Lithium Iron Phosphate Battery Market Size By End User, 2020 – 2030 (USD Mn)
Figure 5.2 Global Lithium Iron Phosphate Battery Market Size By End User, 2020 – 2030 (MWh)
Figure 5.3 Global Lithium Iron Phosphate Battery Revenue Market Share By End User, 2020, 2025, 2030 (%)
Figure 5.4 Global Lithium Iron Phosphate Battery Volume Market Share By End User, 2020, 2025, 2030 (%)
Figure 5.5 Lithium Iron Phosphate Battery for Consumer Electronics Market Value Forecast, 2020 – 2030 (USD Mn, AGR %)
Figure 5.6 Lithium Iron Phosphate Battery for Consumer Electronics Market Value Forecast, 2020 – 2030 (MWh, AGR %)
Figure 5.7 Lithium Iron Phosphate Battery for Automotive Market Value Forecast, 2020 – 2030 (USD Mn, AGR %)
Figure 5.8 Lithium Iron Phosphate Battery for Automotive Market Value Forecast, 2020 – 2030 (MWh, AGR %)
Figure 5.9 Lithium Iron Phosphate Battery for Grid Energy Storage Market Value Forecast, 2020 – 2030 (USD Mn, AGR %)
Figure 5.10 Lithium Iron Phosphate Battery for Grid Energy Storage Market Value Forecast, 2020 – 2030 (MWh, AGR %)
Figure 5.11 Lithium Iron Phosphate Battery for Other End Users Market Value Forecast, 2020 – 2030 (USD Mn, AGR %)
Figure 5.12 Lithium Iron Phosphate Battery for Other End Users Market Value Forecast, 2020 – 2030 (MWh, AGR %)
Figure 6.1 Global Lithium Iron Phosphate Battery Market Size By Application, 2020 – 2030 (USD Mn)
Figure 6.2 Global Lithium Iron Phosphate Battery Market Size By Application, 2020 – 2030 (MWh)
Figure 6.3 Global Lithium Iron Phosphate Battery Revenue Market Share By End User, 2020, 2025, 2030 (%)
Figure 6.4 Global Lithium Iron Phosphate Battery Volume Market Share By End User, 2020, 2025, 2030 (%)
Figure 6.5 Lithium Iron Phosphate Battery for Portable Application Market Value Forecast, 2020 – 2030 (USD Mn, AGR %)
Figure 6.6 Lithium Iron Phosphate Battery for Portable Application Market Value Forecast, 2020 – 2030 (MWh, AGR %)
Figure 6.7 Lithium Iron Phosphate Battery for Stationary Application Market Value Forecast, 2020 – 2030 (USD Mn, AGR %)
Figure 6.8 Lithium Iron Phosphate Battery for Stationary Application Market Value Forecast, 2020 – 2030 (MWh, AGR %)
Figure 7.1 Global Lithium Iron Phosphate Battery Market Size By Region, 2020 – 2030 (USD Mn)
Figure 7.2 Global Lithium Iron Phosphate Battery Market Size By Region, 2020 – 2030 (MWh)
Figure 7.3 Global Lithium Iron Phosphate Battery Revenue Market Share By Region, 2020, 2025, 2030 (%)
Figure 7.4 Global Lithium Iron Phosphate Battery Volume Market Share By Region, 2020, 2025, 2030 (%)
Figure 7.5 North America Lithium Iron Phosphate Battery Market Size, 2020 – 2030 (USD Mn, %)
Figure 7.6 North America Lithium Iron Phosphate Battery Market Size, 2020 – 2030 (MWh, %)
Figure 7.7 North America Lithium Iron Phosphate Battery Revenue Market Share By Country, 2020, 2025, 2030 (%)
Figure 7.8 North America Lithium Iron Phosphate Battery Volume Market Share By Country, 2020, 2025, 2030 (%)
Figure 7.9 U.S. Lithium Iron Phosphate Battery Market Size, 2020 – 2030 (USD Mn, %)
Figure 7.10 U.S. Lithium Iron Phosphate Battery Market Size, 2020 – 2030 (MWh, %)
Figure 7.11 Canada Lithium Iron Phosphate Battery Market Size, 2020 – 2030 (USD Mn, %)
Figure 7.12 Canada Lithium Iron Phosphate Battery Market Size, 2020 – 2030 (MWh, %)
Figure 7.13 Europe Lithium Iron Phosphate Battery Market Size, 2020 – 2030 (USD Mn, %)
Figure 7.14 Europe Lithium Iron Phosphate Battery Market Size, 2020 – 2030 (MWh, %)
Figure 7.15 Europe Lithium Iron Phosphate Battery Revenue Market Share By Country, 2020, 2025, 2030 (%)
Figure 7.16 Europe Lithium Iron Phosphate Battery Volume Market Share By Country, 2020, 2025, 2030 (%)
Figure 7.17 UK Lithium Iron Phosphate Battery Market Size, 2020 – 2030 (USD Mn, %)
Figure 7.18 UK Lithium Iron Phosphate Battery Market Size, 2020 – 2030 (MWh, %)
Figure 7.19 Germany Lithium Iron Phosphate Battery Market Size, 2020 – 2030 (USD Mn, %)
Figure 7.20 Germany Lithium Iron Phosphate Battery Market Size, 2020 – 2030 (MWh, %)
Figure 7.21 France Lithium Iron Phosphate Battery Market Size, 2020 – 2030 (USD Mn, %)
Figure 7.22 France Lithium Iron Phosphate Battery Market Size, 2020 – 2030 (MWh, %)
Figure 7.23 Rest of Europe Lithium Iron Phosphate Battery Market Size, 2020 – 2030 (USD Mn, %)
Figure 7.24 Rest of Europe Lithium Iron Phosphate Battery Market Size, 2020 – 2030 (MWh, %)
Figure 7.25 Asia Pacific Lithium Iron Phosphate Battery Market Size, 2020 – 2030 (USD Mn, %)
Figure 7.26 Asia Pacific Lithium Iron Phosphate Battery Market Size, 2020 – 2030 (MWh, %)
Figure 7.27 Asia Pacific Lithium Iron Phosphate Battery Revenue Market Share By Country, 2020, 2025, 2030 (%)
Figure 7.28 Asia Pacific Lithium Iron Phosphate Battery Volume Market Share By Country, 2020, 2025, 2030 (%)
Figure 7.29 China Lithium Iron Phosphate Battery Market Size, 2020 – 2030 (USD Mn, %)
Figure 7.30 China Lithium Iron Phosphate Battery Market Size, 2020 – 2030 (MWh, %)
Figure 7.31 Japan Lithium Iron Phosphate Battery Market Size, 2020 – 2030 (USD Mn, %)
Figure 7.32 Japan Lithium Iron Phosphate Battery Market Size, 2020 – 2030 (MWh, %)
Figure 7.33 India Lithium Iron Phosphate Battery Market Size, 2020 – 2030 (USD Mn, %)
Figure 7.34 India Lithium Iron Phosphate Battery Market Size, 2020 – 2030 (MWh, %)
Figure 7.35 South Korea Lithium Iron Phosphate Battery Market Size, 2020 – 2030 (USD Mn, %)
Figure 7.36 South Korea Lithium Iron Phosphate Battery Market Size, 2020 – 2030 (MWh, %)
Figure 7.37 Rest of Asia Pacific Lithium Iron Phosphate Battery Market Size, 2020 – 2030 (USD Mn, %)
Figure 7.38 Rest of Asia Pacific Lithium Iron Phosphate Battery Market Size, 2020 – 2030 (MWh, %)
Figure 7.39 Latin America Lithium Iron Phosphate Battery Market Size, 2020 – 2030 (USD Mn, %)
Figure 7.40 Latin America Lithium Iron Phosphate Battery Market Size, 2020 – 2030 (MWh, %)
Figure 7.41 Latin America Lithium Iron Phosphate Battery Revenue Market Share By Country, 2020, 2025, 2030 (%)
Figure 7.42 Latin America Lithium Iron Phosphate Battery Volume Market Share By Country, 2020, 2025, 2030 (%)
Figure 7.43 Brazil Lithium Iron Phosphate Battery Market Size, 2020 – 2030 (USD Mn, %)
Figure 7.44 Brazil Lithium Iron Phosphate Battery Market Size, 2020 – 2030 (MWh, %)
Figure 7.45 Argentina Lithium Iron Phosphate Battery Market Size, 2020 – 2030 (USD Mn, %)
Figure 7.46 Argentina Lithium Iron Phosphate Battery Market Size, 2020 – 2030 (MWh, %)
Figure 7.47 Rest of Latin America Lithium Iron Phosphate Battery Market Size, 2020 – 2030 (USD Mn, %)
Figure 7.48 Rest of Latin America Lithium Iron Phosphate Battery Market Size, 2020 – 2030 (MWh, %)
Figure 7.49 Middle East & Africa Lithium Iron Phosphate Battery Market Size, 2020 – 2030 (USD Mn, %)
Figure 7.50 Middle East & Africa Lithium Iron Phosphate Battery Market Size, 2020 – 2030 (MWh, %)
Figure 7.51 Middle East & Africa Lithium Iron Phosphate Battery Revenue Market Share By Country, 2020, 2025, 2030 (%)
Figure 7.52 Middle East & Africa Lithium Iron Phosphate Battery Volume Market Share By Country, 2020, 2025, 2030 (%)
Figure 7.53 GCC Lithium Iron Phosphate Battery Market Size, 2020 – 2030 (USD Mn, %)
Figure 7.54 GCC Lithium Iron Phosphate Battery Market Size, 2020 – 2030 (MWh, %)
Figure 7.55 South Africa Lithium Iron Phosphate Battery Market Size, 2020 – 2030 (USD Mn, %)
Figure 7.56 South Africa Lithium Iron Phosphate Battery Market Size, 2020 – 2030 (MWh, %)
Figure 7.57 Rest of Middle East & Africa Lithium Iron Phosphate Battery Market Size, 2020 – 2030 (USD Mn, %)
Figure 7.58 Rest of Middle East & Africa Lithium Iron Phosphate Battery Market Size, 2020 – 2030 (MWh, %)
Figure 8.1 BYD Company Limited: Financials (US$ Million)
Figure 8.2 Umicore: Financials (US$ Million)
Figure 8.3 Ultralife Corporation: Financials (US$ Million)
Figure 8.4 Murata Manufacturing Co Ltd: Financials (US$ Million)
List of Tables
Table 2.1 Global Lithium Iron Phosphate Battery, 2020 – 2030 (USD Million)
Table 4.1 Electric Vehicle Models, Assembly Locations, and Estimated Sales
Table 4.2 Electric Vehicle and Battery Manufacturing Plant Investments
Table 4.3 Key Suppliers of Raw Materials
Table 5.1 Lithium Iron Phosphate Battery Revenue Market for Consumer Electronics, Forecast 2020-2030 (USD Mn, AGR %, CAGR %)
Table 5.2 Lithium Iron Phosphate Battery Revenue Market for Consumer Electronics, Forecast 2020-2030 (MWh, AGR %, CAGR %)
Table 5.3 Lithium Iron Phosphate Battery Revenue Market for Automotive, Forecast 2020-2030 (USD Mn, AGR %, CAGR %)
Table 5.4 Lithium Iron Phosphate Battery Revenue Market for Automotive, Forecast 2020-2030 (MWh, AGR %, CAGR %)
Table 5.5 Lithium Iron Phosphate Battery Revenue Market for Grid Energy Storage, Forecast 2020-2030 (USD Mn, AGR %, CAGR %)
Table 5.6 Lithium Iron Phosphate Battery Revenue Market for Grid Energy Storage, Forecast 2020-2030 (MWh, AGR %, CAGR %)
Table 5.7 Lithium Iron Phosphate Battery Revenue Market for Other End Users, Forecast 2020-2030 (USD Mn, AGR %, CAGR %)
Table 5.8 Lithium Iron Phosphate Battery Revenue Market for Other End Users, Forecast 2020-2030 (MWh, AGR %, CAGR %)
Table 6.1 Lithium Iron Phosphate Battery Revenue Market for Portable Application, Forecast 2020-2030 (USD Mn, AGR %, CAGR %)
Table 6.2 Lithium Iron Phosphate Battery Revenue Market for Portable Application, Forecast 2020-2030 (MWh, AGR %, CAGR %)
Table 6.3 Lithium Iron Phosphate Battery Revenue Market for Stationary Application, Forecast 2020-2030 (USD Mn, AGR %, CAGR %)
Table 6.4 Lithium Iron Phosphate Battery Revenue Market for Stationary Application, Forecast 2020-2030 (MWh, AGR %, CAGR %)
Table 7.1 North America Lithium Iron Phosphate Battery Market Value Forecast 2020-2030 (USD Mn, AGR %, CAGR%)
Table 7.2 North America Lithium Iron Phosphate Battery Market Volume Forecast 2020-2030 (MWh, AGR %, CAGR%)
Table 7.3 U.S. Lithium Iron Phosphate Battery Market Value Forecast 2020-2030 (USD Mn, AGR %, CAGR%)
Table 7.4 U.S. Lithium Iron Phosphate Battery Market Volume Forecast 2020-2030 (MWh, AGR %, CAGR%)
Table 7.5 Canada Lithium Iron Phosphate Battery Market Value Forecast 2020-2030 (USD Mn, AGR %, CAGR%)
Table 7.6 Canada Lithium Iron Phosphate Battery Market Volume Forecast 2020-2030 (MWh, AGR %, CAGR%)
Table 7.7 Europe Lithium Iron Phosphate Battery Market Value Forecast 2020-2030 (USD Mn, AGR %, CAGR%)
Table 7.8 Europe Lithium Iron Phosphate Battery Market Volume Forecast 2020-2030 (MWh, AGR %, CAGR%)
Table 7.9 UK Lithium Iron Phosphate Battery Market Value Forecast 2020-2030 (USD Mn, AGR %, CAGR%)
Table 7.10 UK Lithium Iron Phosphate Battery Market Volume Forecast 2020-2030 (MWh, AGR %, CAGR%)
Table 7.11 Germany Lithium Iron Phosphate Battery Market Value Forecast 2020-2030 (USD Mn, AGR %, CAGR%)
Table 7.12 Germany Lithium Iron Phosphate Battery Market Volume Forecast 2020-2030 (MWh, AGR %, CAGR%)
Table 7.13 France Lithium Iron Phosphate Battery Market Value Forecast 2020-2030 (USD Mn, AGR %, CAGR%)
Table 7.14 France Lithium Iron Phosphate Battery Market Volume Forecast 2020-2030 (MWh, AGR %, CAGR%)
Table 7.15 Rest of Europe Lithium Iron Phosphate Battery Market Value Forecast 2020-2030 (USD Mn, AGR %, CAGR%)
Table 7.16 Rest of Europe Lithium Iron Phosphate Battery Market Volume Forecast 2020-2030 (MWh, AGR %, CAGR%)
Table 7.17 Asia Pacific Lithium Iron Phosphate Battery Market Value Forecast 2020-2030 (USD Mn, AGR %, CAGR%)
Table 7.18 Asia Pacific Lithium Iron Phosphate Battery Market Volume Forecast 2020-2030 (MWh, AGR %, CAGR%)
Table 7.19 China Lithium Iron Phosphate Battery Market Value Forecast 2020-2030 (USD Mn, AGR %, CAGR%)
Table 7.20 China Lithium Iron Phosphate Battery Market Volume Forecast 2020-2030 (MWh, AGR %, CAGR%)
Table 7.21 Japan Lithium Iron Phosphate Battery Market Value Forecast 2020-2030 (USD Mn, AGR %, CAGR%)
Table 7.22 Japan Lithium Iron Phosphate Battery Market Volume Forecast 2020-2030 (MWh, AGR %, CAGR%)
Table 7.23 India Lithium Iron Phosphate Battery Market Value Forecast 2020-2030 (USD Mn, AGR %, CAGR%)
Table 7.24 India Lithium Iron Phosphate Battery Market Volume Forecast 2020-2030 (MWh, AGR %, CAGR%)
Table 7.25 South Korea Lithium Iron Phosphate Battery Market Value Forecast 2020-2030 (USD Mn, AGR %, CAGR%)
Table 7.26 South Korea Lithium Iron Phosphate Battery Market Volume Forecast 2020-2030 (MWh, AGR %, CAGR%)
Table 7.27 Rest of Asia Pacific Lithium Iron Phosphate Battery Market Value Forecast 2020-2030 (USD Mn, AGR %, CAGR%)
Table 7.28 Rest of Asia Pacific Lithium Iron Phosphate Battery Market Volume Forecast 2020-2030 (MWh, AGR %, CAGR%)
Table 7.29 Latin America Lithium Iron Phosphate Battery Market Value Forecast 2020-2030 (USD Mn, AGR %, CAGR%)
Table 7.30 Latin America Lithium Iron Phosphate Battery Market Volume Forecast 2020-2030 (MWh, AGR %, CAGR%)
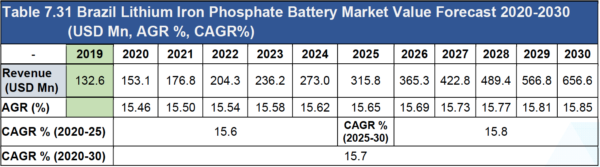
Table 7.31 Brazil Lithium Iron Phosphate Battery Market Value Forecast 2020-2030 (USD Mn, AGR %, CAGR%)
Table 7.32 Brazil Lithium Iron Phosphate Battery Market Volume Forecast 2020-2030 (MWh, AGR %, CAGR%)
Table 7.33 Argentina Lithium Iron Phosphate Battery Market Value Forecast 2020-2030 (USD Mn, AGR %, CAGR%)
Table 7.34 Argentina Lithium Iron Phosphate Battery Market Volume Forecast 2020-2030 (MWh, AGR %, CAGR%)
Table 7.35 Rest of Latin America Lithium Iron Phosphate Battery Market Value Forecast 2020-2030 (USD Mn, AGR %, CAGR%)
Table 7.36 Rest of Latin America Lithium Iron Phosphate Battery Market Volume Forecast 2020-2030 (MWh, AGR %, CAGR%)
Table 7.37 Middle East & Africa Lithium Iron Phosphate Battery Market Value Forecast 2020-2030 (USD Mn, AGR %, CAGR%)
Table 7.38 Middle East & Africa Lithium Iron Phosphate Battery Market Volume Forecast 2020-2030 (MWh, AGR %, CAGR%)
Table 7.39 GCC Lithium Iron Phosphate Battery Market Value Forecast 2020-2030 (USD Mn, AGR %, CAGR%)
Table 7.40 GCC Lithium Iron Phosphate Battery Market Volume Forecast 2020-2030 (MWh, AGR %, CAGR%)
Table 7.41 South Africa Lithium Iron Phosphate Battery Market Value Forecast 2020-2030 (USD Mn, AGR %, CAGR%)
Table 7.42 South Africa Lithium Iron Phosphate Battery Market Volume Forecast 2020-2030 (MWh, AGR %, CAGR%)
Table 7.43 Rest of Middle East & Africa Lithium Iron Phosphate Battery Market Revenue Forecast 2020-2030 (USD Mn, AGR %, CAGR%)
Table 7.44 Rest of Middle East & Africa Lithium Iron Phosphate Battery Market Volume Forecast 2020-2030 (MWh, AGR %, CAGR%)
Table 8.1 Valence Technology: Product Benchmarking
Table 8.2 Valence Technology: Financial Performance (2018)
Table 8.3 AESC: Product Benchmarking
Table 8.4 Aleees: Product Benchmarking
Table 8.5 Aleees: Financial Performance (2018)
Table 8.6 BYD Company Limited: Product Benchmarking
Table 8.7 BYD Company Limited: Financial Performance (2017 – 2019)
Table 8.8 Umicore: Product Benchmarking
Table 8.9 Umicore: Financial Performance (2017 – 2019)
Table 8.10 Victron Energy: Product Benchmarking
Table 8.11 Victron Energy: Financial Performance (2018)
Table 8.12 Bestgo Battery Co., Ltd.: Product Benchmarking
Table 8.13 Bestgo Battery Co., Ltd.: Financial Performance (2018)
Table 8.14 Ultralife Corporation: Financial Performance (2016 – 2019)
Table 8.15 Ultralife Corporation: Product Benchmarking
Table 8.16 Murata Manufacturing Co Ltd: Financial Performance (2017-2019)
Table 8.17 Tohoku Murata Manufacturing: Product Benchmarking
Table 8.18 RELiON Batteries: Product Benchmarking
Table 8.19 RELiON Batteries: Financial Performance
Aleees
Automotive Energy Supply Corporation (AESC)
Bestgo Battery Company Limited
BYD Company Limited
RELiON Batteries
Tohoku Murata Manufacturing
Ultralife Corporation
Umicore S.A.
Valence Technology
Victron Energy