Industries > Energy > Non-Destructive Testing (NDT) Market Report 2020-2030
 Market Report 2020-2030")
Non-Destructive Testing (NDT) Market Report 2020-2030
Forecasts by Offering (NDT Services, NDT Equipment), Technique (Ultrasonic Testing, Visual Inspection Testing, Magnetic Particle Testing, Liquid Penetrant Testing, Eddy Current Testing, Radiographic Testing, Acoustic Emission Testing, Others), End-users (Oil and Gas, Power Generation, Aerospace and Defence, Automotive, Infrastructure, Manufacturing, Others), Region (North America, Europe, Asia Pacific, Latin America, Middle East & Africa) PLUS COVID-19 Recovery Scenarios and Profiles of Leading NDT Companies
Non-Destructive Testing (NDT) Market–our new study reveals trends, R&D progress, and predicted revenues
Where is the Non-Destructive Testing (NDT) market heading? If you are involved in this sector you must read this newly updated report. Visiongain’s report shows you the potential revenues streams to 2030, assessing data, trends, opportunities, and business prospects there.
The global non-destructive market (NDT) is on the brink of accelerated development as demand from end-users such as automobile, shipping, aerospace, defence sectors rises. It will remain the key drivers for world industry sales with developments such as increasing industrialization, road and air network enhancement and oil storage building, oil pipeline production and pipeline production. Visiongain anticipates that the companies which rely on their product range and marketing strategy will achieve a strategic advantage over other market players.
This report includes data analysis and invaluable insight into how COVID-19 will affect your industry. Access this report today.
To access the data contained in this document please email contactus@visiongain.com
Discover how to stay ahead
Our 438 pages report provides 301 tables and 290 charts/graphs. Read on to discover the most lucrative areas in the industry and future market prospects. Our new study lets you assess forecasted sales at overall world market and regional level. See financial results, trends, opportunities, and revenue predictions. Much opportunity remains in this growing Non-Destructive Testing (NDT) Market. See how to exploit opportunities.
Drivers
• Increasing Life Span of Mature Infrastructure
• Outsourcing of Non-Core Activities
• Maintenance Optimization of Effective Operations
• Increasing Use of Monitoring Testing
• Continuous Advances in Electronics, Automation, and Robotics
Opportunities
• Growing Demand for NDT Inspection Services from Power Generation Industry
• Large-Scale Infrastructural Developments
• Use of Drones and Crawling Robots for NDT
Forecasts to 2030 and other analyses reveal the commercial prospects
• In addition to revenue forecasting to 2030, our new study provides you with recent results, growth rates, and market shares.
• You find original analyses, with business outlooks and developments.
• Discover qualitative analyses (including market dynamics, drivers, opportunities, restraints and challenges), product profiles and commercial developments.
Discover sales predictions for the world market and submarkets
By Offering
• NDT Services
• NDT Equipment
By Technique
• Ultrasonic Testing
• Visual Inspection Testing
• Magnetic Particle Testing
• Liquid Penetrant Testing
• Eddy Current Testing
• Radiographic Testing
• Acoustic Emission Testing
• Others
By End-Users
• Oil and Gas
• Power Generation
• Aerospace and Defence
• Automotive
• Infrastructure
• Manufacturing
• Others

In addition to the revenue predictions for the overall world market and segments, you will also find revenue forecasts for 5 regional and 16 leading national markets:
• North America
• U.S.
• Canada
• Europe
• Germany
• France
• UK
• Italy
• Russia
• Rest of Europe
• Asia Pacific
• China
• Japan
• India
• Australia
• South Korea
• Rest of Asia Pacific
• Latin America
• Brazil
• Mexico
• Rest of Latin America
• Middle East & Africa
• GCC
• South Africa
• Rest of Middle East & Africa
The report also includes profiles and for some of the leading companies in the Non-Destructive Testing (NDT) Market, with a focus on this segment of these companies’ operations.
Leading companies and the potential for market growth
Overall world revenue for Non-Destructive Testing (NDT) Market will surpass $xx million in 2020, our work calculates. We predict strong revenue growth through to 2030.
Our work identifies which organizations hold the greatest potential. Discover their capabilities, progress, and commercial prospects, helping you stay ahead.
How the Non-Destructive Testing (NDT) Market report helps you:
In summary, our 438 pages report provides you with the following knowledge:
• Revenue forecasts to 2030 for Non-Destructive Testing (NDT) Market, with forecasts for Product Category, Drug Type, API, FDF, and End User, each forecasted at a global and regional level– discover the industry’s prospects, finding the most lucrative places for investments and revenues
• Revenue forecasts to 2030 for 5 regional and 16 key national markets – See forecasts for the Non-Destructive Testing (NDT) market in North America, Europe, Asia-Pacific, Latin America and Middle East and Africa. Also forecasted is the market in the US, Canada, Argentina, Brazil, Germany, France, UK, Italy, Russia, China, India, Japan, and Australia among other prominent economies.
• Prospects for established firms and those seeking to enter the market– including company profiles for 17 of the major companies involved in the Non-Destructive Testing (NDT) Market. Some of the company’s profiled in this report include Ashtead Technology, Inc., Bosello High Technology S.R.L., Fujifilm Holding Corporation, GE Measurement, Intertek Group PLC, Magnaflux Corporation, MISTRAS group, Nikon Metrology, Olympus Corporation, SSG SA, Sonatest Ltd., Zetec Inc., EDDYFI NDT, YXLON International, T.D. Williamson, Inc., Labquip NDT, and FPrimeC Solutions Inc.
Find quantitative and qualitative analyses with independent predictions. Receive information that only our report contains, staying informed with this invaluable business intelligence.
Information found nowhere else
With our newly report title, you are less likely to fall behind in knowledge or miss out on opportunities. See how our work could benefit your research, analyses, and decisions.
Visiongain’s study is for everybody needing commercial analyses for the Non-Destructive Testing (NDT) Market and leading companies. You will find data, trends and predictions.
To access the data contained in this document please email contactus@visiongain.com
Buy our report today Non-Destructive Testing (NDT) Market Analysis : Forecasts by Offering (NDT Services, NDT Equipment), Technique (Ultrasonic Testing, Visual Inspection Testing, Magnetic Particle Testing, Liquid Penetrant Testing, Eddy Current Testing, Radiographic Testing, Acoustic Emission Testing, Others), End-users (Oil and Gas, Power Generation, Aerospace and Defence, Automotive, Infrastructure, Manufacturing, Others), Region (North America, Europe, Asia Pacific, Latin America, Middle East & Africa) PLUS COVID-19 Recovery Scenarios and Profiles of Leading NDT Companies. Avoid missing out by staying informed – order our report now.
Visiongain is a trading partner with the US Federal Government
CCR Ref number: KD4R6
Do you have any custom requirements we can help you with? Any need for a specific country, geo region, market segment or specific company information? Contact us today, we can discuss your needs and see how we can help: sara.peerun@visiongain.com
1. Report Overview
1.1 Introduction to Non-Destructive Testing Market
1.1. Global Non-Destructive Testing Market Segmentation
1.2 Non-Destructive Testing Market Definition
1.3 Non-Destructive Testing Techniques Submarkets Definitions
1.3.1 NDT Equipment
1.3.2 NDT Services
1.4 Non-Destructive Testing End User Submarkets Definitions
1.4.1 Oil and Gas
1.4.2 Power Generation
1.4.3 Aerospace and Defence
1.4.4 Automotive
1.4.5 Infrastructure
1.4.6 Manufacturing
1.4.7 Others
1.5 Non-Destructive Testing Techniques Submarkets Definitions
1.5.1 Visual Inspection
1.5.2 Magnetic Particle
1.5.3 Liquid Penetrant
1.5.4 Ultrasonic
1.5.5 Radiography
1.5.6 Eddy Current
1.5.7 Acoustic Emission
1.5.8 Other Techniques
1.6 Why You Should Read This Report
1.7 What This Report Delivers
1.8 Key Questions Answered by This Analytical Report Include:
1.9 Who is This Report For?
1.10 Methodology
1.10.1 COVID-19 Impact: Recovery Scenarios
1.10.2 Market Evaluation & Forecasting Methodology
1.11 Frequently Asked Questions (FAQs)
1.12 Associated Visiongain Reports
1.13 About Visiongain
2 Executive Summary
3 Global Non-Destructive Testing Market Dynamics
3.1 Drivers
3.1.1 Increasing Life Span of Mature Infrastructure
3.1.2 Outsourcing of Non-Core Activities
3.1.3 Government Regulations
3.1.4 Maintenance Optimisation of Effective Operations
3.1.5 Increasing Use of Monitoring Testing
3.1.6 Advancement in Medical Imaging
3.1.7 Continuous Advances in Electronics, Automation, and Robotics
3.2 Restraints
3.2.1 Lack of Skilled Professionals
3.2.2 Increased Complexity of Machines and Structures
3.2.3 High Cost of Automated NDT Equipment
3.2.4 Challenges for UT inspection of aerospace composite structures
3.3 Opportunities
3.3.1 Growing Demand for NDT Inspection Services from Power Generation Industry
3.3.2 Importance of NDT Market in Controlling Corrosion in Aging Infrastructure
3.3.3 Large-Scale Infrastructural Developments
3.3.4 NDT in New Developments
3.4 Market Trends
3.4.1 Use of Drones and Crawling Robots for NDT
3.4.2 Increasing Use of Open Architecture
3.4.3 Commercial Off-The-Shelf (COTS) Products
3.5 Porter’s Five Forces Analysis
3.5.1 Bargaining Power of Suppliers
3.5.2 Competitive Rivalry
3.5.3 Threat of New Entrants
3.5.4 Threat of Substitute
3.5.5 Bargaining Power of Buyer
3.6 SWOT Analysis
3.6.1 Strengths
3.6.2 Weaknesses
3.6.3 Opportunities
3.6.4 Threats
4 Global Non-Destructive Testing Market Size Forecast 2020-2030 by Offering
4.1 NDT Services
4.1.1 Global Non-Destructive Testing Market for NDT Services Revenue Forecast, 2020-2030 (US$ Mn, AGR%, CAGR%) (Pre COVID & V, U, W, L Recovery Scenarios)
4.1.2 Process involving inspecting, testing, or evaluating materials
4.2 NDT Equipment
4.2.1 Global Non-Destructive Testing Market for NDT Equipment Revenue Forecast, 2020-2030 (US$ Mn, AGR%, CAGR%) (Pre COVID & V, U, W, L Recovery Scenarios)
4.2.2 Refers to a range of inspection techniques used to determine certain characteristics of materials without damaging material
5 Global Non-Destructive Testing Market Size Forecast 2020-2030 by Technique
5.1 Ultrasonic Testing
5.1.1 Global Non-Destructive Testing Market for Ultrasonic Testing Revenue Forecast, 2020-2030 (US$ Mn, AGR%, CAGR%) (Pre COVID & V, U, W, L Recovery Scenarios)
5.1.2 Extensively applicable in several industries where steel and aluminium are used, including construction, infrastructure, manufacturing, aerospace and defence,
5.2 Visual Inspection Testing
5.2.1 Global Non-Destructive Testing Market for Visual Inspection Testing Revenue Forecast, 2020-2030 (US$ Mn, AGR%, CAGR%) (Pre COVID & V, U, W, L Recovery Scenarios)
5.2.2 This technique is more suitable for large sized objects wherein the flaws can easily be detected by a human eye
5.3 Magnetic Particle Testing
5.3.1 Global Non-Destructive Testing Market for Magnetic Particle Testing Revenue Forecast, 2020-2030 (US$ Mn, AGR%, CAGR%) (Pre COVID & V, U, W, L Recovery Scenarios)
5.3.2 Used in detecting flaws in key components such as the smokestack or funnel, stem, propellers and rubber
5.4 Liquid Penetrant Testing
5.4.1 Global Non-Destructive Testing Market for Liquid Penetrant Testing Revenue Forecast, 2020-2030 (US$ Mn, AGR%, CAGR%) (Pre COVID & V, U, W, L Recovery Scenarios)
5.4.2 Liquid penetrant testing is primarily applicable in the oil & gas, aerospace, and automotive industries
5.5 Eddy Current Testing
5.5.1 Global Non-Destructive Testing Market for Eddy Current Testing Revenue Forecast, 2020-2030 (US$ Mn, AGR%, CAGR%) (Pre COVID & V, U, W, L Recovery Scenarios)
5.5.2 Prime tool for quality control of products, materials, and structures at various stages of manufacturing and in-service inspections.
5.6 Radiographic Testing
5.6.1 Global Non-Destructive Testing Market for Radiographic Testing Revenue Forecast, 2020-2030 (US$ Mn, AGR%, CAGR%) (Pre COVID & V, U, W, L Recovery Scenarios)
5.6.2 Wide range of applications including medicine, engineering, forensics, and security, among others
5.7 Acoustic Emission Testing
5.7.1 Global Non-Destructive Testing Market for Acoustic Emission Testing Revenue Forecast, 2020-2030 (US$ Mn, AGR%, CAGR%) (Pre COVID & V, U, W, L Recovery Scenarios)
5.7.2 Major advantage of AE testing is that it provides adequate loading for propagating defects and triggering acoustic emissions
5.8 Others
5.8.1 Global Non-Destructive Testing Market for Others Revenue Forecast, 2020-2030 (US$ Mn, AGR%, CAGR%) (Pre COVID & V, U, W, L Recovery Scenarios)
6 Global Non-Destructive Testing Market Size Forecast 2020-2030 by End-Users
6.1 Oil and Gas
6.1.1 Global Non-Destructive Testing Market for Oil and Gas Revenue Forecast, 2020-2030 (US$ Mn, AGR%, CAGR%) (Pre COVID & V, U, W, L Recovery Scenarios)
6.1.2 Dominated the global market owing to growing focus on the testing of pipelines, vessels, tanks, and condensers by major companies
6.2 Power Generation
6.2.1 Global Non-Destructive Testing Market for Power Generation Revenue Forecast, 2020-2030 (US$ Mn, AGR%, CAGR%) (Pre COVID & V, U, W, L Recovery Scenarios)
6.2.2 Wind power, solar energy, and nuclear power are some of the lucrative sectors
6.3 Aerospace and Defence
6.3.1 Global Non-Destructive Testing Market for Aerospace and Defence Revenue Forecast, 2020-2030 (US$ Mn, AGR%, CAGR%) (Pre COVID & V, U, W, L Recovery Scenarios)
6.3.2 NDT is the most economical way of conducting inspection tasks during aircraft maintenance
6.4 Automotive
6.4.1 Global Non-Destructive Testing Market for Automotive Revenue Forecast, 2020-2030 (US$ Mn, AGR%, CAGR%) (Pre COVID & V, U, W, L Recovery Scenarios)
6.4.2 Growing production volumes to offer lucrative growth opportunities
6.5 Infrastructure
6.5.1 Global Non-Destructive Testing Market for Infrastructure Revenue Forecast, 2020-2030 (US$ Mn, AGR%, CAGR%) (Pre COVID & V, U, W, L Recovery Scenarios)
6.5.2 Rising infrastructure market across emerging economies
6.6 Manufacturing
6.6.1 Global Non-Destructive Testing Market for Manufacturing Revenue Forecast, 2020-2030 (US$ Mn, AGR%, CAGR%) (Pre COVID & V, U, W, L Recovery Scenarios)
6.6.2 Rising investments by high tech giants across Asia Pacific
6.7 Other End Users
6.7.1 Global Non-Destructive Testing Market for Others Revenue Forecast, 2020-2030 (US$ Mn, AGR%, CAGR%) (Pre COVID & V, U, W, L Recovery Scenarios)
7 Regional and Leading National Non-Destructive Testing Market Forecasts 2020-2030
7.1 Global Non-Destructive Testing Market by National Market Forecast 2020-2030
7.1.1 Global Non-Destructive Testing Market Forecast, 2020-2030 (US$ Mn, AGR%, CAGR%) (Pre COVID & V, U, W, L Recovery Scenarios)
8 North America
8.1 North America Non-Destructive Testing Market by Country Forecast 2020-2030
8.2 North America Non-Destructive Testing Market Forecast by Offering, 2020-2030 (US$ million, AGR%)
8.2.1 North America Non-Destructive Testing Market Forecast by Offering, 2020-2030 (US$ million, AGR%) (Pre COVID & V, U, W, L Recovery Scenarios)
8.3.1 North America Non-Destructive Testing Market Forecast by Technique, 2020-2030 (US$ million, AGR%) (Pre COVID & V, U, W, L Recovery Scenarios)
8.4 North America Non-Destructive Testing Market Forecast by End-Users, 2020-2030 (US$ million, AGR%)
8.5 U.S. Non-Destructive Testing Market Forecast 2020-2030
8.5.1 U.S. Non-Destructive Testing Market Forecast 2020-2030 (Pre COVID & V, U, W, L Recovery Scenarios)
8.5.2 Phenomenal automotive industry growth to offer lucrative growth opportunities
8.5.3 Numerous NDT manufacturers and suppliers
8.5.4 Rising automotive, defence, and oil sector
8.6 Canada Non-Destructive Testing Market Forecast 2020-2030
8.6.1 Canada Non-Destructive Testing Market Forecast 2020-2030 (Pre COVID & V, U, W, L Recovery Scenarios)
8.6.2 Growing aviation industry
8.6.3 Largest supplier of energy, including oil, gas, electric power and uranium to the US
9 Europe
9.1 Europe Non-Destructive Testing Market by Country Forecast 2020-2030
9.2 Europe Non-Destructive Testing Market Forecast by Offering, 2020-2030 (US$ million, AGR%)
9.2.1 Europe Non-Destructive Testing Market Forecast by Offering, 2020-2030 (US$ million, AGR%) (Pre COVID & V, U, W, L Recovery Scenarios)
9.3 Europe Non-Destructive Testing Market Forecast by Technique, 2020-2030 (US$ million, AGR%)
9.3.1 Europe Non-Destructive Testing Market Forecast by Technique, 2020-2030 (US$ million, AGR%) (Pre COVID & V, U, W, L Recovery Scenarios)
9.4 Europe Non-Destructive Testing Market Forecast by End-Users, 2020-2030 (US$ million, AGR%)
9.4.1 Europe Non-Destructive Testing Market Forecast by End-Users, 2020-2030 (US$ million, AGR%) (Pre COVID & V, U, W, L Recovery Scenarios)
9.5 Germany Non-Destructive Testing Market Forecast 2020-2030
9.5.1 Germany Non-Destructive Testing Market Forecast 2020-2030 (Pre COVID & V, U, W, L Recovery Scenarios)
9.5.2 Germany is one of the key members of Europe's economic, political, and defence organizations
9.5.3 Gradual development of the country’s oil & gas and power generation industry
9.6 France Non-Destructive Testing Market Forecast 2020-2030
9.6.1 France Non-Destructive Testing Market Forecast 2020-2030 (Pre COVID & V, U, W, L Recovery Scenarios)
9.6.2 Government holds command of various sectors, predominantly the power, public transport, and defence industries.
9.6.3 Aviation industry to drive NDT growth
9.7 UK Non-Destructive Testing Market Forecast 2020-2030
9.7.1 UK Non-Destructive Testing Market Forecast 2020-2030 (Pre COVID & V, U, W, L Recovery Scenarios)
9.7.2 UK is aggressively moving towards exploiting shell gas as the country has huge unexplored natural gas reserves
9.7.3 Massive investments in power generation and natural fuel exploration to fuel NDT market growth
9.8 Italy Non-Destructive Testing Market Forecast 2020-2030
9.8.1 Italy Non-Destructive Testing Market Forecast 2020-2030 (Pre COVID & V, U, W, L Recovery Scenarios)
9.8.2 Diversified economy, largely driven by the manufacturing industry
9.8.3 Aviation industry is also one of the major users of non-destructive techniques
9.9 Russia Non-Destructive Testing Market Forecast 2020-2030
9.9.1 Russia Non-Destructive Testing Market Forecast 2020-2030 (Pre COVID & V, U, W, L Recovery Scenarios)
9.9.2 Russia is one of the most important players in the energy sector globally
9.10 Rest of Europe Non-Destructive Testing Market Forecast 2020-2030
9.10.1 Rest of Europe Non-Destructive Testing Market Forecast 2020-2030 (Pre COVID & V, U, W, L Recovery Scenarios)
9.10.2 Rest of Europe includes Belgium, Switzerland, Spain, Romania, Poland and among others
10 Asia Pacific
10.1 Asia Pacific Non-Destructive Testing Market by Country Forecast 2020-2030
10.2 Asia Pacific Non-Destructive Testing Market Forecast by Offering, 2020-2030 (US$ million, AGR%)
10.2.1 Asia Pacific Non-Destructive Testing Market Forecast by Offering, 2020-2030 (US$ million, AGR%) (Pre COVID & V, U, W, L Recovery Scenarios)
10.3 Asia Pacific Non-Destructive Testing Market Forecast by Technique, 2020-2030 (US$ million, AGR%)
10.3.1 Asia Pacific Non-Destructive Testing Market Forecast by Technique, 2020-2030 (US$ million, AGR%) (Pre COVID & V, U, W, L Recovery Scenarios)
10.4 Asia Pacific Non-Destructive Testing Market Forecast by End-Users, 2020-2030 (US$ million, AGR%)
10.4.1 Asia Pacific Non-Destructive Testing Market Forecast by End-Users, 2020-2030 (US$ million, AGR%) (Pre COVID & V, U, W, L Recovery Scenarios)
10.5 Japan Non-Destructive Testing Market Forecast 2020-2030
10.5.1 Japan Non-Destructive Testing Market Forecast 2020-2030 (Pre COVID & V, U, W, L Recovery Scenarios)
10.5.2 Japan has been growing steadily in various sectors, including the automobile, agriculture, and power generation industries
10.6 China Non-Destructive Testing Market Forecast 2020-2030
10.6.1 China Non-Destructive Testing Market Forecast 2020-2030 (Pre COVID & V, U, W, L Recovery Scenarios)
10.6.2 Coal is a prominent source of energy in China, the oil and gas industry holds a significant role in China
10.6.3 China holds majority of the market share in Asia Pacific NDT market
10.7 India Non-Destructive Testing Market Forecast 2020-2030
10.7.1 India Non-Destructive Testing Market Forecast 2020-2030 (Pre COVID & V, U, W, L Recovery Scenarios)
10.7.2 Government’s strong focus on building manufacturing sector under Make in India initiative
10.7.3 Rising manufacturing industry owing to high foreign direct investment (FDI)
10.8 Australia Non-Destructive Testing Market Forecast 2020-2030
10.8.1 Australia Non-Destructive Testing Market Forecast 2020-2030 (Pre COVID & V, U, W, L Recovery Scenarios)
10.8.2 Australian companies have developed expertise across drilling technologies, geophysics software, pipeline construction materials etc.
10.9 South Korea Non-Destructive Testing Market Forecast 2020-2030
10.9.1 South Korea Non-Destructive Testing Market Forecast 2020-2030 (Pre COVID & V, U, W, L Recovery Scenarios)
10.9.2 Government incentives towards renewable energy sector
10.10 Rest of Asia Pacific Non-Destructive Testing Market Forecast 2020-2030
10.10.1 Rest of Asia Pacific Non-Destructive Testing Market Forecast 2020-2030 (Pre COVID & V, U, W, L Recovery Scenarios)
10.10.2 Rest of APAC includes Thailand, Malaysia, North Korea, among others
10.10.3 Thailand has the potential to foster the development of the aerospace industry and attract foreign companies
11 Latin America
11.1 Latin America Non-Destructive Testing Market by Country Forecast 2020-2030
11.2 Latin America Non-Destructive Testing Market Forecast by Offering, 2020-2030 (US$ million, AGR%)
11.2.1 Latin America Non-Destructive Testing Market Forecast by Offering, 2020-2030 (US$ million, AGR%) (Pre COVID & V, U, W, L Recovery Scenarios)
11.3 Latin America Non-Destructive Testing Market Forecast by Technique, 2020-2030 (US$ million, AGR%)
11.3.1 Latin America Non-Destructive Testing Market Forecast by Technique, 2020-2030 (US$ million, AGR%) (Pre COVID & V, U, W, L Recovery Scenarios)
11.4 Latin America Non-Destructive Testing Market Forecast by End-Users, 2020-2030 (US$ million, AGR%)
11.4.1 Latin America Non-Destructive Testing Market Forecast by End-Users, 2020-2030 (US$ million, AGR%) (Pre COVID & V, U, W, L Recovery Scenarios)
11.5 Brazil Non-Destructive Testing Market Forecast 2020-2030
11.5.1 Brazil Non-Destructive Testing Market Forecast 2020-2030 (Pre COVID & V, U, W, L Recovery Scenarios)
11.5.2 Oil & gas industry accounts for 13% of the Brazilian GPD and an extremely important economic sector
11.6 Mexico Non-Destructive Testing Market Forecast 2020-2030
11.6.1 Mexico Non-Destructive Testing Market Forecast 2020-2030 (Pre COVID & V, U, W, L Recovery Scenarios)
11.6.2 The growth is driven by Mexico’s demand for efficient and cost-effective electricity
11.7 Rest of Latin America Non-Destructive Testing Market Forecast 2020-2030
11.7.1 Rest of Latin America Non-Destructive Testing Market Forecast 2020-2030 (Pre COVID & V, U, W, L Recovery Scenarios)
12 Middle East and Africa
12.1 Middle East and Africa Non-Destructive Testing Market by Country Forecast 2020-2030
12.2 Middle East and Africa Non-Destructive Testing Market Forecast by Offering, 2020-2030 (US$ million, AGR%)
12.2.1 Middle East and Africa Non-Destructive Testing Market Forecast by Offering, 2020-2030 (US$ million, AGR%) (Pre COVID & V, U, W, L Recovery Scenarios)
12.3 Middle East and Africa Non-Destructive Testing Market Forecast by Technique, 2020-2030 (US$ million, AGR%)
12.3.1 Middle East and Africa Non-Destructive Testing Market Forecast by Technique, 2020-2030 (US$ million, AGR%) (Pre COVID & V, U, W, L Recovery Scenarios)
12.4 Middle East and Africa Non-Destructive Testing Market Forecast by End-Users, 2020-2030 (US$ million, AGR%)
12.4.1 Middle East and Africa Non-Destructive Testing Market Forecast by End-Users, 2020-2030 (US$ million, AGR%) (Pre COVID & V, U, W, L Recovery Scenarios)
12.5 GCC Non-Destructive Testing Market Forecast 2020-2030
12.5.1 GCC Non-Destructive Testing Market Forecast 2020-2030 (Pre COVID & V, U, W, L Recovery Scenarios)
12.5.2 Oil and gas sector in the GCC are expected to receive investments to the tune of US$ 237 billion in the next 10 years
12.5.3 Oil and gas reserves depleting with the power generation industry fueling NDT market growth across Oman
12.5.4 Significant investment in new oil and gas infrastructure projects across Saudi Arabia
12.6 South Africa Non-Destructive Testing Market Forecast 2020-2030
12.6.1 South Africa Non-Destructive Testing Market Forecast 2020-2030 (Pre COVID & V, U, W, L Recovery Scenarios)
12.6.2 South Africa NDT market is expected to witness high revenue growth rates, with significant investments being made in developing new infrastructure
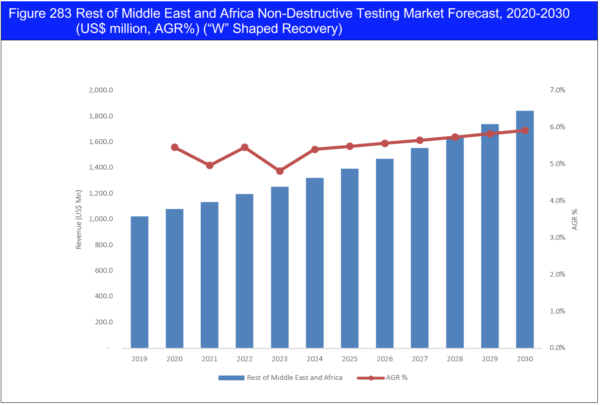
12.7 Rest of Middle East and Africa Non-Destructive Testing Market Forecast 2020-2030
12.7.1 Rest of Middle East and Africa Non-Destructive Testing Market Forecast 2020-2030 (Pre COVID & V, U, W, L Recovery Scenarios)
13 Company Profiling
13.1 Ashtead Technology, Inc.
13.1.1 Ashtead Technology, Inc.: Company Snapshot
13.1.2 Ashtead Technology, Inc.: Company Overview
13.1.3 Ashtead Technology, Inc.: Products
13.1.4 Ashtead Technology, Inc.: Recent Developments
13.2 Bosello High Technology S.R.L.
13.2.1 Bosello High Technology S.R.L.: Company Snapshot
13.2.2 Bosello High Technology S.R.L.: Company Overview
13.2.3 Bosello High Technology S.R.L.: Products
13.3 Fujifilm Holding Corporation
13.3.1 Fujifilm Holding Corporation: Company Snapshot
13.3.2 Fujifilm Holding Corporation: Company Overview
13.3.3 Fujifilm Holding Corporation: Financials
13.3.4 Fujifilm Holding Corporation: Products
13.4 GE Measurement
13.4.1 GE Measurement: Company Snapshot
13.4.2 GE Measurement: Company Overview
13.4.3 GE Measurement: Financials
13.4.4 GE Measurement: SWOT Analysis
13.4.5 GE Measurement: Future Outlook
13.4.6 GE Measurement: Products
13.4.7 GE Measurement: Recent Developments
13.5 Intertek Group PLC
13.5.1 Intertek Group PLC: Company Snapshot
13.5.2 Intertek Group PLC: Company Overview
13.5.3 Intertek Group PLC: Financials
13.5.4 Intertek Group PLC: SWOT Analysis
13.5.5 Intertek Group PLC: Future Outlook
13.5.6 Intertek Group PLC: Products
13.5.7 Intertek Group PLC: Recent Developments
13.6 Magnaflux Corporation
13.6.1 Magnaflux Corporation: Company Snapshot
13.6.2 Magnaflux Corporation: Company Overview
13.6.3 Magnaflux Corporation: Products
13.7 MISTRAS Group
13.7.1 MISTRAS Group: Company Snapshot
13.7.2 MISTRAS Group: Company Overview
13.7.3 MISTRAS Group: Financials
13.7.4 MISTRAS Group: SWOT Analysis
13.7.5 MISTRAS Group: Future Outlook
13.7.6 MISTRAS Group: Products
13.7.7 MISTRAS Group: Recent Developments
13.8 Nikon Metrology
13.8.1 Nikon Metrology: Company Snapshot
13.8.2 Nikon Metrology: Company Overview
13.8.3 Nikon Metrology: Products
13.9 Olympus Corporation
13.9.1 Olympus Corporation: Company Snapshot
13.9.2 Olympus Corporation: Company Overview
13.9.3 Olympus Corporation: Financials
13.9.4 Olympus Corporation: SWOT Analysis
13.9.5 Olympus Corporation: Future Outlook
13.9.6 Olympus Corporation: Products
13.9.7 Olympus Corporation: Recent Developments
13.10 SG SA
13.10.1 SG SA: Company Snapshot
13.10.2 SG SA: Company Overview
13.10.3 SG SA: Financials
13.10.4 SG SA: SWOT Analysis
13.10.5 SG SA: Future Outlook
13.10.6 SG SA: Products
13.11 Sonatest Ltd.
13.11.1 Sonatest Ltd.: Company Snapshot
13.11.2 Sonatest Ltd.: Company Overview
13.11.3 Sonatest Ltd.: Products
13.12 Zetec Inc.
13.12.1 Zetec Inc.: Company Snapshot
13.12.2 Zetec Inc.: Company Overview
13.12.3 Zetec Inc.: Products
13.12.4 Zetec Inc.: Recent Developments
13.13 EDDYFI NDT
13.13.1 EDDYFI NDT: Company Snapshot
13.13.2 EDDYFI NDT: Company Overview
13.13.3 EDDYFI NDT: Recent Developments
13.13.4 EDDYFI NDT: Products
13.13.5 EDDYFI NDT: Recent Developments
13.14 YXLON International
13.14.1 YXLON International: Company Snapshot
13.14.2 YXLON International: Company Overview
13.14.3 YXLON International: Products
13.14.4 YXLON International: Recent Developments
13.15 T.D. Williamson, Inc.
13.15.1 T.D. Williamson, Inc.: Company Snapshot
13.15.2 T.D. Williamson, Inc.: Company Overview
13.15.3 T.D. Williamson, Inc.: Products/Services
13.16 Labquip NDT
13.16.1 Labquip NDT: Company Snapshot
13.16.2 Labquip NDT: Company Overview
13.16.3 Labquip NDT: Products
13.17 FPrimeC Solutions Inc.
13.17.1 FPrimeC Solutions Inc.: Company Snapshot
13.17.2 FPrimeC Solutions Inc.: Company Overview
13.17.3 FPrimeC Solutions Inc.: Product
14 Conclusion
List of Tables
Table 1 Global Non-Destructive Testing Market Snapshot, 2020 & 2030 (US$ million, CAGR %)
Table 2 Key Factors Affecting the Bargaining Power of Suppliers
Table 3 Key Factors Affecting the Industry Rivalry
Table 4 Key Factors Affecting the Threat of New Entrants
Table 5 Key Factors Affecting the Threat of Substitutes
Table 6 Key Factors Affecting the Bargaining Power of Buyer
Table 7 Global Non-Destructive Testing Market Forecast by Offering, 2020-2030 (US$ million, AGR %, CAGR %)
Table 8 Global Non-Destructive Testing Market for NDT Services Segment: Revenue Forecast 2020-2030 (US$ million, AGR%, CAGR%)
Table 9 Global Non-Destructive Testing Market for NDT Services Segment, Revenue Forecast 2020-2030 (US$ million, AGR%, CAGR%) (Pre COVID & V, U, W, L Recovery Scenarios)
Table 10 Global Non-Destructive Testing Market for NDT Services Segment, Revenue Forecast 2020-2030 (US$ million, AGR%, CAGR%) (“U” Shaped Recovery)
Table 11 Global Non-Destructive Testing Market for NDT Services Segment, Revenue Forecast 2020-2030 (US$ million, AGR%, CAGR%) (“W” Shaped Recovery)
Table 12 Global Non-Destructive Testing Market for NDT Services Segment, Revenue Forecast 2020-2030 (US$ million, AGR%, CAGR%) (“L” Shaped Recovery)
Table 13 Global Non-Destructive Testing Market for NDT Equipment Segment: Revenue Forecast 2020-2030 (US$ million, AGR%, CAGR%)
Table 14 Global Non-Destructive Testing Market for NDT Equipment Segment, Revenue Forecast 2020-2030 (US$ million, AGR%, CAGR%) (Pre COVID & V, U, W, L Recovery Scenarios)
Table 15 Global Non-Destructive Testing Market for NDT Equipment Segment, Revenue Forecast 2020-2030 (US$ million, AGR%, CAGR%) (“U” Shaped Recovery)
Table 16 Global Non-Destructive Testing Market for NDT Equipment Segment, Revenue Forecast 2020-2030 (US$ million, AGR%, CAGR%) (“W” Shaped Recovery)
Table 17 Global Non-Destructive Testing Market for NDT Equipment Segment, Revenue Forecast 2020-2030 (US$ million, AGR%, CAGR%) (“L” Shaped Recovery)
Table 18 Global Non-Destructive Testing Market Forecast by Technique, 2020-2030 (US$ million, AGR %, CAGR %)
Table 19 Global Non-Destructive Testing Market for Ultrasonic Testing Segment: Revenue Forecast 2020-2030 (US$ million, AGR%, CAGR%)
Table 20 Global Non-Destructive Testing Market for Ultrasonic Testing Segment, Revenue Forecast 2020-2030 (US$ million, AGR%, CAGR%) (Pre COVID & V, U, W, L Recovery Scenarios)
Table 21 Global Non-Destructive Testing Market for Ultrasonic Testing Segment, Revenue Forecast 2020-2030 (US$ million, AGR%, CAGR%) (“U” Shaped Recovery)
Table 22 Global Non-Destructive Testing Market for Ultrasonic Testing Segment, Revenue Forecast 2020-2030 (US$ million, AGR%, CAGR%) (“W” Shaped Recovery)
Table 23 Global Non-Destructive Testing Market for Ultrasonic Testing Segment, Revenue Forecast 2020-2030 (US$ million, AGR%, CAGR%) (“L” Shaped Recovery)
Table 24 Global Non-Destructive Testing Market for Visual Inspection Testing Segment: Revenue Forecast 2020-2030 (US$ million, AGR%, CAGR%)
Table 25 Global Non-Destructive Testing Market for Visual Inspection Segment, Revenue Forecast 2020-2030 (US$ million, AGR%, CAGR%) (Pre COVID & V, U, W, L Recovery Scenarios)
Table 26 Global Non-Destructive Testing Market for Visual Inspection Testing Segment, Revenue Forecast 2020-2030 (US$ million, AGR%, CAGR%) (“U” Shaped Recovery)
Table 27 Global Non-Destructive Testing Market for Visual Inspection Testing Segment, Revenue Forecast 2020-2030 (US$ million, AGR%, CAGR%) (“W” Shaped Recovery)
Table 28 Global Non-Destructive Testing Market for Visual Inspection Testing Segment, Revenue Forecast 2020-2030 (US$ million, AGR%, CAGR%) (“L” Shaped Recovery)
Table 29 Global Non-Destructive Testing Market for Magnetic Particle Testing Segment: Revenue Forecast 2020-2030 (US$ million, AGR%, CAGR%)
Table 30 Global Non-Destructive Testing Market for Magnetic Particle Segment, Revenue Forecast 2020-2030 (US$ million, AGR%, CAGR%) (Pre COVID & V, U, W, L Recovery Scenarios)
Table 31 Global Non-Destructive Testing Market for Magnetic Particle Testing Segment, Revenue Forecast 2020-2030 (US$ million, AGR%, CAGR%) (“U” Shaped Recovery)
Table 32 Global Non-Destructive Testing Market for Magnetic Particle Testing Segment, Revenue Forecast 2020-2030 (US$ million, AGR%, CAGR%) (“W” Shaped Recovery)
Table 33 Global Non-Destructive Testing Market for Magnetic Particle Testing Segment, Revenue Forecast 2020-2030 (US$ million, AGR%, CAGR%) (“L” Shaped Recovery)
Table 34 Global Non-Destructive Testing Market for Liquid Penetrant Testing Segment: Revenue Forecast 2020-2030 (US$ million, AGR%, CAGR%)
Table 35 Global Non-Destructive Testing Market for Liquid Penetrant Testing Segment, Revenue Forecast 2020-2030 (US$ million, AGR%, CAGR%) (Pre COVID & V, U, W, L Recovery Scenarios)
Table 36 Global Non-Destructive Testing Market for Liquid Penetrant Testing Segment, Revenue Forecast 2020-2030 (US$ million, AGR%, CAGR%) (“U” Shaped Recovery)
Table 37 Global Non-Destructive Testing Market for Liquid Penetrant Testing Segment, Revenue Forecast 2020-2030 (US$ million, AGR%, CAGR%) (“W” Shaped Recovery)
Table 38 Global Non-Destructive Testing Market for Liquid Penetrant Testing Segment, Revenue Forecast 2020-2030 (US$ million, AGR%, CAGR%) (“L” Shaped Recovery)
Table 39 Global Non-Destructive Testing Market for Eddy Current Testing Segment: Revenue Forecast 2020-2030 (US$ million, AGR%, CAGR%)
Table 40 Global Non-Destructive Testing Market for Eddy Current Testing Segment, Revenue Forecast 2020-2030 (US$ million, AGR%, CAGR%) (Pre COVID & V, U, W, L Recovery Scenarios)
Table 41 Global Non-Destructive Testing Market for Eddy Current Testing Segment, Revenue Forecast 2020-2030 (US$ million, AGR%, CAGR%) (“U” Shaped Recovery)
Table 42 Global Non-Destructive Testing Market for Eddy Current Testing Segment, Revenue Forecast 2020-2030 (US$ million, AGR%, CAGR%) (“W” Shaped Recovery)
Table 43 Global Non-Destructive Testing Market for Eddy Current Testing Segment, Revenue Forecast 2020-2030 (US$ million, AGR%, CAGR%) (“L” Shaped Recovery)
Table 44 Global Non-Destructive Testing Market for Radiographic Testing Segment: Revenue Forecast 2020-2030 (US$ million, AGR%, CAGR%)
Table 45 Global Non-Destructive Testing Market for Radiographic Testing Segment, Revenue Forecast 2020-2030 (US$ million, AGR%, CAGR%) (Pre COVID & V, U, W, L Recovery Scenarios)
Table 46 Global Non-Destructive Testing Market for Radiographic Testing Segment, Revenue Forecast 2020-2030 (US$ million, AGR%, CAGR%) (“U” Shaped Recovery)
Table 47 Global Non-Destructive Testing Market for Radiographic Testing Segment, Revenue Forecast 2020-2030 (US$ million, AGR%, CAGR%) (“W” Shaped Recovery)
Table 48 Global Non-Destructive Testing Market for Radiographic Testing Segment, Revenue Forecast 2020-2030 (US$ million, AGR%, CAGR%) (“L” Shaped Recovery)
Table 49 Global Non-Destructive Testing Market for Acoustic Emission Testing Segment: Revenue Forecast 2020-2030 (US$ million, AGR%, CAGR%)
Table 50 Global Non-Destructive Testing Market for Acoustic Emission Testing Segment, Revenue Forecast 2020-2030 (US$ million, AGR%, CAGR%) (Pre COVID & V, U, W, L Recovery Scenarios)
Table 51 Global Non-Destructive Testing Market for Acoustic Emission Testing Segment, Revenue Forecast 2020-2030 (US$ million, AGR%, CAGR%) (“U” Shaped Recovery)
Table 52 Global Non-Destructive Testing Market for Acoustic Emission Testing Segment, Revenue Forecast 2020-2030 (US$ million, AGR%, CAGR%) (“W” Shaped Recovery)
Table 53 Global Non-Destructive Testing Market for Acoustic Emission Testing Segment, Revenue Forecast 2020-2030 (US$ million, AGR%, CAGR%) (“L” Shaped Recovery)
Table 54 Global Non-Destructive Testing Market for Others Segment: Revenue Forecast 2020-2030 (US$ million, AGR%, CAGR%)
Table 55 Global Non-Destructive Testing Market for Others Segment, Revenue Forecast 2020-2030 (US$ million, AGR%, CAGR%) (Pre COVID & V, U, W, L Recovery Scenarios)
Table 56 Global Non-Destructive Testing Market for Others Segment, Revenue Forecast 2020-2030 (US$ million, AGR%, CAGR%) (“U” Shaped Recovery)
Table 57 Global Non-Destructive Testing Market for Others Segment, Revenue Forecast 2020-2030 (US$ million, AGR%, CAGR%) (“W” Shaped Recovery)
Table 58 Global Non-Destructive Testing Market for Others Segment, Revenue Forecast 2020-2030 (US$ million, AGR%, CAGR%) (“L” Shaped Recovery)
Table 59 Global Non-Destructive Testing Market Forecast by End-Users, 2020-2030 (US$ million, AGR %, CAGR %)
Table 60 Global Non-Destructive Testing Market for Oil and Gas Segment: Revenue Forecast 2020-2030 (US$ million, AGR%, CAGR%)
Table 61 Global Non-Destructive Testing Market for Oil and Gas Segment, Revenue Forecast 2020-2030 (US$ million, AGR%, CAGR%) (Pre COVID & V, U, W, L Recovery Scenarios)
Table 62 Global Non-Destructive Testing Market for Oil and Gas Segment, Revenue Forecast 2020-2030 (US$ million, AGR%, CAGR%) (“U” Shaped Recovery)
Table 63 Global Non-Destructive Testing Market for Oil and Gas Segment, Revenue Forecast 2020-2030 (US$ million, AGR%, CAGR%) (“W” Shaped Recovery)
Table 64 Global Non-Destructive Testing Market for Oil and Gas Segment, Revenue Forecast 2020-2030 (US$ million, AGR%, CAGR%) (“L” Shaped Recovery)
Table 65 Global Non-Destructive Testing Market for Power Generation Segment: Revenue Forecast 2020-2030 (US$ million, AGR%, CAGR%)
Table 66 Global Non-Destructive Testing Market for Power Generation Segment, Revenue Forecast 2020-2030 (US$ million, AGR%, CAGR%) (Pre COVID & V, U, W, L Recovery Scenarios)
Table 67 Global Non-Destructive Testing Market for Power Generation Segment, Revenue Forecast 2020-2030 (US$ million, AGR%, CAGR%) (“U” Shaped Recovery)
Table 68 Global Non-Destructive Testing Market for Power Generation Segment, Revenue Forecast 2020-2030 (US$ million, AGR%, CAGR%) (“W” Shaped Recovery)
Table 69 Global Non-Destructive Testing Market for Power Generation Segment, Revenue Forecast 2020-2030 (US$ million, AGR%, CAGR%) (“L” Shaped Recovery)
Table 70 Global Non-Destructive Testing Market for Aerospace and Defence Segment: Revenue Forecast 2020-2030 (US$ million, AGR%, CAGR%)
Table 71 Global Non-Destructive Testing Market for Oil and Gas Segment, Revenue Forecast 2020-2030 (US$ million, AGR%, CAGR%) (Pre COVID & V, U, W, L Recovery Scenarios)
Table 72 Global Non-Destructive Testing Market for Aerospace and Defence Segment, Revenue Forecast 2020-2030 (US$ million, AGR%, CAGR%) (“U” Shaped Recovery)
Table 73 Global Non-Destructive Testing Market for Aerospace and Defence Segment, Revenue Forecast 2020-2030 (US$ million, AGR%, CAGR%) (“W” Shaped Recovery)
Table 74 Global Non-Destructive Testing Market for Aerospace and Defence Segment, Revenue Forecast 2020-2030 (US$ million, AGR%, CAGR%) (“L” Shaped Recovery)
Table 75 Global Non-Destructive Testing Market for Automotive Segment: Revenue Forecast 2020-2030 (US$ million, AGR%, CAGR%)
Table 76 Global Non-Destructive Testing Market for Oil and Gas Segment, Revenue Forecast 2020-2030 (US$ million, AGR%, CAGR%) (Pre COVID & V, U, W, L Recovery Scenarios)
Table 77 Global Non-Destructive Testing Market for Automotive Segment, Revenue Forecast 2020-2030 (US$ million, AGR%, CAGR%) (“U” Shaped Recovery)
Table 78 Global Non-Destructive Testing Market for Automotive Segment, Revenue Forecast 2020-2030 (US$ million, AGR%, CAGR%) (“W” Shaped Recovery)
Table 79 Global Non-Destructive Testing Market for Automotive Segment, Revenue Forecast 2020-2030 (US$ million, AGR%, CAGR%) (“L” Shaped Recovery)
Table 80 Global Non-Destructive Testing Market for Infrastructure Segment: Revenue Forecast 2020-2030 (US$ million, AGR%, CAGR%)
Table 81 Global Non-Destructive Testing Market for Oil and Gas Segment, Revenue Forecast 2020-2030 (US$ million, AGR%, CAGR%) (Pre COVID & V, U, W, L Recovery Scenarios)
Table 82 Global Non-Destructive Testing Market for Infrastructure Segment, Revenue Forecast 2020-2030 (US$ million, AGR%, CAGR%) (“U” Shaped Recovery)
Table 83 Global Non-Destructive Testing Market for Infrastructure Segment, Revenue Forecast 2020-2030 (US$ million, AGR%, CAGR%) (“W” Shaped Recovery)
Table 84 Global Non-Destructive Testing Market for Infrastructure Segment, Revenue Forecast 2020-2030 (US$ million, AGR%, CAGR%) (“L” Shaped Recovery)
Table 85 Global Non-Destructive Testing Market for Manufacturing Segment: Revenue Forecast 2020-2030 (US$ million, AGR%, CAGR%)
Table 86 Global Non-Destructive Testing Market for Manufacturing Segment, Revenue Forecast 2020-2030 (US$ million, AGR%, CAGR%) (Pre COVID & V, U, W, L Recovery Scenarios)
Table 87 Global Non-Destructive Testing Market for Manufacturing Segment, Revenue Forecast 2020-2030 (US$ million, AGR%, CAGR%) (“U” Shaped Recovery)
Table 88 Global Non-Destructive Testing Market for Manufacturing Segment, Revenue Forecast 2020-2030 (US$ million, AGR%, CAGR%) (“W” Shaped Recovery)
Table 89 Global Non-Destructive Testing Market for Manufacturing Segment, Revenue Forecast 2020-2030 (US$ million, AGR%, CAGR%) (“L Shaped Recovery)
Table 90 Global Non-Destructive Testing Market for Others Segment: Revenue Forecast 2020-2030 (US$ million, AGR%, CAGR%)
Table 91 Global Non-Destructive Testing Market for Others Segment, Revenue Forecast 2020-2030 (US$ million, AGR%, CAGR%) (Pre COVID & V, U, W, L Recovery Scenarios)
Table 92 Global Non-Destructive Testing Market for Others Segment, Revenue Forecast 2020-2030 (US$ million, AGR%, CAGR%) (“U” Shaped Recovery)
Table 93 Global Non-Destructive Testing Market for Others Segment, Revenue Forecast 2020-2030 (US$ million, AGR%, CAGR%) (“W” Shaped Recovery)
Table 94 Global Non-Destructive Testing Market for Others Segment, Revenue Forecast 2020-2030 (US$ million, AGR%, CAGR%) (“L” Shaped Recovery)
Table 95 Global Non-Destructive Testing Market Forecast by Region, 2020-2030 (US$ million, AGR %)
Table 96 Global Non-Destructive Testing Market Forecast by Region, 2020-2030 (US$ million, AGR %) (Pre COVID & V, U, W, L Recovery Scenarios)
Table 97 Global Non-Destructive Testing Market Forecast by Region, 2020-2030 (US$ million, AGR %) (“U” Shaped Recovery)
Table 98 Global Non-Destructive Testing Market Forecast by Region, 2020-2030 (US$ million, AGR %) (“W” Shaped Recovery)
Table 99 Global Non-Destructive Testing Market Forecast by Region, 2020-2030 (US$ million, AGR %) (“L” Shaped Recovery)
Table 100 North America Non-Destructive Testing Market Forecast by Country, 2020-2030 (US$ million, CAGR%, AGR %)
Table 101 North America Non-Destructive Testing Market Forecast by Offering, 2020-2030 (US$ million, AGR %, CAGR%)
Table 102 North America Non-Destructive Testing Market Forecast by Offering, 2020-2030 (US$ million, AGR %, CAGR%) (Pre COVID & V, U, W, L Recovery Scenarios)
Table 103 North America Non-Destructive Testing Market Forecast by Offering, 2020-2030 (US$ million, AGR %, CAGR%) (“U” Shaped Recovery)
Table 104 North America Non-Destructive Testing Market Forecast by Offering, 2020-2030 (US$ million, AGR %, CAGR%) (“W” Shaped Recovery)
Table 105 North America Non-Destructive Testing Market Forecast by Offering, 2020-2030 (US$ million, AGR %, CAGR%) (“L” Shaped Recovery)
Table 106 North America Non-Destructive Testing Market Forecast by Technique, 2020-2030 (US$ million, AGR %, CAGR%)
Table 107 North America Non-Destructive Testing Market Forecast by Technique, 2020-2030 (US$ million, AGR %, CAGR%) (Pre COVID & V, U, W, L Recovery Scenarios)
Table 108 North America Non-Destructive Testing Market Forecast by Technique, 2020-2030 (US$ million, AGR %, CAGR%) (“U” Shaped Recovery)
Table 109 North America Non-Destructive Testing Market Forecast by Technique, 2020-2030 (US$ million, AGR %, CAGR%) (“W” Shaped Recovery)
Table 110 North America Non-Destructive Testing Market Forecast by Technique, 2020-2030 (US$ million, AGR %, CAGR%) (“L” Shaped Recovery)
Table 111 North America Non-Destructive Testing Market Forecast by End-Users, 2020-2030 (US$ million, AGR %, CAGR%)
Table 112 North America Non-Destructive Testing Market Forecast by End-Users, 2020-2030 (US$ million, AGR %, CAGR%) (Pre COVID & V, U, W, L Recovery Scenarios)
Table 113 North America Non-Destructive Testing Market Forecast by End-Users, 2020-2030 (US$ million, AGR %, CAGR%) (“U” Shaped Recovery)
Table 114 North America Non-Destructive Testing Market Forecast by End-Users, 2020-2030 (US$ million, AGR %, CAGR%) (“W” Shaped Recovery)
Table 115 North America Non-Destructive Testing Market Forecast by End-Users, 2020-2030 (US$ million, AGR %, CAGR%) (“L” Shaped Recovery)
Table 116 U.S. Non-Destructive Testing Market Forecast 2020-2030 (US$ million, AGR %, CAGR %)
Table 117 U.S. Non-Destructive Testing Market Forecast, 2020-2030 (Pre COVID & V, U, W, L Recovery Scenarios)
Table 118 U.S. Non-Destructive Testing Market Forecast, 2020-2030 (“U” Shaped Recovery)
Table 119 U.S. Non-Destructive Testing Market Forecast, 2020-2030 (“W” Shaped Recovery)
Table 120 U.S. Non-Destructive Testing Market Forecast, 2020-2030 (“L” Shaped Recovery)
Table 121 Canada Non-Destructive Testing Market Forecast 2020-2030 (US$ million, AGR %, CAGR %)
Table 122 Canada Non-Destructive Testing Market Forecast, 2020-2030 (Pre COVID & V, U, W, L Recovery Scenarios)
Table 123 Canada Non-Destructive Testing Market Forecast, 2020-2030 (“U” Shaped Recovery)
Table 124 Canada Non-Destructive Testing Market Forecast, 2020-2030 (“W” Shaped Recovery)
Table 125 Canada Non-Destructive Testing Market Forecast, 2020-2030 (“L” Shaped Recovery)
Table 126 Europe Non-Destructive Testing Market Forecast by Country, 2020-2030 (US$ million, CAGR%, AGR %)
Table 127 Europe Non-Destructive Testing Market Forecast by Offering, 2020-2030 (US$ million, AGR %, CAGR%)
Table 128 Europe Non-Destructive Testing Market Forecast by Offering, 2020-2030 (US$ million, AGR %, CAGR%) (Pre COVID & V, U, W, L Recovery Scenarios)
Table 129 Europe Non-Destructive Testing Market Forecast by Offering, 2020-2030 (US$ million, AGR %, CAGR%) (“U” Shaped Recovery)
Table 130 Europe Non-Destructive Testing Market Forecast by Offering, 2020-2030 (US$ million, AGR %, CAGR%) (“W” Shaped Recovery)
Table 131 Europe Non-Destructive Testing Market Forecast by Offering, 2020-2030 (US$ million, AGR %, CAGR%) (“L” Shaped Recovery)
Table 132 Europe Non-Destructive Testing Market Forecast by Technique, 2020-2030 (US$ million, AGR %, CAGR%)
Table 133 Europe Non-Destructive Testing Market Forecast by Technique, 2020-2030 (US$ million, AGR %, CAGR%) (Pre COVID & V, U, W, L Recovery Scenarios)
Table 134 Europe Non-Destructive Testing Market Forecast by Technique, 2020-2030 (US$ million, AGR %, CAGR%) (“U” Shaped Recovery)
Table 135 Europe Non-Destructive Testing Market Forecast by Technique, 2020-2030 (US$ million, AGR %, CAGR%) (“W” Shaped Recovery)
Table 136 Europe Non-Destructive Testing Market Forecast by Technique, 2020-2030 (US$ million, AGR %, CAGR%) (“L” Shaped Recovery)
Table 137 Europe Non-Destructive Testing Market Forecast by End-Users, 2020-2030 (US$ million, AGR %, CAGR%)
Table 138 Europe Non-Destructive Testing Market Forecast by End-Users, 2020-2030 (US$ million, AGR %, CAGR%) (Pre COVID & V, U, W, L Recovery Scenarios)
Table 139 Europe Non-Destructive Testing Market Forecast by End-Users, 2020-2030 (US$ million, AGR %, CAGR%) (“U” Shaped Recovery)
Table 140 Europe Non-Destructive Testing Market Forecast by End-Users, 2020-2030 (US$ million, AGR %, CAGR%) (“W” Shaped Recovery)
Table 141 Europe Non-Destructive Testing Market Forecast by End-Users, 2020-2030 (US$ million, AGR %, CAGR%) (“L” Shaped Recovery)
Table 142 Germany Non-Destructive Testing Market Forecast 2020-2030 (US$ million, AGR %, CAGR %)
Table 143 Germany Non-Destructive Testing Market Forecast, 2020-2030 (Pre COVID & V, U, W, L Recovery Scenarios)
Table 144 Germany Non-Destructive Testing Market Forecast, 2020-2030 (“U” Shaped Recovery)
Table 145 Germany Non-Destructive Testing Market Forecast, 2020-2030 (“W” Shaped Recovery)
Table 146 Germany Non-Destructive Testing Market Forecast, 2020-2030 (“L” Shaped Recovery)
Table 147 France Non-Destructive Testing Market Forecast 2020-2030 (US$ million, AGR %, CAGR %)
Table 148 France Non-Destructive Testing Market Forecast, 2020-2030 (Pre COVID & V, U, W, L Recovery Scenarios)
Table 149 France Non-Destructive Testing Market Forecast, 2020-2030 (“U” Shaped Recovery)
Table 150 France Non-Destructive Testing Market Forecast, 2020-2030 (“W” Shaped Recovery)
Table 151 France Non-Destructive Testing Market Forecast, 2020-2030 (“L” Shaped Recovery)
Table 152 UK Non-Destructive Testing Market Forecast 2020-2030 (US$ million, AGR %, CAGR %)
Table 153 UK Non-Destructive Testing Market Forecast, 2020-2030 (Pre COVID & V, U, W, L Recovery Scenarios)
Table 154 UK Non-Destructive Testing Market Forecast, 2020-2030 (“U” Shaped Recovery)
Table 155 UK Non-Destructive Testing Market Forecast, 2020-2030 (“W” Shaped Recovery)
Table 156 UK Non-Destructive Testing Market Forecast, 2020-2030 (“L” Shaped Recovery)
Table 157 Italy Non-Destructive Testing Market Forecast 2020-2030 (US$ million, AGR %, CAGR %)
Table 158 Italy Non-Destructive Testing Market Forecast, 2020-2030 (Pre COVID & V, U, W, L Recovery Scenarios)
Table 159 Italy Non-Destructive Testing Market Forecast, 2020-2030 (“U” Shaped Recovery)
Table 160 Italy Non-Destructive Testing Market Forecast, 2020-2030 (“W” Shaped Recovery)
Table 161 Italy Non-Destructive Testing Market Forecast, 2020-2030 (“L” Shaped Recovery)
Table 162 Russia Non-Destructive Testing Market Forecast 2020-2030 (US$ million, AGR %, CAGR %)
Table 163 Russia Non-Destructive Testing Market Forecast, 2020-2030 (Pre COVID & V, U, W, L Recovery Scenarios)
Table 164 Russia Non-Destructive Testing Market Forecast, 2020-2030 (“U” Shaped Recovery)
Table 165 Russia Non-Destructive Testing Market Forecast, 2020-2030 (“W” Shaped Recovery)
Table 166 Russia Non-Destructive Testing Market Forecast, 2020-2030 (“L” Shaped Recovery)
Table 167 Rest of Europe Non-Destructive Testing Market Forecast 2020-2030 (US$ million, AGR %, CAGR %)
Table 168 Rest of Europe Non-Destructive Testing Market Forecast, 2020-2030 (Pre COVID & V, U, W, L Recovery Scenarios)
Table 169 Rest of Europe Non-Destructive Testing Market Forecast, 2020-2030 (“U” Shaped Recovery)
Table 170 Rest of Europe Non-Destructive Testing Market Forecast, 2020-2030 (“W” Shaped Recovery)
Table 171 Rest of Europe Non-Destructive Testing Market Forecast, 2020-2030 (“L” Shaped Recovery)
Table 172 Asia Pacific Non-Destructive Testing Market Forecast by Country, 2020-2030 (US$ million, CAGR%, AGR %)
Table 173 Asia Pacific Non-Destructive Testing Market Forecast by Offering, 2020-2030 (US$ million, AGR %, CAGR%)
Table 174 Asia Pacific Non-Destructive Testing Market Forecast by Offering, 2020-2030 (US$ million, AGR %, CAGR%) (Pre COVID & V, U, W, L Recovery Scenarios)
Table 175 Asia Pacific Non-Destructive Testing Market Forecast by Offering, 2020-2030 (US$ million, AGR %, CAGR%) (“U” Shaped Recovery)
Table 176 Asia Pacific Non-Destructive Testing Market Forecast by Offering, 2020-2030 (US$ million, AGR %, CAGR%) (“W” Shaped Recovery)
Table 177 Asia Pacific Non-Destructive Testing Market Forecast by Offering, 2020-2030 (US$ million, AGR %, CAGR%) (“L” Shaped Recovery)
Table 178 Asia Pacific Non-Destructive Testing Market Forecast by Technique, 2020-2030 (US$ million, AGR %, CAGR%)
Table 179 Asia Pacific Non-Destructive Testing Market Forecast by Technique, 2020-2030 (US$ million, AGR %, CAGR%) (Pre COVID & V, U, W, L Recovery Scenarios)
Table 180 Asia Pacific Non-Destructive Testing Market Forecast by Technique, 2020-2030 (US$ million, AGR %, CAGR%) (“U” Shaped Recovery)
Table 181 Asia Pacific Non-Destructive Testing Market Forecast by Technique, 2020-2030 (US$ million, AGR %, CAGR%) (“W” Shaped Recovery)
Table 182 Asia Pacific Non-Destructive Testing Market Forecast by Technique, 2020-2030 (US$ million, AGR %, CAGR%) (“L” Shaped Recovery)
Table 183 Asia Pacific Non-Destructive Testing Market Forecast by End-Users, 2020-2030 (US$ million, AGR %, CAGR%)
Table 184 Asia Pacific Non-Destructive Testing Market Forecast by End-Users, 2020-2030 (US$ million, AGR %, CAGR%) (Pre COVID & V, U, W, L Recovery Scenarios)
Table 185 Asia Pacific Non-Destructive Testing Market Forecast by End-Users, 2020-2030 (US$ million, AGR %, CAGR%) (“U” Shaped Recovery)
Table 186 Asia Pacific Non-Destructive Testing Market Forecast by End-Users, 2020-2030 (US$ million, AGR %, CAGR%) (“W” Shaped Recovery)
Table 187 Asia Pacific Non-Destructive Testing Market Forecast by End-Users, 2020-2030 (US$ million, AGR %, CAGR%) (“L” Shaped Recovery)
Table 188 Japan Non-Destructive Testing Market Forecast 2020-2030 (US$ million, AGR %, CAGR %)
Table 189 Japan Non-Destructive Testing Market Forecast, 2020-2030 (Pre COVID & V, U, W, L Recovery Scenarios)
Table 190 Japan Non-Destructive Testing Market Forecast, 2020-2030 (“U” Shaped Recovery)
Table 191 Japan Non-Destructive Testing Market Forecast, 2020-2030 (“W” Shaped Recovery)
Table 192 Japan Non-Destructive Testing Market Forecast, 2020-2030 (“L” Shaped Recovery)
Table 193 China Non-Destructive Testing Market Forecast 2020-2030 (US$ million, AGR %, CAGR %)
Table 194 China Non-Destructive Testing Market Forecast, 2020-2030 (Pre COVID & V, U, W, L Recovery Scenarios)
Table 195 China Non-Destructive Testing Market Forecast, 2020-2030 (“U” Shaped Recovery)
Table 196 China Non-Destructive Testing Market Forecast, 2020-2030 (“W” Shaped Recovery)
Table 197 China Non-Destructive Testing Market Forecast, 2020-2030 (“L” Shaped Recovery)
Table 198 India Non-Destructive Testing Market Forecast 2020-2030 (US$ million, AGR %, CAGR %)
Table 199 India Non-Destructive Testing Market Forecast, 2020-2030 (Pre COVID & V, U, W, L Recovery Scenarios)
Table 200 India Non-Destructive Testing Market Forecast, 2020-2030 (“U” Shaped Recovery)
Table 201 India Non-Destructive Testing Market Forecast, 2020-2030 (“W” Shaped Recovery)
Table 202 India Non-Destructive Testing Market Forecast, 2020-2030 (“L” Shaped Recovery)
Table 203 Australia Non-Destructive Testing Market Forecast 2020-2030 (US$ million, AGR %, CAGR %)
Table 204 Australia Non-Destructive Testing Market Forecast, 2020-2030 (Pre COVID & V, U, W, L Recovery Scenarios)
Table 205 Australia Non-Destructive Testing Market Forecast, 2020-2030 (“U” Shaped Recovery)
Table 206 Australia Non-Destructive Testing Market Forecast, 2020-2030 (“W” Shaped Recovery)
Table 207 Australia Non-Destructive Testing Market Forecast, 2020-2030 (“L” Shaped Recovery)
Table 208 South Korea Non-Destructive Testing Market Forecast 2020-2030 (US$ million, AGR %, CAGR %)
Table 209 South Korea Non-Destructive Testing Market Forecast, 2020-2030 (Pre COVID & V, U, W, L Recovery Scenarios)
Table 210 South Korea Non-Destructive Testing Market Forecast, 2020-2030 (“U” Shaped Recovery)
Table 211 South Korea Non-Destructive Testing Market Forecast, 2020-2030 (“W” Shaped Recovery)
Table 212 South Korea Non-Destructive Testing Market Forecast, 2020-2030 (“L” Shaped Recovery)
Table 213 Rest of Asia Pacific Non-Destructive Testing Market Forecast 2020-2030 (US$ million, AGR %, CAGR %)
Table 214 Rest of Asia Pacific Non-Destructive Testing Market Forecast, 2020-2030 (Pre COVID & V, U, W, L Recovery Scenarios)
Table 215 Rest of Asia Pacific Non-Destructive Testing Market Forecast, 2020-2030 (“U” Shaped Recovery)
Table 216 Rest of Asia Pacific Non-Destructive Testing Market Forecast, 2020-2030 (“W” Shaped Recovery)
Table 217 Rest of Asia Pacific Non-Destructive Testing Market Forecast, 2020-2030 (“L” Shaped Recovery)
Table 218 Latin America Non-Destructive Testing Market Forecast by Country, 2020-2030 (US$ million, CAGR%, AGR %)
Table 219 Latin America Non-Destructive Testing Market Forecast by Offering, 2020-2030 (US$ million, AGR %, CAGR%)
Table 220 Latin America Non-Destructive Testing Market Forecast by Offering, 2020-2030 (US$ million, AGR %, CAGR%) (Pre COVID & V, U, W, L Recovery Scenarios)
Table 221 Latin America Non-Destructive Testing Market Forecast by Offering, 2020-2030 (US$ million, AGR %, CAGR%) (“U” Shaped Recovery)
Table 222 Latin America Non-Destructive Testing Market Forecast by Offering, 2020-2030 (US$ million, AGR %, CAGR%) (“W” Shaped Recovery)
Table 223 Latin America Non-Destructive Testing Market Forecast by Offering, 2020-2030 (US$ million, AGR %, CAGR%) (“L” Shaped Recovery)
Table 224 Latin America Non-Destructive Testing Market Forecast by Technique, 2020-2030 (US$ million, AGR %, CAGR%)
Table 225 Latin America Non-Destructive Testing Market Forecast by Technique, 2020-2030 (US$ million, AGR %, CAGR%) (Pre COVID & V, U, W, L Recovery Scenarios)
Table 226 Latin America Non-Destructive Testing Market Forecast by Technique, 2020-2030 (US$ million, AGR %, CAGR%) (“U” Shaped Recovery)
Table 227 Latin America Non-Destructive Testing Market Forecast by Technique, 2020-2030 (US$ million, AGR %, CAGR%) (“W” Shaped Recovery)
Table 228 Latin America Non-Destructive Testing Market Forecast by Technique, 2020-2030 (US$ million, AGR %, CAGR%) (“L” Shaped Recovery)
Table 229 Latin America Non-Destructive Testing Market Forecast by End-Users, 2020-2030 (US$ million, AGR %, CAGR%)
Table 230 Latin America Non-Destructive Testing Market Forecast by End-Users, 2020-2030 (US$ million, AGR %, CAGR%) (Pre COVID & V, U, W, L Recovery Scenarios)
Table 231 Latin America Non-Destructive Testing Market Forecast by End-Users, 2020-2030 (US$ million, AGR %, CAGR%) (“U” Shaped Recovery)
Table 232 Latin America Non-Destructive Testing Market Forecast by End-Users, 2020-2030 (US$ million, AGR %, CAGR%) (“W” Shaped Recovery)
Table 233 Latin America Non-Destructive Testing Market Forecast by End-Users, 2020-2030 (US$ million, AGR %, CAGR%) (“L” Shaped Recovery)
Table 234 Brazil Non-Destructive Testing Market Forecast 2020-2030 (US$ million, AGR %, CAGR %)
Table 235 Brazil Non-Destructive Testing Market Forecast, 2020-2030 (Pre COVID & V, U, W, L Recovery Scenarios)
Table 236 Brazil Non-Destructive Testing Market Forecast, 2020-2030 (“U” Shaped Recovery)
Table 237 Brazil Non-Destructive Testing Market Forecast, 2020-2030 (“W” Shaped Recovery)
Table 238 Brazil Non-Destructive Testing Market Forecast, 2020-2030 (“L” Shaped Recovery)
Table 239 Mexico Non-Destructive Testing Market Forecast 2020-2030 (US$ million, AGR %, CAGR %)
Table 240 Mexico Non-Destructive Testing Market Forecast, 2020-2030 (Pre COVID & V, U, W, L Recovery Scenarios)
Table 241 Mexico Non-Destructive Testing Market Forecast, 2020-2030 (“U” Shaped Recovery)
Table 242 Mexico Non-Destructive Testing Market Forecast, 2020-2030 (“W” Shaped Recovery)
Table 243 Mexico Non-Destructive Testing Market Forecast, 2020-2030 (“L” Shaped Recovery)
Table 244 Rest of Latin America Non-Destructive Testing Market Forecast 2020-2030 (US$ million, AGR %, CAGR %)
Table 245 Rest of Latin America Non-Destructive Testing Market Forecast, 2020-2030 (Pre COVID & V, U, W, L Recovery Scenarios)
Table 246 Rest of Latin America Non-Destructive Testing Market Forecast, 2020-2030 (“U” Shaped Recovery)
Table 247 Rest of Latin America Non-Destructive Testing Market Forecast, 2020-2030 (“W” Shaped Recovery)
Table 248 Rest of Latin America Non-Destructive Testing Market Forecast, 2020-2030 (“L” Shaped Recovery)
Table 249 Middle East and Africa Non-Destructive Testing Market Forecast by Country, 2020-2030 (US$ million, CAGR%, AGR %)
Table 250 Middle East and Africa Non-Destructive Testing Market Forecast by Offering, 2020-2030 (US$ million, AGR %, CAGR%)
Table 251 Middle East and Africa Non-Destructive Testing Market Forecast by Offering, 2020-2030 (US$ million, AGR %, CAGR%) (Pre COVID & V, U, W, L Recovery Scenarios)
Table 252 Middle East and Africa Non-Destructive Testing Market Forecast by Offering, 2020-2030 (US$ million, AGR %, CAGR%) (“U” Shaped Recovery)
Table 253 Middle East and Africa Non-Destructive Testing Market Forecast by Offering, 2020-2030 (US$ million, AGR %, CAGR%) (“W” Shaped Recovery)
Table 254 Middle East and Africa Non-Destructive Testing Market Forecast by Offering, 2020-2030 (US$ million, AGR %, CAGR%) (“L” Shaped Recovery)
Table 255 Middle East and Africa Non-Destructive Testing Market Forecast by Technique, 2020-2030 (US$ million, AGR %, CAGR%)
Table 256 Middle East and Africa Non-Destructive Testing Market Forecast by Technique, 2020-2030 (US$ million, AGR %, CAGR%) (Pre COVID & V, U, W, L Recovery Scenarios)
Table 257 Middle East and Africa Non-Destructive Testing Market Forecast by Technique, 2020-2030 (US$ million, AGR %, CAGR%) (“U” Shaped Recovery)
Table 258 Middle East and Africa Non-Destructive Testing Market Forecast by Technique, 2020-2030 (US$ million, AGR %, CAGR%) (“W” Shaped Recovery)
Table 259 Middle East and Africa Non-Destructive Testing Market Forecast by Technique, 2020-2030 (US$ million, AGR %, CAGR%) (“L” Shaped Recovery)
Table 260 Middle East and Africa Non-Destructive Testing Market Forecast by End-Users, 2020-2030 (US$ million, AGR %, CAGR%)
Table 261 Middle East and Africa Non-Destructive Testing Market Forecast by End-Users, 2020-2030 (US$ million, AGR %, CAGR%) (Pre COVID & V, U, W, L Recovery Scenarios)
Table 262 Middle East and Africa Non-Destructive Testing Market Forecast by End-Users, 2020-2030 (US$ million, AGR %, CAGR%) (“U” Shaped Recovery)
Table 263 Middle East and Africa Non-Destructive Testing Market Forecast by End-Users, 2020-2030 (US$ million, AGR %, CAGR%) (“W” Shaped Recovery)
Table 264 Middle East and Africa Non-Destructive Testing Market Forecast by End-Users, 2020-2030 (US$ million, AGR %, CAGR%) (“L” Shaped Recovery)
Table 265 GCC Non-Destructive Testing Market Forecast 2020-2030 (US$ million, AGR %, CAGR %)
Table 266 GCC Non-Destructive Testing Market Forecast, 2020-2030 (Pre COVID & V, U, W, L Recovery Scenarios)
Table 267 GCC Non-Destructive Testing Market Forecast, 2020-2030 (“U” Shaped Recovery)
Table 268 GCC Non-Destructive Testing Market Forecast, 2020-2030 (“W” Shaped Recovery)
Table 269 GCC Non-Destructive Testing Market Forecast, 2020-2030 (“L” Shaped Recovery)
Table 270 GCC Non-Destructive Testing Market Forecast 2020-2030 (US$ million, AGR %, CAGR %)
Table 271 South Africa Non-Destructive Testing Market Forecast, 2020-2030 (Pre COVID & V, U, W, L Recovery Scenarios)
Table 272 South Africa Non-Destructive Testing Market Forecast, 2020-2030 (“U” Shaped Recovery)
Table 273 South Africa Non-Destructive Testing Market Forecast, 2020-2030 (“W” Shaped Recovery)
Table 274 South Africa Non-Destructive Testing Market Forecast, 2020-2030 (“L” Shaped Recovery)
Table 275 Rest of Middle East and Africa Non-Destructive Testing Market Forecast 2020-2030 (US$ million, AGR %, CAGR %)
Table 276 Rest of MEA Non-Destructive Testing Market Forecast, 2020-2030 (Pre COVID & V, U, W, L Recovery Scenarios)
Table 277 Rest of MEA Non-Destructive Testing Market Forecast, 2020-2030 (“U” Shaped Recovery)
Table 278 Rest of MEA Non-Destructive Testing Market Forecast, 2020-2030 (“W” Shaped Recovery)
Table 279 Rest of MEA Non-Destructive Testing Market Forecast, 2020-2030 (“L” Shaped Recovery)
Table 280 Ashtead Technology, Inc.: Key Details, 2020 (CEO, HQ, Founded, No. of Employees, Company Type, Website, Business Segment)
Table 281 Bosello High Technology S.R.L.: Key Details, 2020 (CEO, HQ, Founded, No. of Employees, Company Type, Website, Business Segment)
Table 282 Fujifilm Holding Corporation: Key Details, 2020 (CEO, HQ, Founded, No. of Employees, Company Type, Website, Business Segment)
Table 283 GE Measurement: Key Details, 2020 (CEO, HQ, Founded, No. of Employees, Company Type, Website, Business Segment)
Table 284 GE Measurement: SWOT Analysis
Table 285 Intertek Group PLC: Key Details, 2020 (CEO, HQ, Founded, No. of Employees, Company Type, Website, Business Segment)
Table 286 Intertek Group PLC: SWOT Analysis
Table 287 Magnaflux Corporation: Key Details, 2020 (CEO, HQ, Founded, No. of Employees, Company Type, Website, Business Segment)
Table 288 MISTRAS Group: Key Details, 2020 (CEO, HQ, Founded, No. of Employees, Company Type, Website, Business Segment)
Table 289 MISTRAS Group, Inc.: SWOT Analysis
Table 290 Nikon Metrology: Key Details, 2020 (CEO, HQ, Founded, No. of Employees, Company Type, Website, Business Segment)
Table 291 Olympus Corporation: Key Details, 2020 (CEO, HQ, Founded, No. of Employees, Company Type, Website, Business Segment)
Table 292 Olympus Corporation: SWOT Analysis
Table 293 SG SA: Key Details, 2020 (CEO, HQ, Founded, No. of Employees, Company Type, Website, Business Segment)
Table 294 SG NDT INC: SWOT Analysis
Table 295 Sonatest Ltd.: Key Details, 2020 (CEO, HQ, Founded, No. of Employees, Company Type, Website, Business Segment)
Table 296 Zetec Inc.: Key Details, 2020 (CEO, HQ, Founded, No. of Employees, Company Type, Website, Business Segment)
Table 297 EDDYFI NDT: Key Details, 2020 (CEO, HQ, Founded, No. of Employees, Company Type, Website, Business Segment)
Table 298 YXLON International: Key Details, 2020 (CEO, HQ, Founded, No. of Employees, Company Type, Website, Business Segment)
Table 299 T.D. Williamson, Inc.: Key Details, 2020 (CEO, HQ, Founded, No. of Employees, Company Type, Website, Business Segment)
Table 300 Labquip NDT: Key Details, 2020 (CEO, HQ, Founded, No. of Employees, Company Type, Website, Business Segment)
Table 301 FPrimeC Solutions Inc.: Key Details, 2020 (CEO, HQ, Founded, No. of Employees, Company Type, Website, Business Segment)
List of Figures
Figure 1 Global Non-Destructive Testing Market Segmentation
Figure 2 Porter’s Five Forces Analysis
Figure 3 Global Non-Destructive Testing Market Forecast by Offering, 2020-2030 (US$ million, AGR %)
Figure 4 Global Non-Destructive Testing Market Share Forecast by Offering, 2020, 2025, 2030 (%)
Figure 5 Global Non-Destructive Testing Market for NDT Services Segment: Revenue Forecast 2020-2030 (US$ million, AGR%)
Figure 6 Global Non-Destructive Testing Market for NDT Services Segment, Revenue Forecast 2020-2030 (US$ million, AGR%)(“V” Shaped Recovery)
Figure 7 Global Non-Destructive Testing Market for NDT Services Segment, Revenue Forecast 2020-2030 (US$ million, AGR%) (“U” Shaped Recovery)
Figure 8 Global Non-Destructive Testing Market for NDT Services Segment, Revenue Forecast 2020-2030 (US$ million, AGR%) (“W” Shaped Recovery)
Figure 9 Global Non-Destructive Testing Market for NDT Services Segment, Revenue Forecast 2020-2030 (US$ million, AGR%) (“L” Shaped Recovery)
Figure 10 Global Non-Destructive Testing Market for NDT Equipment Segment: Revenue Forecast 2020-2030 (US$ million, AGR%)
Figure 11 Global Non-Destructive Testing Market for NDT Equipment Segment, Revenue Forecast 2020-2030 (US$ million, AGR%) (Pre COVID & V, U, W, L Recovery Scenarios)
Figure 12 Global Non-Destructive Testing Market for NDT Equipment Segment, Revenue Forecast 2020-2030 (US$ million, AGR%) (“U” Shaped Recovery)
Figure 13 Global Non-Destructive Testing Market for NDT Equipment Segment, Revenue Forecast 2020-2030 (US$ million, AGR%) (“W” Shaped Recovery)
Figure 14 Global Non-Destructive Testing Market for NDT Equipment Segment, Revenue Forecast 2020-2030 (US$ million, AGR%) (“L” Shaped Recovery)
Figure 15 Global Non-Destructive Testing Market Forecast by Technique, 2020-2030 (US$ million, AGR %)
Figure 16 Global Non-Destructive Testing Market Share Forecast by Technique ,2020, 2025, 2030 (%)
Figure 17 Global Non-Destructive Testing Market for Ultrasonic Testing Segment: Revenue Forecast 2020-2030 (US$ million, AGR%)
Figure 18 Global Non-Destructive Testing Market for Ultrasonic Testing Segment, Revenue Forecast 2020-2030 (US$ million, AGR%) (Pre COVID & V, U, W, L Recovery Scenarios)
Figure 19 Global Non-Destructive Testing Market for Ultrasonic Testing Segment, Revenue Forecast 2020-2030 (US$ million, AGR%) (“U” Shaped Recovery)
Figure 20 Global Non-Destructive Testing Market for Ultrasonic Testing Segment, Revenue Forecast 2020-2030 (US$ million, AGR%) (“W” Shaped Recovery)
Figure 21 Global Non-Destructive Testing Market for Ultrasonic Testing Segment, Revenue Forecast 2020-2030 (US$ million, AGR%) (“L” Shaped Recovery)
Figure 22 Global Non-Destructive Testing Market for Visual Inspection Testing Segment: Revenue Forecast 2020-2030 (US$ million, AGR%)
Figure 23 Global Non-Destructive Testing Market for Visual Inspection Testing Segment, Revenue Forecast 2020-2030 (US$ million, AGR%) (Pre COVID & V, U, W, L Recovery Scenarios)
Figure 24 Global Non-Destructive Testing Market for Visual Inspection Testing Segment, Revenue Forecast 2020-2030 (US$ million, AGR%) (“U” Shaped Recovery)
Figure 25 Global Non-Destructive Testing Market for Visual Inspection Testing Segment, Revenue Forecast 2020-2030 (US$ million, AGR%) (“W” Shaped Recovery)
Figure 26 Global Non-Destructive Testing Market for Visual Inspection Testing Segment, Revenue Forecast 2020-2030 (US$ million, AGR%) (“L” Shaped Recovery)
Figure 27 Global Non-Destructive Testing Market for Magnetic Particle Testing Segment: Revenue Forecast 2020-2030 (US$ million, AGR%)
Figure 28 Global Non-Destructive Testing Market for Magnetic Particle Testing Segment, Revenue Forecast 2020-2030 (US$ million, AGR%) (Pre COVID & V, U, W, L Recovery Scenarios)
Figure 29 Global Non-Destructive Testing Market for Magnetic Particle Testing Segment, Revenue Forecast 2020-2030 (US$ million, AGR%) (“U” Shaped Recovery)
Figure 30 Global Non-Destructive Testing Market for Magnetic Particle Testing Segment, Revenue Forecast 2020-2030 (US$ million, AGR%) (“W” Shaped Recovery)
Figure 31 Global Non-Destructive Testing Market for Magnetic Particle Testing Segment, Revenue Forecast 2020-2030 (US$ million, AGR%) (“L” Shaped Recovery)
Figure 32 Global Non-Destructive Testing Market for Liquid Penetrant Testing Segment: Revenue Forecast 2020-2030 (US$ million, AGR%)
Figure 33 Global Non-Destructive Testing Market for Liquid Penetrant Testing Segment, Revenue Forecast 2020-2030 (US$ million, AGR%) (Pre COVID & V, U, W, L Recovery Scenarios)
Figure 34 Global Non-Destructive Testing Market for Liquid Penetrant Testing Segment, Revenue Forecast 2020-2030 (US$ million, AGR%) (“U” Shaped Recovery)
Figure 35 Global Non-Destructive Testing Market for Liquid Penetrant Testing Segment, Revenue Forecast 2020-2030 (US$ million, AGR%) (“W” Shaped Recovery)
Figure 36 Global Non-Destructive Testing Market for Liquid Penetrant Testing Segment, Revenue Forecast 2020-2030 (US$ million, AGR%) (“L” Shaped Recovery)
Figure 37 Global Non-Destructive Testing Market for Eddy Current Testing Segment: Revenue Forecast 2020-2030 (US$ million, AGR%)
Figure 38 Global Non-Destructive Testing Market for Eddy Current Testing Segment, Revenue Forecast 2020-2030 (US$ million, AGR%) (Pre COVID & V, U, W, L Recovery Scenarios)
Figure 39 Global Non-Destructive Testing Market for Eddy Current Testing Segment, Revenue Forecast 2020-2030 (US$ million, AGR%) (“U” Shaped Recovery)
Figure 40 Global Non-Destructive Testing Market for Eddy Current Testing Segment, Revenue Forecast 2020-2030 (US$ million, AGR%) (“W” Shaped Recovery)
Figure 41 Global Non-Destructive Testing Market for Eddy Current Testing Segment, Revenue Forecast 2020-2030 (US$ million, AGR%) (“L” Shaped Recovery)
Figure 42 Global Non-Destructive Testing Market for Radiographic Testing Segment: Revenue Forecast 2020-2030 (US$ million, AGR%)
Figure 43 Global Non-Destructive Testing Market for Radiographic Testing Segment, Revenue Forecast 2020-2030 (US$ million, AGR%) (Pre COVID & V, U, W, L Recovery Scenarios)
Figure 44 Global Non-Destructive Testing Market for Radiographic Testing Segment, Revenue Forecast 2020-2030 (US$ million, AGR%) (“U” Shaped Recovery)
Figure 45 Global Non-Destructive Testing Market for Radiographic Testing Segment, Revenue Forecast 2020-2030 (US$ million, AGR%) (“W” Shaped Recovery)
Figure 46 Global Non-Destructive Testing Market for Radiographic Testing Segment, Revenue Forecast 2020-2030 (US$ million, AGR%) (“L” Shaped Recovery)
Figure 47 Global Non-Destructive Testing Market for Acoustic Emission Testing Segment: Revenue Forecast 2020-2030 (US$ million, AGR%)
Figure 48 Global Non-Destructive Testing Market for Acoustic Emission Testing Segment, Revenue Forecast 2020-2030 (US$ million, AGR%) (Pre COVID & V, U, W, L Recovery Scenarios)
Figure 49 Global Non-Destructive Testing Market for Acoustic Emission Testing Segment, Revenue Forecast 2020-2030 (US$ million, AGR%) (“U” Shaped Recovery)
Figure 50 Global Non-Destructive Testing Market for Acoustic Emission Testing Segment, Revenue Forecast 2020-2030 (US$ million, AGR%) (“W” Shaped Recovery)
Figure 51 Global Non-Destructive Testing Market for Acoustic Emission Testing Segment, Revenue Forecast 2020-2030 (US$ million, AGR%) (“L” Shaped Recovery)
Figure 52 Global Non-Destructive Testing Market for Others Segment: Revenue Forecast 2020-2030 (US$ million, AGR%)
Figure 53 Global Non-Destructive Testing Market for Others Segment, Revenue Forecast 2020-2030 (US$ million, AGR%) (Pre COVID & V, U, W, L Recovery Scenarios)
Figure 54 Global Non-Destructive Testing Market for Others Segment, Revenue Forecast 2020-2030 (US$ million, AGR%) (“U” Shaped Recovery)
Figure 55 Global Non-Destructive Testing Market for Others Segment, Revenue Forecast 2020-2030 (US$ million, AGR%) (“W” Shaped Recovery)
Figure 56 Global Non-Destructive Testing Market for Others Segment, Revenue Forecast 2020-2030 (US$ million, AGR%) (“L” Shaped Recovery)
Figure 57 Global Non-Destructive Testing Market Forecast by End-Users, 2020-2030 (US$ million, AGR %)
Figure 58 Global Non-Destructive Testing Market Share Forecast by End-Users, 2020, 2025, 2030 (%)
Figure 59 Global Non-Destructive Testing Market for Oil and Gas Segment: Revenue Forecast 2020-2030 (US$ million, AGR%)
Figure 60 Global Non-Destructive Testing Market for Oil and Gas Segment, Revenue Forecast 2020-2030 (US$ million, AGR%) (Pre COVID & V, U, W, L Recovery Scenarios)
Figure 61 Global Non-Destructive Testing Market for Oil and Gas Segment, Revenue Forecast 2020-2030 (US$ million, AGR%) (“U” Shaped Recovery)
Figure 62 Global Non-Destructive Testing Market for Oil and Gas Segment, Revenue Forecast 2020-2030 (US$ million, AGR%) (“W” Shaped Recovery)
Figure 63 Global Non-Destructive Testing Market for Oil and Gas Segment, Revenue Forecast 2020-2030 (US$ million, AGR%) (“L” Shaped Recovery)
Figure 64 Global Non-Destructive Testing Market for Power Generation Segment: Revenue Forecast 2020-2030 (US$ million, AGR%)
Figure 65 Global Non-Destructive Testing Market for Power Generation Segment, Revenue Forecast 2020-2030 (US$ million, AGR%) (Pre COVID & V, U, W, L Recovery Scenarios)
Figure 66 Global Non-Destructive Testing Market for Power Generation Segment, Revenue Forecast 2020-2030 (US$ million, AGR%) (“U” Shaped Recovery)
Figure 67 Global Non-Destructive Testing Market for Power Generation Segment, Revenue Forecast 2020-2030 (US$ million, AGR%) (“W” Shaped Recovery)
Figure 68 Global Non-Destructive Testing Market for Power Generation Segment, Revenue Forecast 2020-2030 (US$ million, AGR%) (“L” Shaped Recovery)
Figure 69 Global Non-Destructive Testing Market for Aerospace and Defence Segment: Revenue Forecast 2020-2030 (US$ million, AGR%)
Figure 70 Global Non-Destructive Testing Market for Aerospace and Defence Segment, Revenue Forecast 2020-2030 (US$ million, AGR%) (Pre COVID & V, U, W, L Recovery Scenarios)
Figure 71 Global Non-Destructive Testing Market for Aerospace and Defence Segment, Revenue Forecast 2020-2030 (US$ million, AGR%) (“U” Shaped Recovery)
Figure 72 Global Non-Destructive Testing Market for Aerospace and Defence Segment, Revenue Forecast 2020-2030 (US$ million, AGR%) (“W” Shaped Recovery)
Figure 73 Global Non-Destructive Testing Market for Aerospace and Defence Segment, Revenue Forecast 2020-2030 (US$ million, AGR%) (“L” Shaped Recovery)
Figure 74 Global Non-Destructive Testing Market for Automotive Segment: Revenue Forecast 2020-2030 (US$ million, AGR%)
Figure 75 Global Non-Destructive Testing Market for Automotive Segment, Revenue Forecast 2020-2030 (US$ million, AGR%) (Pre COVID & V, U, W, L Recovery Scenarios)
Figure 76 Global Non-Destructive Testing Market for Automotive Segment, Revenue Forecast 2020-2030 (US$ million, AGR%) (“U” Shaped Recovery)
Figure 77 Global Non-Destructive Testing Market for Automotive Segment, Revenue Forecast 2020-2030 (US$ million, AGR%) (“W” Shaped Recovery)
Figure 78 Global Non-Destructive Testing Market for Automotive Segment, Revenue Forecast 2020-2030 (US$ million, AGR%) (“L” Shaped Recovery)
Figure 79 Global Non-Destructive Testing Market for Infrastructure Segment: Revenue Forecast 2020-2030 (US$ million, AGR%)
Figure 80 Global Non-Destructive Testing Market for Infrastructure Segment, Revenue Forecast 2020-2030 (US$ million, AGR%) (Pre COVID & V, U, W, L Recovery Scenarios)
Figure 81 Global Non-Destructive Testing Market for Infrastructure Segment, Revenue Forecast 2020-2030 (US$ million, AGR%) (“U” Shaped Recovery)
Figure 82 Global Non-Destructive Testing Market for Infrastructure Segment, Revenue Forecast 2020-2030 (US$ million, AGR%) (“W” Shaped Recovery)
Figure 83 Global Non-Destructive Testing Market for Infrastructure Segment, Revenue Forecast 2020-2030 (US$ million, AGR%) (“L” Shaped Recovery)
Figure 84 Global Non-Destructive Testing Market for Manufacturing Segment: Revenue Forecast 2020-2030 (US$ million, AGR%)
Figure 85 Global Non-Destructive Testing Market for Manufacturing Segment, Revenue Forecast 2020-2030 (US$ million, AGR%) (Pre COVID & V, U, W, L Recovery Scenarios)
Figure 86 Global Non-Destructive Testing Market for Manufacturing Segment, Revenue Forecast 2020-2030 (US$ million, AGR%) (“U” Shaped Recovery)
Figure 87 Global Non-Destructive Testing Market for Manufacturing Segment, Revenue Forecast 2020-2030 (US$ million, AGR%) (“W” Shaped Recovery)
Figure 88 Global Non-Destructive Testing Market for Manufacturing Segment, Revenue Forecast 2020-2030 (US$ million, AGR%) (“L” Shaped Recovery)
Figure 89 Global Non-Destructive Testing Market for Others Segment: Revenue Forecast 2020-2030 (US$ million, AGR%)
Figure 90 Global Non-Destructive Testing Market for Others Segment, Revenue Forecast 2020-2030 (US$ million, AGR%) (Pre COVID & V, U, W, L Recovery Scenarios)
Figure 91 Global Non-Destructive Testing Market for Others Segment, Revenue Forecast 2020-2030 (US$ million, AGR%) (“U” Shaped Recovery)
Figure 92 Global Non-Destructive Testing Market for Others Segment, Revenue Forecast 2020-2030 (US$ million, AGR%) (“W” Shaped Recovery)
Figure 93 Global Non-Destructive Testing Market for Others Segment, Revenue Forecast 2020-2030 (US$ million, AGR%) (“L” Shaped Recovery)
Figure 94 Global Non-Destructive Testing Market Forecast by Region 2020-2030 (US$ million)
Figure 95 Global Non-Destructive Testing Market Share Forecast by Region 2020, 2025, 2030 (%)
Figure 96 Global Non-Destructive Testing Market by Region, Revenue Forecast 2020-2030 (US$ million, AGR%) (Pre COVID & V, U, W, L Recovery Scenarios)
Figure 97 Global Non-Destructive Testing Market by Region, Revenue Forecast 2020-2030 (US$ million, AGR%) (“U” Shaped Recovery)
Figure 98 Global Non-Destructive Testing Market by Region, Revenue Forecast 2020-2030 (US$ million, AGR%) (“W” Shaped Recovery)
Figure 99 Global Non-Destructive Testing Market by Region, Revenue Forecast 2020-2030 (US$ million, AGR%) (“L” Shaped Recovery)
Figure 100 North America Non-Destructive Testing Market Forecast by Country 2020-2030 (US$ million)
Figure 101 North America Non-Destructive Testing Market Share Forecast by Country 2020, 2025, 2030 (%)
Figure 102 North America Non-Destructive Testing Market Forecast by Offering, 2020-2030 (US$ million, AGR%)
Figure 103 North America Non-Destructive Testing Market by Offering, Revenue Forecast 2020-2030 (US$ million, AGR%) (Pre COVID & V, U, W, L Recovery Scenarios)
Figure 104 North America Non-Destructive Testing Market by Offering, Revenue Forecast 2020-2030 (US$ million, AGR%) (“U” Shaped Recovery)
Figure 105 North America Non-Destructive Testing Market by Offering, Revenue Forecast 2020-2030 (US$ million, AGR%) (“W” Shaped Recovery)
Figure 106 North America Non-Destructive Testing Market by Offering, Revenue Forecast 2020-2030 (US$ million, AGR%) (“L” Shaped Recovery)
Figure 107 North America Non-Destructive Testing Market Forecast by Technique, 2020-2030 (US$ million, AGR%)
Figure 108 North America Non-Destructive Testing Market by Technique, Revenue Forecast 2020-2030 (US$ million, AGR%) (Pre COVID & V, U, W, L Recovery Scenarios)
Figure 109 North America Non-Destructive Testing Market by Technique, Revenue Forecast 2020-2030 (US$ million, AGR%) (“U” Shaped Recovery)
Figure 110 North America Non-Destructive Testing Market by Technique, Revenue Forecast 2020-2030 (US$ million, AGR%) (“W” Shaped Recovery)
Figure 111 North America Non-Destructive Testing Market by Technique, Revenue Forecast 2020-2030 (US$ million, AGR%) (“L” Shaped Recovery)
Figure 112 North America Non-Destructive Testing Market Forecast by End-Users, 2020-2030 (US$ million, AGR%)
Figure 113 North America Non-Destructive Testing Market by End-Users, Revenue Forecast 2020-2030 (US$ million, AGR%) (Pre COVID & V, U, W, L Recovery Scenarios)
Figure 114 North America Non-Destructive Testing Market by End-Users, Revenue Forecast 2020-2030 (US$ million, AGR%) (“U” Shaped Recovery)
Figure 115 North America Non-Destructive Testing Market by End-Users, Revenue Forecast 2020-2030 (US$ million, AGR%) (“W” Shaped Recovery)
Figure 116 North America Non-Destructive Testing Market by End-Users, Revenue Forecast 2020-2030 (US$ million, AGR%) (“L” Shaped Recovery)
Figure 117 U.S. Non-Destructive Testing Market Forecast 2020-2030 (US$ million, AGR %)
Figure 118 U.S. Non-Destructive Testing Market Forecast, 2020-2030 (US$ million, AGR%) (Pre COVID & V, U, W, L Recovery Scenarios)
Figure 119 U.S. Non-Destructive Testing Market Forecast, 2020-2030 (US$ million, AGR%) (“U” Shaped Recovery)
Figure 120 U.S. Non-Destructive Testing Market Forecast, 2020-2030 (US$ million, AGR%) (“W” Shaped Recovery)
Figure 121 U.S. Non-Destructive Testing Market Forecast, 2020-2030 (US$ million, AGR%) (“L” Shaped Recovery)
Figure 122 Canada Non-Destructive Testing Market Forecast 2020-2030 (US$ million, AGR %)
Figure 123 Canada Non-Destructive Testing Market Forecast, 2020-2030 (US$ million, AGR%) (Pre COVID & V, U, W, L Recovery Scenarios)
Figure 124 Canada Non-Destructive Testing Market Forecast, 2020-2030 (US$ million, AGR%) (“U” Shaped Recovery)
Figure 125 Canada Non-Destructive Testing Market Forecast, 2020-2030 (US$ million, AGR%) (“W” Shaped Recovery)
Figure 126 Canada Non-Destructive Testing Market Forecast, 2020-2030 (US$ million, AGR%) (“L” Shaped Recovery)
Figure 127 Europe Non-Destructive Testing Market Forecast by Country 2020-2030 (US$ million)
Figure 128 Europe Non-Destructive Testing Market Share Forecast by Country 2020, 2025, 2030 (%)
Figure 129 Europe Non-Destructive Testing Market Forecast by Offering, 2020-2030 (US$ million, AGR%)
Figure 130 Europe Non-Destructive Testing Market by Offering, Revenue Forecast 2020-2030 (US$ million, AGR%) (Pre COVID & V, U, W, L Recovery Scenarios)
Figure 131 Europe Non-Destructive Testing Market by Offering, Revenue Forecast 2020-2030 (US$ million, AGR%) (“U” Shaped Recovery)
Figure 132 Europe Non-Destructive Testing Market by Offering, Revenue Forecast 2020-2030 (US$ million, AGR%) (“W” Shaped Recovery)
Figure 133 Europe Non-Destructive Testing Market by Offering, Revenue Forecast 2020-2030 (US$ million, AGR%) (“L” Shaped Recovery)
Figure 134 Europe Non-Destructive Testing Market Forecast by Technique, 2020-2030 (US$ million, AGR%)
Figure 135 Europe Non-Destructive Testing Market by Technique, Revenue Forecast 2020-2030 (US$ million, AGR%) (Pre COVID & V, U, W, L Recovery Scenarios)
Figure 136 Europe Non-Destructive Testing Market by Technique, Revenue Forecast 2020-2030 (US$ million, AGR%) (“U” Shaped Recovery)
Figure 137 Europe Non-Destructive Testing Market by Technique, Revenue Forecast 2020-2030 (US$ million, AGR%) (“W” Shaped Recovery)
Figure 138 Europe Non-Destructive Testing Market by Technique, Revenue Forecast 2020-2030 (US$ million, AGR%) (“L” Shaped Recovery)
Figure 139 Europe Non-Destructive Testing Market Forecast by End-Users, 2020-2030 (US$ million, AGR%)
Figure 140 Europe Non-Destructive Testing Market by End-Users, Revenue Forecast 2020-2030 (US$ million, AGR%) (Pre COVID & V, U, W, L Recovery Scenarios)
Figure 141 Europe Non-Destructive Testing Market by End-Users, Revenue Forecast 2020-2030 (US$ million, AGR%) (“U” Shaped Recovery)
Figure 142 Europe Non-Destructive Testing Market by End-Users, Revenue Forecast 2020-2030 (US$ million, AGR%) (“W” Shaped Recovery)
Figure 143 Europe Non-Destructive Testing Market by End-Users, Revenue Forecast 2020-2030 (US$ million, AGR%) (“L” Shaped Recovery)
Figure 144 Germany Non-Destructive Testing Market Forecast 2020-2030 (US$ million, AGR %)
Figure 145 Germany Non-Destructive Testing Market Forecast, 2020-2030 (US$ million, AGR%) (Pre COVID & V, U, W, L Recovery Scenarios)
Figure 146 Germany Non-Destructive Testing Market Forecast, 2020-2030 (US$ million, AGR%) (“U” Shaped Recovery)
Figure 147 Germany Non-Destructive Testing Market Forecast, 2020-2030 (US$ million, AGR%) (“W” Shaped Recovery)
Figure 148 “L” Shaped Recovery: Germany Non-Destructive Testing Market Forecast, 2020-2030 (US$ million, AGR%)
Figure 149 France Non-Destructive Testing Market Forecast 2020-2030 (US$ million, AGR %)
Figure 150 France Non-Destructive Testing Market Forecast, 2020-2030 (US$ million, AGR%) (Pre COVID & V, U, W, L Recovery Scenarios)
Figure 151 France Non-Destructive Testing Market Forecast, 2020-2030 (US$ million, AGR%) (“U” Shaped Recovery)
Figure 152 France Non-Destructive Testing Market Forecast, 2020-2030 (US$ million, AGR%) (“W” Shaped Recovery)
Figure 153 France Non-Destructive Testing Market Forecast, 2020-2030 (US$ million, AGR%) (“L” Shaped Recovery)
Figure 154 UK Non-Destructive Testing Market Forecast 2020-2030 (US$ million, AGR %)
Figure 155 UK Non-Destructive Testing Market Forecast, 2020-2030 (US$ million, AGR%) (Pre COVID & V, U, W, L Recovery Scenarios)
Figure 156 UK Non-Destructive Testing Market Forecast, 2020-2030 (US$ million, AGR%) (“U” Shaped Recovery)
Figure 157 UK Non-Destructive Testing Market Forecast, 2020-2030 (US$ million, AGR%) (“W” Shaped Recovery)
Figure 158 UK Non-Destructive Testing Market Forecast, 2020-2030 (US$ million, AGR%) (“L” Shaped Recovery)
Figure 159 Italy Non-Destructive Testing Market Forecast 2020-2030 (US$ million, AGR %)
Figure 160 Italy Non-Destructive Testing Market Forecast, 2020-2030 (US$ million, AGR%) (Pre COVID & V, U, W, L Recovery Scenarios)
Figure 161 Italy Non-Destructive Testing Market Forecast, 2020-2030 (US$ million, AGR%) (“U” Shaped Recovery)
Figure 162 Italy Non-Destructive Testing Market Forecast, 2020-2030 (US$ million, AGR%) (“W” Shaped Recovery)
Figure 163 Italy Non-Destructive Testing Market Forecast, 2020-2030 (US$ million, AGR%) (“L” Shaped Recovery)
Figure 164 Russia Non-Destructive Testing Market Forecast 2020-2030 (US$ million, AGR %)
Figure 165 Russia Non-Destructive Testing Market Forecast, 2020-2030 (US$ million, AGR%) (Pre COVID & V, U, W, L Recovery Scenarios)
Figure 166 Russia Non-Destructive Testing Market Forecast, 2020-2030 (US$ million, AGR%) (“U” Shaped Recovery)
Figure 167 Russia Non-Destructive Testing Market Forecast, 2020-2030 (US$ million, AGR%) (“W” Shaped Recovery)
Figure 168 Russia Non-Destructive Testing Market Forecast, 2020-2030 (US$ million, AGR%) (“L” Shaped Recovery)
Figure 169 Rest of Europe Non-Destructive Testing Market Forecast 2020-2030 (US$ million, AGR %)
Figure 170 Rest of Europe Non-Destructive Testing Market Forecast, 2020-2030 (US$ million, AGR%) (Pre COVID & V, U, W, L Recovery Scenarios)
Figure 171 Rest of Europe Non-Destructive Testing Market Forecast, 2020-2030 (US$ million, AGR%) (“U” Shaped Recovery)
Figure 172 Rest of Europe Non-Destructive Testing Market Forecast, 2020-2030 (US$ million, AGR%) (“W” Shaped Recovery)
Figure 173 Rest of Europe Non-Destructive Testing Market Forecast, 2020-2030 (US$ million, AGR%) (“L” Shaped Recovery)
Figure 174 Asia Pacific Non-Destructive Testing Market Forecast by Country 2020-2030 (US$ million)
Figure 175 Asia Pacific Non-Destructive Testing Market Share Forecast by Country 2020, 2025, 2030 (%)
Figure 176 Asia Pacific Non-Destructive Testing Market Forecast by Offering, 2020-2030 (US$ million, AGR%)
Figure 177 Asia Pacific Non-Destructive Testing Market by Offering, Revenue Forecast 2020-2030 (US$ million, AGR%) (Pre COVID & V, U, W, L Recovery Scenarios)
Figure 178 Asia Pacific Non-Destructive Testing Market by Offering, Revenue Forecast 2020-2030 (US$ million, AGR%) (“U” Shaped Recovery)
Figure 179 Asia Pacific Non-Destructive Testing Market by Offering, Revenue Forecast 2020-2030 (US$ million, AGR%) (“W” Shaped Recovery)
Figure 180 Asia Pacific Non-Destructive Testing Market by Offering, Revenue Forecast 2020-2030 (US$ million, AGR%) (“L” Shaped Recovery)
Figure 181 Asia Pacific Non-Destructive Testing Market Forecast by Technique, 2020-2030 (US$ million, AGR%)
Figure 182 Asia Pacific Non-Destructive Testing Market by Technique, Revenue Forecast 2020-2030 (US$ million, AGR%) (Pre COVID & V, U, W, L Recovery Scenarios)
Figure 183 Asia Pacific Non-Destructive Testing Market by Technique, Revenue Forecast 2020-2030 (US$ million, AGR%) (“U” Shaped Recovery)
Figure 184 Asia Pacific Non-Destructive Testing Market by Technique, Revenue Forecast 2020-2030 (US$ million, AGR%) (“W” Shaped Recovery)
Figure 185 Asia Pacific Non-Destructive Testing Market by Technique, Revenue Forecast 2020-2030 (US$ million, AGR%) (“L” Shaped Recovery)
Figure 186 Asia Pacific Non-Destructive Testing Market Forecast by End-Users, 2020-2030 (US$ million, AGR%)
Figure 187 Asia Pacific Non-Destructive Testing Market by End-Users, Revenue Forecast 2020-2030 (US$ million, AGR%) (Pre COVID & V, U, W, L Recovery Scenarios)
Figure 188 Asia Pacific Non-Destructive Testing Market by End-Users, Revenue Forecast 2020-2030 (US$ million, AGR%) (“U” Shaped Recovery)
Figure 189 Asia Pacific Non-Destructive Testing Market by End-Users, Revenue Forecast 2020-2030 (US$ million, AGR%) (“W” Shaped Recovery)
Figure 190 Asia Pacific Non-Destructive Testing Market by End-Users, Revenue Forecast 2020-2030 (US$ million, AGR%) (“L” Shaped Recovery)
Figure 191 Japan Non-Destructive Testing Market Forecast 2020-2030 (US$ million, AGR %)
Figure 192 Japan Non-Destructive Testing Market Forecast, 2020-2030 (US$ million, AGR%) (Pre COVID & V, U, W, L Recovery Scenarios)
Figure 193 Japan Non-Destructive Testing Market Forecast, 2020-2030 (US$ million, AGR%) (“U” Shaped Recovery)
Figure 194 Japan Non-Destructive Testing Market Forecast, 2020-2030 (US$ million, AGR%) (“W” Shaped Recovery)
Figure 195 Japan Non-Destructive Testing Market Forecast, 2020-2030 (US$ million, AGR%) (“L” Shaped Recovery)
Figure 196 China Non-Destructive Testing Market Forecast 2020-2030 (US$ million, AGR %)
Figure 197 China Non-Destructive Testing Market Forecast, 2020-2030 (US$ million, AGR%) (Pre COVID & V, U, W, L Recovery Scenarios)
Figure 198 China Non-Destructive Testing Market Forecast, 2020-2030 (US$ million, AGR%) (“U” Shaped Recovery)
Figure 199 China Non-Destructive Testing Market Forecast, 2020-2030 (US$ million, AGR%) (“W” Shaped Recovery)
Figure 200 China Non-Destructive Testing Market Forecast, 2020-2030 (US$ million, AGR%) (“L” Shaped Recovery)
Figure 201 India Non-Destructive Testing Market Forecast 2020-2030 (US$ million, AGR %)
Figure 202 India Non-Destructive Testing Market Forecast, 2020-2030 (US$ million, AGR%) (Pre COVID & V, U, W, L Recovery Scenarios)
Figure 203 India Non-Destructive Testing Market Forecast, 2020-2030 (US$ million, AGR%) (“U” Shaped Recovery)
Figure 204 India Non-Destructive Testing Market Forecast, 2020-2030 (US$ million, AGR%) (“W” Shaped Recovery)
Figure 205 India Non-Destructive Testing Market Forecast, 2020-2030 (US$ million, AGR%) (“L” Shaped Recovery)
Figure 206 Australia Non-Destructive Testing Market Forecast 2020-2030 (US$ million, AGR %)
Figure 207 Australia Non-Destructive Testing Market Forecast, 2020-2030 (US$ million, AGR%) (Pre COVID & V, U, W, L Recovery Scenarios)
Figure 208 Australia Non-Destructive Testing Market Forecast, 2020-2030 (US$ million, AGR%) (“U” Shaped Recovery)
Figure 209 Australia Non-Destructive Testing Market Forecast, 2020-2030 (US$ million, AGR%) (“W” Shaped Recovery)
Figure 210 Australia Non-Destructive Testing Market Forecast, 2020-2030 (US$ million, AGR%) (“L” Shaped Recovery)
Figure 211 South Korea Non-Destructive Testing Market Forecast 2020-2030 (US$ million, AGR %)
Figure 212 South Korea Non-Destructive Testing Market Forecast, 2020-2030 (US$ million, AGR%) (Pre COVID & V, U, W, L Recovery Scenarios)
Figure 213 South Korea Non-Destructive Testing Market Forecast, 2020-2030 (US$ million, AGR%) (“U” Shaped Recovery)
Figure 214 South Korea Non-Destructive Testing Market Forecast, 2020-2030 (US$ million, AGR%) (“W” Shaped Recovery)
Figure 215 South Korea Non-Destructive Testing Market Forecast, 2020-2030 (US$ million, AGR%) (“L” Shaped Recovery)
Figure 216 Rest of Asia Pacific Non-Destructive Testing Market Forecast 2020-2030 (US$ million, AGR %)
Figure 217 Rest of Asia Pacific Non-Destructive Testing Market Forecast, 2020-2030 (US$ million, AGR%) (Pre COVID & V, U, W, L Recovery Scenarios)
Figure 218 Rest of Asia Pacific Non-Destructive Testing Market Forecast, 2020-2030 (US$ million, AGR%) (“U” Shaped Recovery)
Figure 219 Rest of Asia Pacific Non-Destructive Testing Market Forecast, 2020-2030 (US$ million, AGR%) (“W” Shaped Recovery)
Figure 220 Rest of Asia Pacific Non-Destructive Testing Market Forecast, 2020-2030 (US$ million, AGR%) (“L” Shaped Recovery)
Figure 221 Latin America Non-Destructive Testing Market Forecast by Country 2020-2030 (US$ million)
Figure 222 Latin America Non-Destructive Testing Market Share Forecast by Country 2020, 2025, 2030 (%)
Figure 223 Latin America Non-Destructive Testing Market Forecast by Offering, 2020-2030 (US$ million, AGR%)
Figure 224 Latin America Non-Destructive Testing Market by Offering, Revenue Forecast 2020-2030 (US$ million, AGR%) (Pre COVID & V, U, W, L Recovery Scenarios)
Figure 225 Latin America Non-Destructive Testing Market by Offering, Revenue Forecast 2020-2030 (US$ million, AGR%) (“U” Shaped Recovery)
Figure 226 Latin America Non-Destructive Testing Market by Offering, Revenue Forecast 2020-2030 (US$ million, AGR%) (“W” Shaped Recovery)
Figure 227 Latin America Non-Destructive Testing Market by Offering, Revenue Forecast 2020-2030 (US$ million, AGR%) (“L” Shaped Recovery)
Figure 228 Latin America Non-Destructive Testing Market Forecast by Technique, 2020-2030 (US$ million, AGR%)
Figure 229 Latin America Non-Destructive Testing Market by Technique, Revenue Forecast 2020-2030 (US$ million, AGR%) (Pre COVID & V, U, W, L Recovery Scenarios)
Figure 230 Latin America Non-Destructive Testing Market by Technique, Revenue Forecast 2020-2030 (US$ million, AGR%) (“U” Shaped Recovery)
Figure 231 Latin America Non-Destructive Testing Market by Technique, Revenue Forecast 2020-2030 (US$ million, AGR%) (“W” Shaped Recovery)
Figure 232 Latin America Non-Destructive Testing Market by Technique, Revenue Forecast 2020-2030 (US$ million, AGR%) (“L” Shaped Recovery)
Figure 233 Latin America Non-Destructive Testing Market Forecast by End-Users, 2020-2030 (US$ million, AGR%)
Figure 234 Latin America Non-Destructive Testing Market by End-Users, Revenue Forecast 2020-2030 (US$ million, AGR%) (Pre COVID & V, U, W, L Recovery Scenarios)
Figure 235 Latin America Non-Destructive Testing Market by End-Users, Revenue Forecast 2020-2030 (US$ million, AGR%) (“U” Shaped Recovery)
Figure 236 Latin America Non-Destructive Testing Market by End-Users, Revenue Forecast 2020-2030 (US$ million, AGR%) (“W” Shaped Recovery)
Figure 237 Latin America Non-Destructive Testing Market by End-Users, Revenue Forecast 2020-2030 (US$ million, AGR%) (“L” Shaped Recovery)
Figure 238 Brazil Non-Destructive Testing Market Forecast 2020-2030 (US$ million, AGR %)
Figure 239 Brazil Non-Destructive Testing Market Forecast, 2020-2030 (US$ million, AGR%) (Pre COVID & V, U, W, L Recovery Scenarios)
Figure 240 Brazil Non-Destructive Testing Market Forecast, 2020-2030 (US$ million, AGR%) (“U” Shaped Recovery)
Figure 241 Brazil Non-Destructive Testing Market Forecast, 2020-2030 (US$ million, AGR%) (“W” Shaped Recovery)
Figure 242 Brazil Non-Destructive Testing Market Forecast, 2020-2030 (US$ million, AGR%) (“L” Shaped Recovery)
Figure 243 Mexico Non-Destructive Testing Market Forecast 2020-2030 (US$ million, AGR %)
Figure 244 Mexico Non-Destructive Testing Market Forecast, 2020-2030 (US$ million, AGR%) (Pre COVID & V, U, W, L Recovery Scenarios)
Figure 245 Mexico Non-Destructive Testing Market Forecast, 2020-2030 (US$ million, AGR%) (“U” Shaped Recovery)
Figure 246 Mexico Non-Destructive Testing Market Forecast, 2020-2030 (US$ million, AGR%) (“W” Shaped Recovery)
Figure 247 Mexico Non-Destructive Testing Market Forecast, 2020-2030 (US$ million, AGR%) (“L” Shaped Recovery)
Figure 248 Rest of Latin America Non-Destructive Testing Market Forecast 2020-2030 (US$ million, AGR %)
Figure 249 Rest of Latin America Non-Destructive Testing Market Forecast, 2020-2030 (US$ million, AGR%) (Pre COVID & V, U, W, L Recovery Scenarios)
Figure 250 Rest of Latin America Non-Destructive Testing Market Forecast, 2020-2030 (US$ million, AGR%) (“U” Shaped Recovery)
Figure 251 Rest of Latin America Non-Destructive Testing Market Forecast, 2020-2030 (US$ million, AGR%) (“W” Shaped Recovery)
Figure 252 Rest of Latin America Non-Destructive Testing Market Forecast, 2020-2030 (US$ million, AGR%) (“L” Shaped Recovery)
Figure 253 Middle East and Africa Non-Destructive Testing Market Forecast by Country 2020-2030 (US$ million)
Figure 254 Middle East and Africa Non-Destructive Testing Market Share Forecast by Country 2020, 2025, 2030 (%)
Figure 255 Middle East and Africa Non-Destructive Testing Market Forecast by Offering, 2020-2030 (US$ million, AGR%)
Figure 256 Middle East and Africa Non-Destructive Testing Market by Offering, Revenue Forecast 2020-2030 (US$ million, AGR%) (Pre COVID & V, U, W, L Recovery Scenarios)
Figure 257 Middle East and Africa Non-Destructive Testing Market by Offering, Revenue Forecast 2020-2030 (US$ million, AGR%) (“U” Shaped Recovery)
Figure 258 Middle East and Africa Non-Destructive Testing Market by Offering, Revenue Forecast 2020-2030 (US$ million, AGR%) (“W” Shaped Recovery)
Figure 259 Middle East and Africa Non-Destructive Testing Market by Offering, Revenue Forecast 2020-2030 (US$ million, AGR%) (“L” Shaped Recovery)
Figure 260 Middle East and Africa Non-Destructive Testing Market Forecast by Technique, 2020-2030 (US$ million, AGR%)
Figure 261 Middle East and Africa Non-Destructive Testing Market by Technique, Revenue Forecast 2020-2030 (US$ million, AGR%) (Pre COVID & V, U, W, L Recovery Scenarios)
Figure 262 Middle East and Africa Non-Destructive Testing Market by Technique, Revenue Forecast 2020-2030 (US$ million, AGR%) (“U” Shaped Recovery)
Figure 263 Middle East and Africa Non-Destructive Testing Market by Technique, Revenue Forecast 2020-2030 (US$ million, AGR%) (“W” Shaped Recovery)
Figure 264 Middle East and Africa Non-Destructive Testing Market by Technique, Revenue Forecast 2020-2030 (US$ million, AGR%) (“L” Shaped Recovery)
Figure 265 Middle East and Africa Non-Destructive Testing Market Forecast by End-Users, 2020-2030 (US$ million, AGR%)
Figure 266 Middle East and Africa Non-Destructive Testing Market by End-Users, Revenue Forecast 2020-2030 (US$ million, AGR%) (Pre COVID & V, U, W, L Recovery Scenarios)
Figure 267 Middle East and Africa Non-Destructive Testing Market by End-Users, Revenue Forecast 2020-2030 (US$ million, AGR%) (“U” Shaped Recovery)
Figure 268 Middle East and Africa Non-Destructive Testing Market by End-Users, Revenue Forecast 2020-2030 (US$ million, AGR%) (“W” Shaped Recovery)
Figure 269 Middle East and Africa Non-Destructive Testing Market by End-Users, Revenue Forecast 2020-2030 (US$ million, AGR%) (“L” Shaped Recovery)
Figure 270 GCC Non-Destructive Testing Market Forecast 2020-2030 (US$ million, AGR %)
Figure 271 GCC Non-Destructive Testing Market Forecast, 2020-2030 (US$ million, AGR%) (Pre COVID & V, U, W, L Recovery Scenarios)
Figure 272 GCC Non-Destructive Testing Market Forecast, 2020-2030 (US$ million, AGR%) (“U” Shaped Recovery)
Figure 273 GCC Non-Destructive Testing Market Forecast, 2020-2030 (US$ million, AGR%) (“W” Shaped Recovery)
Figure 274 GCC Non-Destructive Testing Market Forecast, 2020-2030 (US$ million, AGR%) (“L” Shaped Recovery)
Figure 275 South Africa Non-Destructive Testing Market Forecast 2020-2030 (US$ million, AGR %)
Figure 276 South Africa Non-Destructive Testing Market Forecast, 2020-2030 (US$ million, AGR%) (Pre COVID & V, U, W, L Recovery Scenarios)
Figure 277 South Africa Non-Destructive Testing Market Forecast, 2020-2030 (US$ million, AGR%) (“U” Shaped Recovery)
Figure 278 South Africa Non-Destructive Testing Market Forecast, 2020-2030 (US$ million, AGR%) (“W” Shaped Recovery)
Figure 279 South Africa Non-Destructive Testing Market Forecast, 2020-2030 (US$ million, AGR%) (“L” Shaped Recovery)
Figure 280 Rest of Middle East and Africa Non-Destructive Testing Market Forecast 2020-2030 (US$ million, AGR %)
Figure 281 Rest of Middle East and Africa Non-Destructive Testing Market Forecast, 2020-2030 (US$ million, AGR%) (Pre COVID & V, U, W, L Recovery Scenarios)
Figure 282 Rest of Middle East and Africa Non-Destructive Testing Market Forecast, 2020-2030 (US$ million, AGR%) (“U” Shaped Recovery)
Figure 283 Rest of Middle East and Africa Non-Destructive Testing Market Forecast, 2020-2030 (US$ million, AGR%) (“W” Shaped Recovery)
Figure 284 Rest of Middle East and Africa Non-Destructive Testing Market Forecast, 2020-2030 (US$ million, AGR%) (“L” Shaped Recovery)
Figure 285 Fujifilm Holding Corporation : Company Financials, 2015-2019 (US$ Mn, AGR%)
Figure 286 GE Measurement : Company Financials, 2015-2019 (US$ Mn, AGR%)
Figure 287 Intertek Group PLC : Company Financials, 2015-2019 (US$ Mn, AGR%)
Figure 288 MISTRAS Group : Company Financials, 2015-2019 (US$ Mn, AGR%)
Figure 289 Olympus Corporation : Company Financials, 2015-2019 (US$ Mn, AGR%)
Figure 290 SG SA: Company Financials, 2015-2019 (US$ Mn, AGR%)
Companies Profiled in the Report
Ashtead Technology, Inc.
Bosello High Technology S.R.L.
EDDYFI NDT
FPrimeC Solutions Inc.
Fujifilm Holding Corporation
GE Measurement
Intertek Group PLC
Labquip NDT
Magnaflux Corporation
MISTRAS group
Nikon Metrology
Olympus Corporation
Sonatest Ltd.
SSG SA
T.D. Williamson, Inc.
YXLON International
Zetec Inc.
List of Other Companies
20/20 Ndt Inc
A-Tech N.D.T. Limited
Advanced Ndt Ltd.
Advanced Oem Solutions
Advantage Ndt Supplies Ltd.
Air France
Altran North America
Aquatec Group
Arise Global Pte Ltd
Aut Solutions Group, Llc
Bharat Forge
Blue Ocean Monitoring
Boeing
BP
Curtiss-Wright
Detek
Dynamic Technologies
Echo Ultrasonics Llc
Exxon Mobil Corp.
France Telecom
Galson
Gazprom
Gisco Asset Integrity Solutions
Gould-Bass Co.
Hi-Spec Systems Ltd
Hi-Tech Testing Services Inc
Hitachi
Innerspec Technologies, Inc.
Intel
International School Of Aerospace Ndt Limited
Intron Plus Ltd.
Kontron
Labino Ab
Le Brigand NDT
Lizard Nde Ltd.
Mammon Technologies Llp
Matrolab Group Ltd
Mercury Systems
Meyeroil
MISTRAS Group, Inc
Morgan Ward Ndt Ltd
Movitherm
MT Group
NACHER Corporation
Ndt Global Inc
Ndt Instruments Pte Ltd
Ndt Maincal Ltd.
Ndt Resources Ltd
Neptune Oceanographic Limited
Newco
Phoenix Inspection Systems Limited
Proceq Sa
Professional Service Industries Inc.
Renault
Russell NDE Systems
Siemens AG
Silverwing
South Oil Company (SOC)
Southern Nuclear
Suzhou Safety-Tech
Tata group
Technology Design
Testex Ndt India Pvt. Ltd.
Toyota
Tsc Inspection Systems
Tytek Magnetics
Visual Aim
West Penn Non-Destructive Testing, LLC
List of Organizations
Aerospace Research (IAR)
Blue Ocean Monitoring
British Institute of NDT (BINDT)
Government of Germany
Government of Saudi Arabia
Institute for Aerospace Research (IAR)
National Research Council Canada (NRCC)
NATO
Neptune Oceanographic Limited
PCI Industrial Computer Manufacturers Group (PICMG)
Swiss National bank
The EU
The G-20
The G-7
The Korean Ministry of Science and Technology
The Korean Society for Non-destructive Testing
The United Nations Security Council
VME-bus International Trade Association (VITA)
Download sample pages
Complete the form below to download your free sample pages for Non-Destructive Testing (NDT) Market Report 2020-2030Related reports
-

Lithium-Ion Battery Market Report 2020-2030
Visiongain values the lithium-ion battery market at $43.8bn in 2019.
...Full DetailsPublished: 30 March 2020 -
Lithium Iron Phosphate Battery Market Report 2020-2030
Are you aware that global Lithium Iron Phosphate Battery market spending reached $7,284.4 million in 2019? ...Full DetailsPublished: 27 March 2020 -

Gas to Liquids (GTL) Market Forecast 2020-2030
Visiongain assesses that the Global Gas to Liquids (GTL) market was valued at $2,915 million in 2019, and it is...
Full DetailsPublished: 25 February 2020 -
Green (Renewable) Diesel Market Report 2020-2030
Visiongain’s global green diesel market report can keep you informed and up to date with the developments in the market,...
Full DetailsPublished: 16 June 2020 -
Global Energy Infrastructure Resilience Market Forecast 2020-2030
Are you aware that global energy infrastructure resillience market spending reached $8,901.8 million in 2019?
...Full DetailsPublished: 24 March 2020 -

Deepwater Drilling Market Report 2020-2030
Deepwater drilling market size in 2030 is largely affected by political and economic instabilities, tensions between the US and Middle...
Full DetailsPublished: 07 April 2020 -

Electric Power Transmission & Distribution (T&D) Infrastructure Market 2020-2030
The latest research report from business intelligence provider Visiongain offers comprehensive analysis of the Electric Power Transmission & Distribution (T&D)...
Full DetailsPublished: 06 May 2020 -

Global Gas Insulated Switchgear Market Forecast 2020-2030
Visiongain’s analysis indicates that total spending on Gas Insulated Switchgear Market will be $20,293 million in 2020 as global energy...
Full DetailsPublished: 06 March 2020 -

Zero Net Energy Buildings Market 2020-2030
Visiongain’s analysis indicates that total revenue on Zero Net Energy Buildings Market will be $15,057.2 million in 2020 as environmental...
Full DetailsPublished: 31 March 2020 -

Grid-Scale Battery Storage Technologies Market Report 2020-2030
Energy storage is the process of capturing the produced energy in devices. These devices discharge energy at any time desired...
Full DetailsPublished: 16 June 2020
Download sample pages
Complete the form below to download your free sample pages for Non-Destructive Testing (NDT) Market Report 2020-2030Do you have any custom requirements we can help you with?
Any specific country, geo region, market segment or specific company information?
Email us today, we can discuss your needs and see how we can help: jamie.roberts@visiongain.com
Would you like a free report overview of the report of your choice?
If so, please drop an email to Jamie Roberts stating your chosen report title to jamie.roberts@visiongain.com
Visiongain energy reports are compiled using a broad and rich mixture of both primary and secondary information to produce an overall industry outlook. In order to provide our clients with the best product possible product, we do not rely on any one single source of information. Visiongain analysts reach out to market-leading vendors and industry experts where possible but also review a wealth of financial data and product information from a vast range of sources. To find out more about our reports methodology, please email jamie.roberts@visiongain.com
Would you like to get the latest Visiongain energy reports catalogue?
What are the dynamic growth sectors? where are the regional business opportunities?
Which technologies will prevail and who are the leading companies succeeding in these sectors and why?
If you want definitive answers to business critical questions, discover Visiongain’s full range of business intelligence reports.
If so, please email Jamie Roberts on jamie.roberts@visiongain.com or call her today on +44 207 336 6100
“The Visiongain report was extremely insightful and helped us construct our basic go-to market strategy for our solution.”
H.
“F.B has used Visiongain to prepare two separate market studies on the ceramic proppants market over the last 12 months. These reports have been professionally researched and written and have assisted FBX greatly in developing its business strategy and investment plans.”
F.B
“We just received your very interesting report on the Energy Storage Technologies (EST) Market and this is a very impressive and useful document on that subject.”
I.E.N
“Visiongain does an outstanding job on putting the reports together and provides valuable insight at the right informative level for our needs. The EOR Visiongain report provided confirmation and market outlook data for EOR in MENA with the leading countries being Oman, Kuwait and eventually Saudi Arabia.”
E.S
“Visiongain produced a comprehensive, well-structured GTL Market report striking a good balance between scope and detail, global and local perspective, large and small industry segments. It is an informative forecast, useful for practitioners as a trusted and upto-date reference.”
Y.N Ltd
Association of Dutch Suppliers in the Oil & Gas Industry
Society of Naval Architects & Marine Engineers
Association of Diving Contractors
Association of Diving Contractors International
Associazione Imprese Subacquee Italiane
Australian Petroleum Production & Exploration Association
Brazilian Association of Offshore Support Companies
Brazilian Petroleum Institute
Canadian Energy Pipeline
Diving Medical Advisory Committee
European Diving Technology Committee
French Oil and Gas Industry Council
IMarEST – Institute of Marine Engineering, Science & Technology
International Association of Drilling Contractors
International Association of Geophysical Contractors
International Association of Oil & Gas Producers
International Chamber of Shipping
International Shipping Federation
International Marine Contractors Association
International Tanker Owners Pollution Federation
Leading Oil & Gas Industry Competitiveness
Maritime Energy Association
National Ocean Industries Association
Netherlands Oil and Gas Exploration and Production Association
NOF Energy
Norsk olje og gass Norwegian Oil and Gas Association
Offshore Contractors’ Association
Offshore Mechanical Handling Equipment Committee
Oil & Gas UK
Oil Companies International Marine Forum
Ontario Petroleum Institute
Organisation of the Petroleum Exporting Countries
Regional Association of Oil and Natural Gas Companies in Latin America and the Caribbean
Society for Underwater Technology
Society of Maritime Industries
Society of Petroleum Engineers
Society of Petroleum Enginners – Calgary
Step Change in Safety
Subsea UK
The East of England Energy Group
UK Petroleum Industry Association
All the events postponed due to COVID-19.
Latest Energy news
Visiongain Publishes Carbon Capture Utilisation and Storage (CCUS) Market Report 2024-2034
The global carbon capture utilisation and storage (CCUS) market was valued at US$3.75 billion in 2023 and is projected to grow at a CAGR of 20.6% during the forecast period 2024-2034.
19 April 2024
Visiongain Publishes Liquid Biofuels Market Report 2024-2034
The global Liquid Biofuels market was valued at US$90.7 billion in 2023 and is projected to grow at a CAGR of 6.7% during the forecast period 2024-2034.
03 April 2024
Visiongain Publishes Hydrogen Generation Market Report 2024-2034
The global Hydrogen Generation market was valued at US$162.3 billion in 2023 and is projected to grow at a CAGR of 3.7% during the forecast period 2024-2034.
28 March 2024
Visiongain Publishes Biofuel Industry Market Report 2024-2034
The global Biofuel Industry market was valued at US$123.2 billion in 2023 and is projected to grow at a CAGR of 7.6% during the forecast period 2024-2034.
27 March 2024


