Industries > Energy > Electric Power Transmission & Distribution (T&D) Infrastructure Market 2020-2030
 Infrastructure Market 2020-2030")
Electric Power Transmission & Distribution (T&D) Infrastructure Market 2020-2030
Forecasts and Analysis by Network (Transmission, Distribution), Equipment (Cables, Line & Conductor, Transformer, Switchgear, Energy Meters, Capacitor, Other) and Geography, with Profiles of Top Companies in Electric Power Transmission & Distribution (T&D) Infrastructure
The latest research report from business intelligence provider Visiongain offers comprehensive analysis of the Electric Power Transmission & Distribution (T&D) Infrastructure market. Visiongain assesses that this market will generate $387.7bn in 2030.
Read on to discover how you can exploit the future business opportunities emerging in this sector.
In this brand new report you find 300 in-depth tables, charts and graphs all unavailable elsewhere.
The 385 page report provides clear detailed insight into the Electric Power Transmission & Distribution (T&D) Infrastructure market. Discover the key drivers and challenges affecting the market.
By ordering and reading our brand new report today you stay better informed and ready to act.
Report Scope
• The report delivers considerable added value by revealing:
• 300 tables, charts and graphs analysing and revealing the growth prospects and outlook for the Electric Power Transmission & Distribution (T&D) Infrastructure market.
• Electric Power Transmission & Distribution (T&D) Infrastructure market forecasts and analysis from 2020-2030
• Electric Power Transmission & Distribution (T&D) Infrastructure submarket forecasts from 2020-2030
• Transmission Forecast 2020-2030
• Distribution Forecast 2020-2030
• Cables Forecast 2020-2030
• Line and Conductor Forecast 2020-2030
• Transformer Forecast 2020-2030
• Switchgear Forecast 2020-2030
• Energy Meters Forecast 2020-2030
• Capactior Forecast 2020-2030
• Others Forecast 2020-2030
COVID-19 Impact: Market Evaluation & Forecasting Under Pandemic Situation
Short-Term Scenario: Rapid and Effective Control of COVID-19 virus Spread: Strong public health response succeeds in controlling spread in each country within 2-3 months and global markets responds positively and recovers rapidly after a huge downfall.
Long-Term Scenario: Broad Failure of Public Health Interventions: Despite a strong public health system around the world, all fails to control spread of COVID-19 virus and this situation gets worst in coming months and years. Public health response fails to control the spread of the virus for an extended period of time and global markets responds negatively and sees a rapid downfall.
• Electric Power Transmission & Distribution (T&D) Infrastructure market forecasts from 2020-2030 with drivers and restraints for the regions and national markets including:
• North America
• The US
• Canada
• Mexico
• Europe
• UK
• France
• Italy
• Germany
• Sweden
• Russia
• RoE
• Asia Pacific
• China
• Australia
• India
• Japan
• South Korea
• Indonesia
• RoA
• Middle East and Africa
• UAE
• Saudi Arabia
• Qatar
• South Africa
• Egypt
• Turkey
• Latin America
• Brazil
• Chile
• Argentina
• RoLA
• Conclusions and recommendations which will aid decision-making
• Company profiles for the leading Electric Power Transmission & Distribution (T&D) Infrastructure companies
• ABB
• Crompton Greaves
• Eaton
• General Electric
• Hitachi
• Hyosung
• Mitsubishi Electric
• Schneider Electric
• Siemens
• Toshiba
• Bharat Heavy Electricals Limited
• Fuji Electric Co. Ltd.
• Prysmian Group
• Larsen & Toubro Limited
• Legrand SA
• Nexans SA
• Powell Industries, Inc.
• Interconexion Electrica S.A.
• Tokyo Electric Power Company Holding Inc.
• Kenya Power and Lighting Company Ltd
How will you benefit from this report?
• Keep your knowledge base up to speed. Don’t get left behind
• Reinforce your strategic decision-making with definitive and reliable market data
• Learn how to exploit new technological trends
• Realise your company’s full potential within the market
• Understand the competitive landscape and identify potential new business opportunities & partnerships
Who should read this report?
• Anyone with interest in the Electric Power Transmission & Distribution (T&D) Infrastructure market
• Oil & gas operators
• Commodity traders
• Investment managers
• Arbitrage companies and divisions
• Energy price reporting companies
• Energy company managers
• Energy consultants
• Oil and gas company executives and analysts
• Heads of strategic development
• Business development managers
• Marketing managers
• Market analysts,
• Technologists
• Suppliers
• Investors
• Banks
• Government agencies
Visiongain’s study is intended for anyone requiring commercial analyses for the Electric Power Transmission & Distribution (T&D) Infrastructure market and leading companies. You find data, trends and predictions.
Buy our report today Electric Power Transmission & Distribution (T&D) Infrastructure Market Analysis : Forecasts and Analysis by Network (Transmission, Distribution), Equipment (Cables, Line & Conductor, Transformer, Switchgear, Energy Meters, Capacitor, Other) and Geography, with Profiles of Top Companies. Avoid missing out by staying informed – order our report now.
Visiongain is a trading partner with the US Federal Government
CCR Ref number: KD4R6
Do you have any custom requirements we can help you with? Any need for specific country, geo region, market segment or specific company information? Contact us today, we can discuss your needs and see how we can help: sara.peerun@visiongain.com
1. Report Overview
1.1 Global Market Overview
1.1.1 Electric Power Transmission & Distribution Process and Technology
1.1.2 Electric Power Transmission & Distribution Performance and Costs
1.1.3 Electric Power Transmission & Distribution Potential and Barriers
1.1.4 Covid-19 Pandemic Impact on Global Electricity Industry
1.1.5 Global Market Size Estimation and Forecast Till 2030
1.2 Why You Should Read This Report
1.3 How This Report Delivers
1.4 Key Questions Answered by This Analytical Report Include:
1.5 Who is This Report For?
1.6 Methodology
1.6.1 Primary Research
1.6.2 Secondary Research
1.6.3 Market Evaluation & Forecasting Methodology
1.6.4 Covid-19 Impact: Market Evaluation & Forecasting Under Pandemic Situation
1.7 Frequently Asked Questions (FAQ)
1.8 Associated Visiongain Reports
1.9 About Visiongain
2. Introduction to the Electric Power Transmission and Distribution (T&D) Infrastructure Market
2.1 Electric Power Transmission and Distribution (T&D) Infrastructure Market Definition
2.2.1 Basic Definitions
2.2 Electric Power Transmission and Distribution (T&D) Infrastructure Market Structure
2.3 Outbreak of Covid-19 Virus
3. Electric Power Transmission and Distribution: Industry Structure and Overview
3.1 Process and Technology Status
3.2 Existing Technologies
3.2.1 Lower losses
3.2.2 Lower Use of Land Space
3.3 Existing infrastructure capacity
3.4 Performance and Costs
3.4.1 Energy Losses
3.4.2 System Reliability
3.4.3 Phasor Measurements for Increased Transmission Capacity
3.5 Electricity Losses
3.5.1 Taxonomy of Electricity Losses
3.5.2 Classification of Losses
3.5.3 What Is The Expected level of Technical losses?
3.5.4 Data Availability
3.6 Costs and Investment
3.6.1 Investments In Transmission System Expansion
3.6.2 Investments In Distribution Systems
3.6.3 Global Investments In The Grid
3.6.4 Savings from network modernization
3.6.5 Toward Smart Grids
4. Market Dynamics
4.1 Factors Affecting Global Market
4.1.1 Increasing Flexibility In Distribution Networks
4.1.2 Using Distributed Energy Resources To Avoid Or Reduce Network Investments
4.1.3 Leveraging Data To Increase Renewable Energy Penetration
4.1.4 Potential Impact On Power Sector Transformation
4.1.5 New Transmission & Distribution Projects Need New Talent
4.2 Key Factors To Enable Deployment
4.2.1 Regulatory Frameworks For The Future Role Of DSOs
4.2.2 Standards for Data Management
4.2.3 Smart Grids and Digital Technologies
4.2.4 Improving Communication With Consumers
4.2.5 Current Context and Leading Initiatives
4.3 Drivers in the Electric Power Transmission & Distribution (T&D) Infrastructure Market
4.3.1 Rising Demand for Effective Energy Usage
4.3.2 Growing Adoption of Renewable Energy
4.3.3 Need for Efficient Grid Infrastructure
4.3.4 Rising Electric Vehicle Adoption Impacts Distribution Load
4.4 Restraints in the Electric Power Transmission & Distribution (T&D) Infrastructure Market
4.4.1 High Cost of Installation
4.4.2 Growing Cyber Attack Risks to the Electric Grid
5. Global Electric Power Transmission & Distribution (T&D) Infrastructure Market By Network Forecast 2020-2030
5.1 Global Market Size Estimation and Forecast
5.2 Global Market Size Estimation and Forecast by Region
5.3 Global Market Size Estimation and Forecast by Network Type
5.4 Global Market Size Estimation and Forecast by Equipment
6. Global Electric Power Transmission & Distribution (T&D) Infrastructure Market by Network Type Forecast 2020-2030
6.1 Global Market Share Estimation and Forecast (%)
6.2 Electric Power Transmission Infrastructure Overview
6.2.1 Global Electric Transmission Infrastructure Market, By Region Forecast 2020-2030 (US$billion, AGR %)
6.3 Electric Power Distribution Infrastructure Overview
6.3.1 Global Electric Distribution Infrastructure Market, By Region Forecast 2020-2030 (US$billion, AGR %)
7. Global Electric Power Transmission & Distribution (T&D) Infrastructure Market by Equipment Forecast 2020-2030
7.1 Global Market Share Estimation and Forecast (%)
7.2 Global Electric Power Transmission & Distribution (T&D) Infrastructure Market by Cables Forecast 2020-2030
7.2.1 Cable Specifications
7.2.2 Cable Construction
7.2.3 Conductors Classification
7.2.4 Conductor Sizes
7.2.5 Cable Insulations
7.2.6 Underground Cables
7.3 Global Electric Power Transmission & Distribution (T&D) Infrastructure Market by Line and Conductor Forecast 2020-2030
7.4 Global Electric Power Transmission & Distribution (T&D) Infrastructure Market by Transformer Forecast 2020-2030
7.4.1 Power Transformers
7.4.2 Distribution Transformers
7.5 Global Electric Power Transmission & Distribution (T&D) Infrastructure Market by Switchgear Forecast 2020-2030
7.5.1 Protection Equipment
7.5.2 Circuit Breakers
7.5.3 Fault Current Limiters
7.5.4 Surge Arresters
7. 6 Global Electric Power Transmission & Distribution (T&D) Infrastructure Market by Energy Meters Forecast 2020-2030
7.7 Global Electric Power Transmission & Distribution (T&D) Infrastructure Market by Capacitor Forecast 2020-2030
7.8 Global Electric Power Transmission & Distribution (T&D) Infrastructure Market by Others Forecast 2020-2030
7.8.1 Connectors
7.8.2 Power Flow Controllers
7.8.3 HVDC Converters
7.8.4 FACTS Devices
8. North America Electric Power Transmission & Distribution (T&D) Infrastructure Market Outlook
8.1 North America Electric Power Transmission & Distribution (T&D) Infrastructure Market by Country
8.2 U.S. Electric Power Transmission & Distribution (T&D) Infrastructure Market Outlook
8.2.1 Covid-19 Impact on the US Electricity Sector
8.2.2 U.S. Electric Power Transmission & Distribution (T&D) Infrastructure Market by Network Type
8.2.3 U.S. Electric Power Transmission & Distribution (T&D) Infrastructure Market by Equipment
8.3 Canada Electric Power Transmission & Distribution (T&D) Infrastructure Market Outlook
8.3.1 Canada Electric Power Transmission & Distribution (T&D) Infrastructure Market by Network Type
8.3.2 Canada Electric Power Transmission & Distribution (T&D) Infrastructure Market by Equipment
8.4 Mexico Electric Power Transmission & Distribution (T&D) Infrastructure Market Outlook
8. 4.1 Mexico Electric Power Transmission & Distribution (T&D) Infrastructure Market by Network Type
8. 4.2 Mexico Electric Power Transmission & Distribution (T&D) Infrastructure Market by Equipment
9. Europe Electric Power Transmission & Distribution (T&D) Infrastructure Market Outlook
9.1 Europe Electric Power Transmission & Distribution (T&D) Infrastructure Market by Country
9.2 U.K. Electric Power Transmission & Distribution (T&D) Infrastructure Market Outlook
9.2.1 Covid-19 Impact on the UK Energy Sector
9. 2.2 U.K. Electric Power Transmission & Distribution (T&D) Infrastructure Market by Network Type
9. 2.3 U.K. Electric Power Transmission & Distribution (T&D) Infrastructure Market by Equipment
9.3 France Electric Power Transmission & Distribution (T&D) Infrastructure Market Outlook
9. 3.1 France Electric Power Transmission & Distribution (T&D) Infrastructure Market by Network Type
9. 3.2 France Electric Power Transmission & Distribution (T&D) Infrastructure Market by Equipment
9.4 Italy Electric Power Transmission & Distribution (T&D) Infrastructure Market Outlook
9.4.1 Italy Electric Power Transmission & Distribution (T&D) Infrastructure Market by Network Type
9.4.2 Italy Electric Power Transmission & Distribution (T&D) Infrastructure Market by Equipment
9.5 Germany Electric Power Transmission & Distribution (T&D) Infrastructure Market Outlook
9. 5.1 Germany Electric Power Transmission & Distribution (T&D) Infrastructure Market by Network Type
9. 5.2 Germany Electric Power Transmission & Distribution (T&D) Infrastructure Market by Equipment
9.6 Sweden Electric Power Transmission & Distribution (T&D) Infrastructure Market Outlook
9. 6.1 Sweden Electric Power Transmission & Distribution (T&D) Infrastructure Market by Network Type
9. 6.2 Sweden Electric Power Transmission & Distribution (T&D) Infrastructure Market by Equipment
9.7 Russia Electric Power Transmission & Distribution (T&D) Infrastructure Market Outlook
9. 7.1 Russia Electric Power Transmission & Distribution (T&D) Infrastructure Market by Network Type
9.7.2 Russia Electric Power Transmission & Distribution (T&D) Infrastructure Market by Equipment
9.8 Poland Electric Power Transmission & Distribution (T&D) Infrastructure Market Outlook
9. 8.1 Poland Electric Power Transmission & Distribution (T&D) Infrastructure Market by Network Type
9. 8.2 Poland Electric Power Transmission & Distribution (T&D) Infrastructure Market by Equipment
9.9 Netherlands Electric Power Transmission & Distribution (T&D) Infrastructure Market Outlook
9. 9.1 Netherlands Electric Power Transmission & Distribution (T&D) Infrastructure Market by Network Type
9.9.2 Netherlands Electric Power Transmission & Distribution (T&D) Infrastructure Market by Equipment
9.10 Norway Electric Power Transmission & Distribution (T&D) Infrastructure Market Outlook
9. 10.1 Norway Electric Power Transmission & Distribution (T&D) Infrastructure Market by Network Type
9. 10.2 Norway Electric Power Transmission & Distribution (T&D) Infrastructure Market by Equipment
9.11 Rest of Europe Electric Power Transmission & Distribution (T&D) Infrastructure Market Outlook
9. 11.1 Rest of Europe Electric Power Transmission & Distribution (T&D) Infrastructure Market by Network Type
9. 11.2 Rest of Europe Electric Power Transmission & Distribution (T&D) Infrastructure Market by Equipment
10. Asia-Pacific Electric Power Transmission & Distribution (T&D) Infrastructure Market Outlook
10.1 Asia-Pacific Electric Power Transmission & Distribution (T&D) Infrastructure Market by Country
10.2 China Electric Power Transmission & Distribution (T&D) Infrastructure Market Outlook
10.2.1 China Electric Power Transmission & Distribution (T&D) Infrastructure Market by Network Type
10.2.2 China Electric Power Transmission & Distribution (T&D) Infrastructure Market by Equipment
10.3 Australia Electric Power Transmission & Distribution (T&D) Infrastructure Market Outlook
10.3.1 Australia Electric Power Transmission & Distribution (T&D) Infrastructure Market by Network Type
10.3.2 Australia Electric Power Transmission & Distribution (T&D) Infrastructure Market by Equipment
10.4 India Electric Power Transmission & Distribution (T&D) Infrastructure Market Outlook
10.4.1 India Electric Power Transmission & Distribution (T&D) Infrastructure Market by Network Type
10.4.2 India Electric Power Transmission & Distribution (T&D) Infrastructure Market by Equipment
10.5 Japan Electric Power Transmission & Distribution (T&D) Infrastructure Market Outlook
10.5.1 Japan Electric Power Transmission & Distribution (T&D) Infrastructure Market by Network Type
10.5.2 Japan Electric Power Transmission & Distribution (T&D) Infrastructure Market by Equipment
10.6 South Korea Electric Power Transmission & Distribution (T&D) Infrastructure Market Outlook
10.6.1 South Korea Electric Power Transmission & Distribution (T&D) Infrastructure Market by Network Type
10.6.2 South Korea Electric Power Transmission & Distribution (T&D) Infrastructure Market by Equipment
10.7 Indonesia Electric Power Transmission & Distribution (T&D) Infrastructure Market Outlook
10.7.1 Indonesia Electric Power Transmission & Distribution (T&D) Infrastructure Market by Network Type
10.7.2 Indonesia Electric Power Transmission & Distribution (T&D) Infrastructure Market by Equipment
10.8 Singapore Electric Power Transmission & Distribution (T&D) Infrastructure Market Outlook
10.8.1 Singapore Electric Power Transmission & Distribution (T&D) Infrastructure Market by Network Type
10.8.2 Singapore Electric Power Transmission & Distribution (T&D) Infrastructure Market by Equipment
10.9 Malaysia Electric Power Transmission & Distribution (T&D) Infrastructure Market Outlook
10.9.1 Malaysia Electric Power Transmission & Distribution (T&D) Infrastructure Market by Network Type
10.9.2 Malaysia Electric Power Transmission & Distribution (T&D) Infrastructure Market by Equipment
10.10 Rest of APAC Electric Power Transmission & Distribution (T&D) Infrastructure Market Outlook
10.10.1 Rest of APAC Electric Power Transmission & Distribution (T&D) Infrastructure Market by Network Type
10.10.2 Rest of APAC Electric Power Transmission & Distribution (T&D) Infrastructure Market by Equipment
11. Middle East & Africa Electric Power Transmission & Distribution (T&D) Infrastructure Market Outlook
11.1 Middle East & Africa Electric Power Transmission & Distribution (T&D) Infrastructure Market by Network Type
11.2 Middle East & Africa Electric Power Transmission & Distribution (T&D) Infrastructure Market by Country
11.3 UAE Electric Power Transmission & Distribution (T&D) Infrastructure Market Outlook
11.3.1 UAE Electric Power Transmission & Distribution (T&D) Infrastructure Market by Network Type
11.3.2 UAE Electric Power Transmission & Distribution (T&D) Infrastructure Market by Equipment
11.4 Saudi Arabia Electric Power Transmission & Distribution (T&D) Infrastructure Market Outlook
11.4.1 Saudi Arabia Electric Power Transmission & Distribution (T&D) Infrastructure Market by Network Type
11.4.2 Saudi Arabia Electric Power Transmission & Distribution (T&D) Infrastructure Market by Equipment
11.6 Qatar Electric Power Transmission & Distribution (T&D) Infrastructure Market Outlook
11.6.1 Qatar Electric Power Transmission & Distribution (T&D) Infrastructure Market by Network Type
11.6.2 Qatar Electric Power Transmission & Distribution (T&D) Infrastructure Market by Equipment
11.7 South Africa Electric Power Transmission & Distribution (T&D) Infrastructure Market Outlook
11.7.1 South Africa Electric Power Transmission & Distribution (T&D) Infrastructure Market by Network Type
11.7.2 South Africa Electric Power Transmission & Distribution (T&D) Infrastructure Market by Equipment
11.8 Egypt Electric Power Transmission & Distribution (T&D) Infrastructure Market Outlook
11.8.1 Egypt Electric Power Transmission & Distribution (T&D) Infrastructure Market by Network Type
11.8.2 Egypt Electric Power Transmission & Distribution (T&D) Infrastructure Market by Equipment
11.9 Turkey Electric Power Transmission & Distribution (T&D) Infrastructure Market Outlook
11.9.1 Turkey Electric Power Transmission & Distribution (T&D) Infrastructure Market by Network Type
11.9.2 Turkey Electric Power Transmission & Distribution (T&D) Infrastructure Market by Equipment
11.10 Rest of MEA Electric Power Transmission & Distribution (T&D) Infrastructure Market Outlook
11.10.1 Rest of MEA Electric Power Transmission & Distribution (T&D) Infrastructure Market by Network Type
11.10.2 Rest of MEA Electric Power Transmission & Distribution (T&D) Infrastructure Market by Equipment
12. Latin America Electric Power Transmission & Distribution (T&D) Infrastructure Market Outlook
12.1 Latin America Electric Power Transmission & Distribution (T&D) Infrastructure Market by Country
12.2 Brazil Electric Power Transmission & Distribution (T&D) Infrastructure Market Outlook
12.2.1 Brazil Electric Power Transmission & Distribution (T&D) Infrastructure Market by Network Type
12.2.2 Brazil Electric Power Transmission & Distribution (T&D) Infrastructure Market by Equipment
12.3 Chile Electric Power Transmission & Distribution (T&D) Infrastructure Market Outlook
12.3.1 Chile Electric Power Transmission & Distribution (T&D) Infrastructure Market by Network Type
12.3.2 Chile Electric Power Transmission & Distribution (T&D) Infrastructure Market by Equipment
12.4 Argentina Electric Power Transmission & Distribution (T&D) Infrastructure Market Outlook
12.4.1 Argentina Electric Power Transmission & Distribution (T&D) Infrastructure Market by Network Type
12.4.2 Argentina Electric Power Transmission & Distribution (T&D) Infrastructure Market by Equipment
12.5 Rest of LA Electric Power Transmission & Distribution (T&D) Infrastructure Market Outlook
12.5.1 Rest of LA Electric Power Transmission & Distribution (T&D) Infrastructure Market by Network Type
12.5.2 Rest of LA Electric Power Transmission & Distribution (T&D) Infrastructure Market by Equipment
13. Innovations in Electric Power Transmission and Distribution Sector
13.1 Innovation 01: Interregional and International Planning, and Balancing Area Expansion
13.1.1 Regional Integration and Planning in West Africa
13.1.2 South Asia Transmission Integration and Interconnection
13.1.3 Pentalateral Energy Forum Generation Adequacy Assessment
13.2 Innovation 02: Transmission Planning for Concentrated Areas of Renewable Energy
13.2.1 Mexico ‘Open Season’ Planning
13.2.2 Texas “Competitive Renewable Energy Zones”
13.2.3 China Transmission Planning for Gigawatt-Scale Wind-Power “Bases”
13.3 Innovation 03: Including Transmission Considerations into Interconnection Application Processes
13.3.1 Ireland “Gate” Process
13.4 Innovation 04: Integrating Forecasting into Transmission Operations
13.4.1 Idaho Power Company (United States) Renewable Integration Tools
13.4.2 Germany Wind and Solar Forecasting
13.4.3 Wind Forecasting in the Australian National Electricity Market
13.5 Innovation 05: Transmission Operation with Real Time System Intelligence
13.5.1 Growth of Dynamic Line Rating Usage in Various Systems
13.5.2 Growing Deployment of Phasor Measurement Units for Wide Area Monitoring
13.5.3 Growing Use of Real-Time and High-Resolution Market Prices
14. Major Transmission & Distribution Projects in 2019 and beyond
14.1 State Grid Corporation of China (SGCC) Transmission Lines
14.1.1 Project Details
14.1.2 Project Overview
14.2 Russia-Japan Energy Bridge
14.2.1 Project Details
14.2.2 Project Overview
14.3 Atlantic Wind Connection - Transmission
14.3.1 Project Details
14.3.2 Project Overview
14.4 EuroAsia Interconnector
14.4.1 Project Details
14.4.2 Project Overview
14.5 EuroAfrica Interconnector
14.5.1 Project Details
14.5.2 Project Overview
14.6 BRITIB Project
14.6.1 Project Details
14.6.2 Project Overview
14.7 Grain Belt Express Clean Line
14.7.1 Project Details
14.7.2 Project Overview
14.8 TransWest Express Transmission Line
14.8.1 Project Details
14.8.2 Project Overview
14.9 National Grid Power Infrastructure Frameworks
14.9.1 Project Details
14.9.2 Project Overview
14.10 Russia-North Korea Power Bridge (Primorye-Rosan)
14.10.1 Project Details
14.10.2 Project Overview
15. The Leading Companies in the Electric Power Transmission & Distribution (T&D) Infrastructure Market
15.1 ABB Ltd.
15.1.1 ABB Ltd. Company Financials 2015-2019
15.2 General Electric Company
15.2.1 General Electric Company Total Company Revenue 2015-2019
15.3 Toshiba Corporation
15.3.1 Toshiba Corporation Total Company Revenue 2015-2019
15.4 Siemens AG
15.4.1 Siemens AG Total Company Revenue 2015-2019
15.5 Schneider Electric SE
15.5.1 Schneider Electric SE Total Company Revenue 2011-2016
15.6 Hitachi Ltd.
15.6.1 Hitachi Ltd. Total Company Revenue 2015-2019
15.7 Mitsubishi Electric Corporation
15.7.1 Mitsubishi Electric Corporation Total Company Revenue 2011-2016
15.8 Crompton Greaves Limited
15.15.1 Crompton Greaves Limited Total Company Revenue 2015-2
15.9 Hyosung Corporation
15.9.1 Hyosung Corporation Total Company Revenue 2015-2019
15.10 Eaton Corporation
15.10.1 Eaton Corporation Total Company Revenue 2015-2019
15.11 Bharat Heavy Electricals Limited
15.11.1 Bharat Heavy Electricals Limited Total Company Revenue 2015-2019
15.12 Fuji Electric Co. Ltd.
15.12.1 Fuji Electric Co. Ltd. Total Company Revenue 2015-2019
15.13 Prysmian Group
15.13.1 Prysmian Group Total Company Revenue 2011-2016
15.14 Larsen & Toubro Limited
15.14.1 Larsen & Toubro Limited Total Company Revenue 2015-2019
15.15 Legrand SA
15.16 Nexans SA
15.17 Powell Industries, Inc.
15.17.1 Powell Industries, Inc. Total Company Revenue 2015-2019
15.18 Interconexion Electrica S.A.
15.19 Tokyo Electric Power Company Holding Inc.
15.19.1 Tokyo Electric Power Company Holding Inc. Total Company Revenue 2015-2019
15.20 Kenya Power and Lighting Company Ltd
15.20.1 Kenya Power and Lighting Company Ltd Total Company Revenue 2014-2018
15.21 Other Companies Involved in the Electric Power Transmission & Distribution (T&D) Infrastructure Market 2020
16. Covid-19 Pandemic Impact Analysis
16.1 Power Markets Will Likely See A Negative Pressure On Energy Pricing
16.1.1 Visiongain Also Point Out Several High-Level Impacts On Utility Finance:
16.1.2 Demand Destruction
16.1.3 Economic Stimulus
16.1.4 Industry—To Save or Not
16.1.5 Trade—Reshaped or Not
16.1.6. Hard to Gauge the Net Effect
16.2 COVID-19: Potential Impacts on the Electric Power Sector
16.2.1 Reduced Electricity Demand
16.2.2 Electric Reliability
16.2.3 Reduced Bill Payments
16.2.4 Industry Investment Activity
16.2.5 Impact on Utilities
16.2.6 Shift from Commercial to Residential Focus
16.2.7 Effects of Restoring Service Disconnections and Other Orders
16.2.8 Recovering Lost Revenues
16.2.9 Capex Cuts
16.2.10 Europe projects
16.2.11 Impact Of Government Policy Initiatives On Customer Billing Practices
17. Conclusions and Recommendations
17.1 Key Findings
17.2 Revenue Outlook Looks Optimistic
17.3 Renewables expected to bolster revenue
17.4 New Technology Anticipated To Reduce Costs
17.5 Key Brands Drive Revenue Growth
17.6 Consolidation Boosts Profit
17.7 Convenience and Service Diversity Drive Competition
17.8 Covid-19 and Coming Years
17.8.1 Hard Times Spark Innovation.
Glossary
Associated Visiongain Reports
Visiongain Report Sales Order Form
Appendix A
About Visiongain
Appendix B
Visiongain report evaluation form
List of Tables
Table 1.1 Global Electric Power Transmission & Distribution (T&D) Infrastructure Market Forecast 2020-2030 (US$bn, AGR %)
Table1.2 Leading Regional and National Electric Power Transmission & Distribution (T&D) Infrastructure Market Forecast 2020-2030 (US$bn, AGR %)
Table 1.3 Leading Regional and National Electric Power Transmission & Distribution (T&D) Infrastructure Market Forecast 2020-2030 (CAGR %)
Table 1.4 Leading Regional and National Electric Power Transmission & Distribution (T&D) Infrastructure Market Forecast 2020-2030 (US$bn, Global AGR %, Cumulative)
Table 1.5 Global Electric Power Transmission & Distribution (T&D) Infrastructure Market By Network Forecast 2020-2030 (US$bn, AGR %, Cumulative)
Table 1.6 Global Electric Power Transmission & Distribution (T&D) Infrastructure Market By Equipment Forecast 2020-2030 (US$bn, AGR %, Cumulative)
Table 3.1 Electric Power Transmission And Distribution Losses (% Of Output)
Table 3.2 Cost Related To New Transmission Lines And Interconnections
Table 3.3 Investment In Electricity-Supply Infrastructure By Region And Source, 2012-2035
Table 3.4 Comparison Of Existing Grids And Smart Grids
Table 3.5 Key Data and Figures for Electricity Transmission and Distribution
Table 5.1 Global Electric Power Transmission & Distribution (T&D) Infrastructure Market Forecast 2020-2030 (US$bn, AGR %)
Table 5.2 Leading Regional and National Electric Power Transmission & Distribution (T&D) Infrastructure Market Forecast 2020-2030 (US$bn, AGR %)
Table 5.3 Leading Regional and National Electric Power Transmission & Distribution (T&D) Infrastructure Market Forecast 2020-2030 (CAGR %)
Table 5.4 Global Electric Power Transmission & Distribution (T&D) Infrastructure Market by Network Type Forecast 2020-2030 (US$bn, AGR %)
Table 5.5 Global Electric Power Transmission & Distribution (T&D) Infrastructure Market by Network Type Forecast 2020-2030 (CAGR %)
Table 5.6 Global Electric Power Transmission & Distribution (T&D) Infrastructure Market by Equipment Type Forecast 2020-2030 (US$bn, AGR %)
Table 5.7 Global Electric Power Transmission & Distribution (T&D) Infrastructure Market by Equipment Type Forecast 2020-2030 (CAGR %)
Table 6.1 Cost per Mile: New Construction Transmission
Table 6.2 Global Electric Transmission Infrastructure Market, By Region Forecast 2020-2030 (US$bn, AGR %)
Table 6.3 Global Electric Transmission Infrastructure Market, By Region Forecast 2020-2030 (CAGR %)
Table 6.4 Cost per Mile: New Construction Distribution
Table 6.5 Global Electric Distribution Infrastructure Market, By Region Forecast 2020-2030 (US$bn, AGR %)
Table 6.6 Global Electric Distribution Infrastructure Market, By Region Forecast 2020-2030 (CAGR %)
Table 7.1 Global Electric T&D Infrastructure Market, By Cables Forecast 2020-2030 (US$bn, AGR %)
Table 7.2 Global Electric T&D Infrastructure Market, By Cables Forecast 2020-2030 (CAGR %)
Table 7.3 Global Electric T&D Infrastructure Market, By Line and Conductor Forecast 2020-2030 (US$bn, AGR %)
Table 7.4 Global Electric T&D Infrastructure Market, By Line and Conductor Forecast 2020-2030 (CAGR %)
Table 7.5 Overview of General Transformer Groups
Table 7.6 Global Electric T&D Infrastructure Market, By Transformer Forecast 2020-2030 (US$bn, AGR %)
Table 7.7 Global Electric T&D Infrastructure Market, By Transformer Forecast 2020-2030 (CAGR %)
Table 7.8 Global Electric T&D Infrastructure Market, By Switchgear Forecast 2020-2030 (US$bn, AGR %)
Table 7.9 Global Electric T&D Infrastructure Market, By Switchgear Forecast 2020-2030 (CAGR %)
Table 7.10 Global Electric T&D Infrastructure Market, By Energy Meters Forecast 2020-2030 (US$bn, AGR %)
Table 7.11 Global Electric T&D Infrastructure Market, By Energy Meters Forecast 2020-2030 (CAGR %)
Table 7.12 Global Electric T&D Infrastructure Market, By Capacitor Forecast 2020-2030 (US$bn, AGR %)
Table 7.13 Global Electric T&D Infrastructure Market, By Capacitor Forecast 2020-2030 (CAGR %)
Table 7.14 Global Electric T&D Infrastructure Market, By Others Forecast 2020-2030 (US$bn, AGR %)
Table 7.15 Global Electric T&D Infrastructure Market, By Others Forecast 2020-2030 (CAGR %)
Table 8.1 North America Electric Power Transmission & Distribution (T&D) Infrastructure Market by Network Type Forecast 2020-2030 (US$bn, AGR %)
Table 8.2 North America Electric Power Transmission & Distribution (T&D) Infrastructure Market by Equipment Type Forecast 2020-2030 (US$bn, AGR %)
Table 8.3 North America Electric Power Transmission & Distribution (T&D) Infrastructure Market by Country Forecast 2020-2030 (US$bn, AGR %)
Table 8.4 US Electric Power Transmission & Distribution (T&D) Infrastructure Market by Network Type Forecast 2020-2030 (US$bn, AGR %)
Table 8.5 US Electric Power Transmission & Distribution (T&D) Infrastructure Market by Equipment Type Forecast 2020-2030 (US$bn, AGR %)
Table 8.6 Canada Electric Power Transmission & Distribution (T&D) Infrastructure Market by Network Type Forecast 2020-2030 (US$bn, AGR %)
Table 8.7 Canada Electric Power Transmission & Distribution (T&D) Infrastructure Market by Equipment Type Forecast 2020-2030 (US$bn, AGR %)
Table 8.8 Mexico Electric Power Transmission & Distribution (T&D) Infrastructure Market by Network Type Forecast 2020-2030 (US$bn, AGR %)
Table 8.9 Mexico Electric Power Transmission & Distribution (T&D) Infrastructure Market by Equipment Type Forecast 2020-2030 (US$bn, AGR %)
Table 9.1 Distribution Circuit Length in European Countries, 2019
Table 9.2 Europe Electric Power Transmission & Distribution (T&D) Infrastructure Market by Network Type Forecast 2020-2030 (US$bn, AGR %)
Table 9.3 Europe Electric Power Transmission & Distribution (T&D) Infrastructure Market by Equipment Type Forecast 2020-2030 (US$bn, AGR %)
Table 9.4 Europe Electric Power Transmission & Distribution (T&D) Infrastructure Market by Country Forecast 2020-2030 (US$bn, CAGR %, AGR %)
Table 9.5 UK Electric Power Transmission & Distribution (T&D) Infrastructure Market by Network Type Forecast 2020-2030 (US$bn, AGR %)
Table 9.6 UK Electric Power Transmission & Distribution (T&D) Infrastructure Market by Equipment Type Forecast 2020-2030 (US$bn, AGR %)
Table 9.7 France Electric Power Transmission & Distribution (T&D) Infrastructure Market by Network Type Forecast 2020-2030 (US$bn, AGR %)
Table 9.8 France Electric Power Transmission & Distribution (T&D) Infrastructure Market by Equipment Type Forecast 2020-2030 (US$bn, AGR %)
Table 9.9 Italy Electric Power Transmission & Distribution (T&D) Infrastructure Market by Network Type Forecast 2020-2030 (US$bn, AGR %)
Table 9.10 Italy Electric Power Transmission & Distribution (T&D) Infrastructure Market by Equipment Type Forecast 2020-2030 (US$bn, AGR %)
Table 9.11 Germany Electric Power Transmission & Distribution (T&D) Infrastructure Market by Network Type Forecast 2020-2030 (US$bn, AGR %)
Table 9.12 Germany Electric Power Transmission & Distribution (T&D) Infrastructure Market by Equipment Type Forecast 2020-2030 (US$bn, AGR %)
Table 9.13 Sweden Electric Power Transmission & Distribution (T&D) Infrastructure Market by Network Type Forecast 2020-2030 (US$bn, AGR %)
Table9.14 Sweden Electric Power Transmission & Distribution (T&D) Infrastructure Market by Equipment Type Forecast 2020-2030 (US$bn, AGR %)
Table 9.15 Russia Electric Power Transmission & Distribution (T&D) Infrastructure Market by Network Type Forecast 2020-2030 (US$bn, AGR %)
Table 9.16 Russia Electric Power Transmission & Distribution (T&D) Infrastructure Market by Equipment Type Forecast 2020-2030 (US$bn, AGR %)
Table 9.17 Poland Electric Power Transmission & Distribution (T&D) Infrastructure Market by Network Type Forecast 2020-2030 (US$bn, AGR %)
Table 9.18 Poland Electric Power Transmission & Distribution (T&D) Infrastructure Market by Equipment Type Forecast 2020-2030 (US$bn, AGR %)
Table 9.19 Netherlands Electric Power Transmission & Distribution (T&D) Infrastructure Market by Network Type Forecast 2020-2030 (US$bn, AGR %)
Table 9.20 Netherlands Electric Power Transmission & Distribution (T&D) Infrastructure Market by Equipment Type Forecast 2020-2030 (US$bn, AGR %)
Table 9.21 Norway Electric Power Transmission & Distribution (T&D) Infrastructure Market by Network Type Forecast 2020-2030 (US$bn, AGR %)
Table 9.22 Norway Electric Power Transmission & Distribution (T&D) Infrastructure Market by Equipment Type Forecast 2020-2030 (US$bn, AGR %)
Table 9.23 Rest of Europe Electric Power Transmission & Distribution (T&D) Infrastructure Market by Network Type Forecast 2020-2030 (US$bn, AGR %)
Table 9.24 Rest of Europe Electric Power Transmission & Distribution (T&D) Infrastructure Market by Equipment Type Forecast 2020-2030 (US$bn, AGR %)
Table 10.1 Asia-Pacific Electric Power Transmission & Distribution (T&D) Infrastructure Market by Network Type Forecast 2020-2030 (US$bn, AGR %)
Table 10.2 Asia-Pacific Electric Power Transmission & Distribution (T&D) Infrastructure Market by Equipment Type Forecast 2020-2030 (US$bn, AGR %)
Table 10.3 Asia-Pacific Electric Power Transmission & Distribution (T&D) Infrastructure Market by Country Forecast 2020-2030 (US$bn, AGR %)
Table 10.4 China Electric Power Transmission & Distribution (T&D) Infrastructure Market by Network Type Forecast 2020-2030 (US$bn, AGR %)
Table 10.5 China Electric Power Transmission & Distribution (T&D) Infrastructure Market by Equipment Type Forecast 2020-2030 (US$bn, AGR %)
Table 10.6 Australia Electric Power Transmission & Distribution (T&D) Infrastructure Market by Network Type Forecast 2020-2030 (US$bn, AGR %)
Table 10.7 Australia Electric Power Transmission & Distribution (T&D) Infrastructure Market by Equipment Type Forecast 2020-2030 (US$bn, AGR %)
Table 10.8 India Electric Power Transmission & Distribution (T&D) Infrastructure Market by Network Type Forecast 2020-2030 (US$bn, AGR %)
Table 10.9 India Electric Power Transmission & Distribution (T&D) Infrastructure Market by Equipment Type Forecast 2020-2030 (US$bn, AGR %)
Table 10.10 Japan Electric Power Transmission & Distribution (T&D) Infrastructure Market by Network Type Forecast 2020-2030 (US$bn, AGR %)
Table 10.11 Japan Electric Power Transmission & Distribution (T&D) Infrastructure Market by Equipment Type Forecast 2020-2030 (US$bn, AGR %)
Table 10.12 South Korea Electric Power Transmission & Distribution (T&D) Infrastructure Market by Network Type Forecast 2020-2030 (US$bn, AGR %)
Table 10.13 South Korea Electric Power Transmission & Distribution (T&D) Infrastructure Market by Equipment Type Forecast 2020-2030 (US$bn, AGR %)
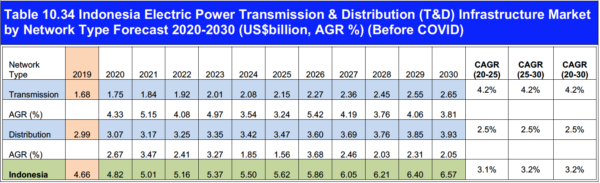
Table 10.14 Indonesia Electric Power Transmission & Distribution (T&D) Infrastructure Market by Network Type Forecast 2020-2030 (US$bn, AGR %)
Table 10.15 Indonesia Electric Power Transmission & Distribution (T&D) Infrastructure Market by Equipment Type Forecast 2020-2030 (US$bn, AGR %)
Table 10.16 Singapore Electric Power Transmission & Distribution (T&D) Infrastructure Market by Network Type Forecast 2020-2030 (US$bn, AGR %)
Table 10.17 Singapore Electric Power Transmission & Distribution (T&D) Infrastructure Market by Equipment Type Forecast 2020-2030 (US$bn, AGR %)
Table 10.18 Malaysia Electric Power Transmission & Distribution (T&D) Infrastructure Market by Network Type Forecast 2020-2030 (US$bn, AGR %)
Table 10.19 Malaysia Electric Power Transmission & Distribution (T&D) Infrastructure Market by Equipment Type Forecast 2020-2030 (US$bn, AGR %)
Table 10.20 Rest of APAC Electric Power Transmission & Distribution (T&D) Infrastructure Market by Network Type Forecast 2020-2030 (US$bn, AGR %)
Table 10.21 Rest of APAC Electric Power Transmission & Distribution (T&D) Infrastructure Market by Equipment Type Forecast 2020-2030 (US$bn, AGR %)
Table 11.1 Middle East & Africa Electric Power Transmission & Distribution (T&D) Infrastructure Market by Network Type Forecast 2020-2030 (US$bn, AGR %)
Table 11.2 Middle East & Africa Electric Power Transmission & Distribution (T&D) Infrastructure Market by Equipment Type Forecast 2020-2030 (US$bn, AGR %)
Table 11.3 MEA Electric Power Transmission & Distribution (T&D) Infrastructure Market by Country Forecast 2020-2030 (US$bn, AGR %)
Table 11.4 UAE Electric Power Transmission & Distribution (T&D) Infrastructure Market by Network Type Forecast 2020-2030 (US$bn, AGR %)
Table 11.5 UAE Electric Power Transmission & Distribution (T&D) Infrastructure Market by Equipment Type Forecast 2020-2030 (US$bn, AGR %)
Table 11.6 Saudi Arabia Electric Power Transmission & Distribution (T&D) Infrastructure Market by Network Type Forecast 2020-2030 (US$bn, AGR %)
Table 11.7 Saudi Arabia Electric Power Transmission & Distribution (T&D) Infrastructure Market by Equipment Type Forecast 2020-2030 (US$bn, AGR %)
Table 11.8 Qatar Electric Power Transmission & Distribution (T&D) Infrastructure Market by Network Type Forecast 2020-2030 (US$bn, AGR %)
Table 11.9 Qatar Electric Power Transmission & Distribution (T&D) Infrastructure Market by Equipment Type Forecast 2020-2030 (US$bn, AGR %)
Table 11.10 South Africa Electric Power Transmission & Distribution (T&D) Infrastructure Market by Network Type Forecast 2020-2030 (US$bn, AGR %)
Table 11.11 South Africa Electric Power Transmission & Distribution (T&D) Infrastructure Market by Equipment Type Forecast 2020-2030 (US$bn, AGR %)
Table 11.12 Egypt Electric Power Transmission & Distribution (T&D) Infrastructure Market by Network Type Forecast 2020-2030 (US$bn, AGR %)
Table 11.13 Egypt Electric Power Transmission & Distribution (T&D) Infrastructure Market by Equipment Type Forecast 2020-2030 (US$bn, AGR %)
Table 11.14 Turkey Electric Power Transmission & Distribution (T&D) Infrastructure Market by Network Type Forecast 2020-2030 (US$bn, AGR %)
Table 11.15 Turkey Electric Power Transmission & Distribution (T&D) Infrastructure Market by Equipment Type Forecast 2020-2030 (US$bn, AGR %)
Table 11.16 Rest of MEA Electric Power Transmission & Distribution (T&D) Infrastructure Market by Network Type Forecast 2020-2030 (US$bn, AGR %)
Table 11.17 Rest of MEA Electric Power Transmission & Distribution (T&D) Infrastructure Market by Equipment Type Forecast 2020-2030 (US$bn, AGR %)
Table 12.1 Latin America Electric Power Transmission & Distribution (T&D) Infrastructure Market by Network Type Forecast 2020-2030 (US$bn, AGR %)
Table 12.2 Latin America Electric Power Transmission & Distribution (T&D) Infrastructure Market by Equipment Type Forecast 2020-2030 (US$bn, AGR %)
Table 12.3 Latin America Electric Power Transmission & Distribution (T&D) Infrastructure Market by Country Forecast 2020-2030 (US$bn, AGR %)
Table 12.4 Brazil Electric Power Transmission & Distribution (T&D) Infrastructure Market by Network Type Forecast 2020-2030 (US$bn, AGR %)
Table 12.5 Brazil Electric Power Transmission & Distribution (T&D) Infrastructure Market by Equipment Type Forecast 2020-2030 (US$bn, AGR %)
Table 12.6 Key Planned/Upcoming Transmission Projects In Chile
Table 12.7 Chile Electric Power Transmission & Distribution (T&D) Infrastructure Market by Network Type Forecast 2020-2030 (US$bn, AGR %)
Table 12.8 Chile Electric Power Transmission & Distribution (T&D) Infrastructure Market by Equipment Type Forecast 2020-2030 (US$bn, AGR %)
Table 12.9 Argentina Electric Power Transmission & Distribution (T&D) Infrastructure Market by Network Type Forecast 2020-2030 (US$bn, AGR %)
Table 12.10 Argentina Electric Power Transmission & Distribution (T&D) Infrastructure Market by Equipment Type Forecast 2020-2030 (US$bn, AGR %)
Table 12.11 Rest of LA Electric Power Transmission & Distribution (T&D) Infrastructure Market by Network Type Forecast 2020-2030 (US$bn, AGR %)
Table 12.12 Rest of LA Electric Power Transmission & Distribution (T&D) Infrastructure Market by Equipment Type Forecast 2020-2030 (US$bn, AGR %)
Table 15.1 ABB Ltd. 2020 (CEO, Total Company Revenue US$m, Sales in the Market US$m, Share of Company Revenue from Electric Power T&D Infrastructure Market %, Net Income / Loss US$m, Net Capital ExpenditureUS$m, Strongest Business Region, Business Segment in the Market, HQ, Founded, No. of Employees, IR Contact, Ticker, Website)
Table 15.2 ABB Ltd. Total Company Revenue 2015-2019 (US$m, AGR %)
Table 15.3 ABB Ltd. Operating Income 2015-2019 (US$m)
Table 15.4 ABB Ltd. Total Company Net Income 2015-2019 (US$m)
Table 15.5 ABB Ltd. Total Company Net Income 2015-2019 (US$m)
Table 15.6 General Electric Company 2020 (CEO, Total Company Revenue US$m, Sales in the Market US$m, Share of Company Revenue from Electric Power T&D Infrastructure Market %, Net Income / Loss US$m, Net Capital ExpenditureUS$m, Strongest Business Region, Business Segment in the Market, HQ, Founded, No. of Employees, IR Contact, Ticker, Website)
Table 15.7 General Electric Total Company Revenue 2015-2019 (US$m, AGR %)
Table 15.8 General Electric Operating Income 2015-2019 (US$m)
Table 15.9 General Electric Total Company Net Income 2015-2019 (US$m)
Table 15.10 General Electric Total Company Net Income 2015-2019 (US$m)
Table 15.11 Toshiba Corporation 2020 (CEO, Total Company Revenue US$m, Sales in the Market US$m, Share of Company Revenue from Electric Power T&D Infrastructure Market %, Net Income / Loss US$m, Net Capital Expenditure US$m, Strongest Business Region, Business Segment in the Market, HQ, Founded, No. of Employees, IR Contact, Ticker, Website)
Table 15.12 Toshiba Corporation Total Company Revenue 2015-2019 (US$m, AGR %)
Table 15.13 Toshiba Corporation Operating Income 2015-2019 (US$m)
Table 15.14 Toshiba Corporation Total Company Net Income 2015-2019 (US$m)
Table 15.15 Toshiba Corporation Total Company Net Income 2015-2019 (US$m)
Table 15.16 Siemens AG 2020 (CEO, Total Company Revenue US$m, Sales in the Market US$m, Share of Company Revenue from Electric Power T&D Infrastructure Market %, Net Income / Loss US$m, Net Capital ExpenditureUS$m, Strongest Business Region, Business Segment in the Market, HQ, Founded, No. of Employees, IR Contact, Ticker, Website)
Table 15.17 Siemens AG Total Company Revenue 2015-2019 (US$m, AGR %)
Table 15.18 Siemens AG Operating Income 2015-2019 (US$m)
Table 15.19 Siemens AG Total Company Net Income 2015-2019 (US$m)
Table 15.20 Siemens AG Total Company Net Income 2015-2019 (US$m)
Table 15.21 Schneider Electric SE Profile 2020 (CEO, Total Company Revenue US$m, Sales in the Market US$m, Share of Company Revenue from Electric Power T&D Infrastructure Market %, Net Income / Loss US$m, Net Capital ExpenditureUS$m, Strongest Business Region, Business Segment in the Market, HQ, Founded, No. of Employees, IR Contact, Ticker, Website)
Table 15.22 Schneider Electric SE Total Company Revenue 2015-2019 (US$m, AGR %)
Table 15.23 Schneider Electric SE Operating Income 2015-2019 (US$m)
Table 15.24 Schneider Electric SE Total Company Net Income 2015-2019 (US$m)
Table 15.25 Schneider Electric SE Total Company Net Income 2015-2019 (US$m)
Table 15.26 Hitachi Ltd. Profile 2020 (CEO, Total Company Revenue US$m, Sales in the Market US$m, Share of Company Revenue from Electric Power T&D Infrastructure Market %, Net Income / Loss US$m, Net Capital ExpenditureUS$m, Strongest Business Region, Business Segment in the Market, HQ, Founded, No. of Employees, IR Contact, Ticker, Website)
Table 15.27 Hitachi Ltd. Total Company Revenue 2015-2019 (US$m, AGR %)
Table 15.28 Hitachi Ltd. Operating Income 2015-2019 (US$m)
Table 15.29 Hitachi Ltd. Total Company Net Income 2015-2019 (US$m)
Table 15.30 Hitachi Ltd. Total Company Net Income 2015-2019 (US$m)
Table 15.31 Mitsubishi Electric Corporation 2020 (CEO, Total Company Revenue US$m, Sales in the Market US$m, Share of Company Revenue from Electric Power T&D Infrastructure Market %, Net Income / Loss US$m, Net Capital ExpenditureUS$m, Strongest Business Region, Business Segment in the Market, HQ, Founded, No. of Employees, IR Contact, Ticker, Website)
Table 15.32 Mitsubishi Electric Corporation Total Company Revenue 2015-2019 (US$m, AGR %)
Table 15.33 Mitsubishi Electric Corporation Operating Income 2015-2019 (US$m)
Table 15.34 Mitsubishi Electric Corporation Total Company Net Income 2015-2019 (US$m)
Table 15.35 Mitsubishi Electric Corporation Total Company Net Income 2015-2019 (US$m)
Table 15.36 Crompton Greaves Limited 2020 (CEO, Total Company Revenue US$m, Sales in the Market US$m, Share of Company Revenue from Electric Power T&D Infrastructure Market %, Net Income / Loss US$m, Net Capital Expenditure US$m, Strongest Business Region, Business Segment in the Market, HQ, Founded, No. of Employees, IR Contact, Ticker, Website)
Table 15.37 Crompton Greaves Limited Total Company Revenue 2015-2019 (US$m, AGR %)
Table 15.38 Crompton Greaves Limited Operating Income 2015-2019 (US$m)
Table 15.39 Crompton Greaves Limited Total Company Net Income 2015-2019 (US$m)
Table 15.40 Crompton Greaves Limited Total Company Net Income 2015-2019 (US$m)
Table 15.41 Hyosung Corporation 2020 (CEO, Total Company Revenue US$m, Sales in the Market US$m, Share of Company Revenue from Electric Power T&D Infrastructure Market %, Net Income / Loss US$m, Net Capital ExpenditureUS$m, Strongest Business Region, Business Segment in the Market, HQ, Founded, No. of Employees, IR Contact, Ticker, Website)
Table 15.42 Hyosung Corporation Total Company Revenue 2015-2019 (US$m, AGR %)
Table 15.43 Hyosung Corporation Operating Income 2015-2019 (US$m)
Table 15.44 Hyosung Corporation Total Company Net Income 2015-2019 (US$m)
Table 15.45 Hyosung Corporation Total Company Net Income 2015-2019 (US$m)
Table 15.46 Eaton Corporation Profile 2020 (CEO, Total Company Revenue US$m, Sales in the Market US$m, Share of Company Revenue from Electric Power T&D Infrastructure Market %, Net Income / Loss US$m, Net Capital Expenditure US$m, Strongest Business Region, Business Segment in the Market, HQ, Founded, No. of Employees, IR Contact, Ticker, Website)
Table 15.47 Eaton Corporation Total Company Revenue 2015-2019 (US$m, AGR %)
Table 15.48 Eaton Corporation Operating Income 2015-2019 (US$m)
Table 15.49 Eaton Corporation Total Company Net Income 2015-2019 (US$m)
Table 15.50 Eaton Corporation Total Company Net Income 2015-2019 (US$m)
Table 15.51 Bharat Heavy Electricals Limited 2020 (CEO, Total Company Revenue US$m, Sales in the Market US$m, Share of Company Revenue from Electric Power T&D Infrastructure Market %, Net Income / Loss US$m, Net Capital ExpenditureUS$m, Strongest Business Region, Business Segment in the Market, HQ, Founded, No. of Employees, IR Contact, Ticker, Website)
Table 15.52 Bharat Heavy Electricals Limited Total Company Revenue 2015-2019 (US$m, AGR %)
Table 15.53 Bharat Heavy Electricals Limited Operating Income 2015-2019 (US$m)
Table 15.54 Bharat Heavy Electricals Limited Total Company Net Income 2015-2019 (US$m)
Table 15.55 Bharat Heavy Electricals Limited Total Company Net Income 2015-2019 (US$m)
Table 15.56 Fuji Electric Co. Ltd. 2020 (CEO, Total Company Revenue US$m, Sales in the Market US$m, Share of Company Revenue from Electric Power T&D Infrastructure Market %, Net Income / Loss US$m, Net Capital ExpenditureUS$m, Strongest Business Region, Business Segment in the Market, HQ, Founded, No. of Employees, IR Contact, Ticker, Website)
Table 15.57 Fuji Electric Co. Ltd. Total Company Revenue 2015-2019 (US$m, AGR %)
Table 15.58 Fuji Electric Co. Ltd. Operating Income 2015-2019 (US$m)
Table 15.59 Fuji Electric Co. Ltd. Total Company Net Income 2015-2019 (US$m)
Table 15.60 Fuji Electric Co. Ltd. Total Company Net Income 2015-2019 (US$m)
Table 15.61 Prysmian Group 2020 (CEO, Total Company Revenue US$m, Sales in the Market US$m, Share of Company Revenue from Electric Power T&D Infrastructure Market %, Net Income / Loss US$m, Net Capital ExpenditureUS$m, Strongest Business Region, Business Segment in the Market, HQ, Founded, No. of Employees, IR Contact, Ticker, Website)
Table 15.62 Prysmian Group Total Company Revenue 2015-2019 (US$m, AGR %)
Table 15.63 Prysmian Group Operating Income 2015-2019 (US$m)
Table 15.64 Prysmian Group Total Company Net Income 2015-2019 (US$m)
Table 15.65 Prysmian Group Total Company Net Income 2015-2019 (US$m)
Table 15.66 Larsen & Toubro Limited 2020 (CEO, Total Company Revenue US$m, Sales in the Market US$m, Share of Company Revenue from Electric Power T&D Infrastructure Market %, Net Income / Loss US$m, Net Capital ExpenditureUS$m, Strongest Business Region, Business Segment in the Market, HQ, Founded, No. of Employees, IR Contact, Ticker, Website)
Table 15.67 Larsen & Toubro Limited Total Company Revenue 2015-2019 (US$m, AGR %)
Table 15.68 Larsen & Toubro Limited Operating Income 2015-2019 (US$m)
Table 15.69 Larsen & Toubro Limited Total Company Net Income 2015-2019 (US$m)
Table 15.70 Larsen & Toubro Limited Total Company Net Income 2015-2019 (US$m)
Table 15.71 Legrand SA 2020 (CEO, Total Company Revenue US$m, Sales in the Market US$m, Share of Company Revenue from Electric Power T&D Infrastructure Market %, Net Income / Loss US$m, Net Capital ExpenditureUS$m, Strongest Business Region, Business Segment in the Market, HQ, Founded, No. of Employees, IR Contact, Ticker, Website)
Table 15.72 Legrand SA Total Company Revenue 2015-2019 (US$m, AGR %)
Table 15.73 Legrand SA Operating Income 2015-2019 (US$m)
Table 15.74 Legrand SA Total Company Net Income 2015-2019 (US$m)
Table 15.75 Legrand SA Total Company Net Income 2015-2019 (US$m)
Table 15.76 Nexans SA 2020 (CEO, Total Company Revenue US$m, Sales in the Market US$m, Share of Company Revenue from Electric Power T&D Infrastructure Market %, Net Income / Loss US$m, Net Capital ExpenditureUS$m, Strongest Business Region, Business Segment in the Market, HQ, Founded, No. of Employees, IR Contact, Ticker, Website)
Table 15.77 Nexans SA Total Company Revenue 2015-2019 (US$m, AGR %)
Table 15.78 Nexans SA Operating Income 2015-2019 (US$m)
Table 15.79 Nexans SA Total Company Net Income 2015-2019 (US$m)
Table 15.80 Nexans SA Total Company Net Income 2015-2019 (US$m)
Table 15.81 Powell Industries, Inc. 2020 (CEO, Total Company Revenue US$m, Sales in the Market US$m, Share of Company Revenue from Electric Power T&D Infrastructure Market %, Net Income / Loss US$m, Net Capital ExpenditureUS$m, Strongest Business Region, Business Segment in the Market, HQ, Founded, No. of Employees, IR Contact, Ticker, Website)
Table 15.82 Powell Industries, Inc. Total Company Revenue 2015-2019 (US$m, AGR %)
Table 15.83 Powell Industries, Inc. Operating Income 2015-2019 (US$m)
Table 15.84 Powell Industries, Inc. Total Company Net Income 2015-2019 (US$m)
Table 15.85 Powell Industries, Inc. Total Company Net Income 2015-2019 (US$m)
Table 15.86 Interconexion Electrica S.A. 2020 (CEO, Total Company Revenue US$m, Sales in the Market US$m, Share of Company Revenue from Electric Power T&D Infrastructure Market %, Net Income / Loss US$m, Net Capital ExpenditureUS$m, Strongest Business Region, Business Segment in the Market, HQ, Founded, No. of Employees, IR Contact, Ticker, Website)
Table 15.87 Interconexion Electrica S.A. Total Company Revenue 2014-2018 (US$m, AGR %)
Table 15.88 Interconexion Electrica S.A. Operating Income 2014-2018 (US$m)
Table 15.89 Interconexion Electrica S.A. Total Company Net Income 2014-2018 (US$m)
Table 15.90 Interconexion Electrica S.A. Total Company Net Income 2014-2018 (US$m)
Table 15.91 Tokyo Electric Power Company Holding Inc 2020 (CEO, Total Company Revenue US$m, Sales in the Market US$m, Share of Company Revenue from Electric Power T&D Infrastructure Market %, Net Income / Loss US$m, Net Capital ExpenditureUS$m, Strongest Business Region, Business Segment in the Market, HQ, Founded, No. of Employees, IR Contact, Ticker, Website)
Table 15.92 Tokyo Electric Power Company Holding Inc Total Company Revenue 2015-2019 (US$m, AGR %)
Table 15.93 Tokyo Electric Power Company Holding Inc Operating Income 2015-2019 (US$m)
Table 15.94 Tokyo Electric Power Company Holding Inc Total Company Net Income 2015-2019 (US$m)
Table 15.95 Tokyo Electric Power Company Holding Inc Total Company Net Income 2015-2019 (US$m)
Table 15.96 Kenya Power and Lighting Company Ltd 2020 (CEO, Total Company Revenue US$m, Sales in the Market US$m, Share of Company Revenue from Electric Power T&D Infrastructure Market %, Net Income / Loss US$m, Net Capital ExpenditureUS$m, Strongest Business Region, Business Segment in the Market, HQ, Founded, No. of Employees, IR Contact, Ticker, Website)
Table 15.97 Kenya Power and Lighting Company Ltd Total Company Revenue 2014-2018 (US$m, AGR %)
Table 15.98 Kenya Power and Lighting Company Ltd Operating Income 2014-2018 (US$m) Table
15.99 Kenya Power and Lighting Company Ltd Total Company Net Income 2014-2018 (US$m)
Table 15.100 Kenya Power and Lighting Company Ltd Total Company Net Income 2014-2018 (US$m)
Table 15.101 Other Companies Involved in the Electric Power Transmission & Distribution (T&D) Infrastructure Market 2017 (Company, Location)
List of Figures
Figure 1.1 Transmission and Distribution Grid Structure within the Power Industry
Figure1.2 Leading Regional and National Electric Power Transmission & Distribution (T&D) Infrastructure Market Forecast 2020-2030 (US$bn, AGR %)
Figure 1.3 Global Electric Power Transmission & Distribution (T&D) Infrastructure Market Share by Region 2020, 2025, 2030 (%)
Figure 2.1 Global Electric Power Transmission and Distribution (T&D) Infrastructure Market Segmentation Overview
Figure 3.1 Electric Losses Overview
Figure 5.1 Global Electric Power Transmission & Distribution (T&D) Infrastructure Market Forecast 2020-2030 (US$bn, AGR %)
Figure 5.2 Leading Regional and National Electric Power Transmission & Distribution (T&D) Infrastructure Market Forecast 2020-2030 (US$bn, AGR %)
Figure 5.3 Global Electric Power Transmission & Distribution (T&D) Infrastructure Market by Network Type Forecast 2020-2030 (US$bn, AGR %)
Figure 5.4 Global Electric Power Transmission & Distribution (T&D) Infrastructure Market by Equipment Type Forecast 2020-2030 (US$bn, AGR %)
Figure 6.1 Global Electric Power Transmission & Distribution (T&D) Infrastructure Market Share 2020, 2025, 2030 (%)
Figure 7.1 Global Electric Power Transmission & Distribution (T&D) Infrastructure Market Share 2020, 2025, 2030 (%)
Figure 15.1 ABB Ltd. Total Company Revenue 2015-2019 (US$m, AGR %)
Figure 15.2 ABB Ltd. Operating Income 2015-2019 (US$m)
Figure 15.3 ABB Ltd. Net Income 2015-2019 (US$m)
Figure 15.4 ABB Ltd. Total Company EBITDA 2015-2019 (US$m)
Figure 15.5 General Electric Total Company Revenue 2015-2019 (US$m, AGR %)
Figure 15.6 General Electric Operating Income 2015-2019 (US$m)
Figure 15.7 General Electric Net Income 2015-2019 (US$m)
Figure 15.8 General Electric Total Company EBITDA 2015-2019 (US$m)
Figure 15.9 Toshiba Corporation Total Company Revenue 2015-2019 (US$m, AGR %)
Figure 15.10 Toshiba Corporation Operating Income 2015-2019 (US$m)
Figure 15.11 Toshiba Corporation Net Income 2015-2019 (US$m)
Figure 15.12 Toshiba Corporation Total Company EBITDA 2015-2019 (US$m)
Figure 15.13 Siemens AG Total Company Revenue 2015-2019 (US$m, AGR %)
Figure 15.14 Siemens AG Operating Income 2015-2019 (US$m)
Figure 15.15 Siemens AG Net Income 2015-2019 (US$m)
Figure 15.16 Siemens AG Total Company EBITDA 2015-2019 (US$m)
Figure 15.17 Schneider Electric SE Total Company Revenue 2015-2019 (US$m, AGR %)
Figure 15.18 Schneider Electric SE Operating Income 2015-2019 (US$m)
Figure 15.19 Schneider Electric SE Net Income 2015-2019 (US$m)
Figure 15.20 Schneider Electric SE Total Company EBITDA 2015-2019 (US$m)
Figure 15.21 Hitachi Ltd. Total Company Revenue 2015-2019 (US$m, AGR %)
Figure 15.22 Hitachi Ltd. Operating Income 2015-2019 (US$m)
Figure 15.23 Hitachi Ltd. Net Income 2015-2019 (US$m)
Figure 15.24 Hitachi Ltd. Total Company EBITDA 2015-2019 (US$m)
Figure 15.25 Mitsubishi Electric Corporation Total Company Revenue 2015-2019 (US$m, AGR %)
Figure 15.26 Mitsubishi Electric Corporation Operating Income 2015-2019 (US$m)
Figure 15.27 Mitsubishi Electric Corporation Net Income 2015-2019 (US$m)
Figure 15.28 Mitsubishi Electric Corporation Total Company EBITDA 2015-2019 (US$m)
Figure 15.29 Crompton Greaves Limited Total Company Revenue 2015-2019 (US$m, AGR %)
Figure 15.30 Crompton Greaves Limited Operating Income 2015-2019 (US$m)
Figure 15.31 Crompton Greaves Limited Net Income 2015-2019 (US$m)
Figure 15.32 Crompton Greaves Limited Total Company EBITDA 2015-2019 (US$m)
Figure 15.33 Hyosung Corporation Total Company Revenue 2015-2019 (US$m, AGR %)
Figure 15.34 Hyosung Corporation Operating Income 2015-2019 (US$m)
Figure 15.35 Hyosung Corporation Net Income 2015-2019 (US$m)
Figure 15.36 Hyosung Corporation Total Company EBITDA 2015-2019 (US$m)
Figure 15.37 Eaton Corporation Total Company Revenue 2015-2019 (US$m, AGR %)
Figure 15.38 Eaton Corporation Operating Income 2015-2019 (US$m)
Figure 15.39 Eaton Corporation Net Income 2015-2019 (US$m)
Figure 15.40 Eaton Corporation Total Company EBITDA 2015-2019 (US$m)
Figure 15.41 Bharat Heavy Electricals Limited Total Company Revenue 2015-2019 (US$m, AGR %)
Figure 15.42 Bharat Heavy Electricals Limited Operating Income 2015-2019 (US$m)
Figure 15.43 Bharat Heavy Electricals Limited Net Income 2015-2019 (US$m)
Figure 15.44 Bharat Heavy Electricals Limited Total Company EBITDA 2015-2019 (US$m)
Figure 15.45 Fuji Electric Co. Ltd. Total Company Revenue 2015-2019 (US$m, AGR %)
Figure 15.46 Fuji Electric Co. Ltd. Operating Income 2015-2019 (US$m)
Figure 15.47 Fuji Electric Co. Ltd. Net Income 2015-2019 (US$m)
Figure 15.48 Fuji Electric Co. Ltd. Total Company EBITDA 2015-2019 (US$m)
Figure 15.49 Prysmian Group Total Company Revenue 2015-2019 (US$m, AGR %)
Figure 15.50 Prysmian Group Operating Income 2015-2019 (US$m)
Figure 15.51 Prysmian Group Net Income 2015-2019 (US$m)
Figure 15.52 Prysmian Group Total Company EBITDA 2015-2019 (US$m)
Figure 15.53 Larsen & Toubro Limited Total Company Revenue 2015-2019 (US$m, AGR %)
Figure 15.54 Larsen & Toubro Limited Operating Income 2015-2019 (US$m)
Figure 15.55 Larsen & Toubro Limited Net Income 2015-2019 (US$m)
Figure 15.56 Larsen & Toubro Limited Total Company EBITDA 2015-2019 (US$m)
Figure 15.57 Legrand SA Total Company Revenue 2015-2019 (US$m, AGR %)
Figure 15.58 Legrand SA Operating Income 2015-2019 (US$m)
Figure 15.59 Legrand SA Net Income 2015-2019 (US$m)
Figure 15.60 Legrand SA Total Company EBITDA 2015-2019 (US$m)
Figure 15.61 Nexans SA Total Company Revenue 2015-2019 (US$m, AGR %)
Figure 15.62 Nexans SA Operating Income 2015-2019 (US$m)
Figure 15.63 Nexans SA Net Income 2015-2019 (US$m)
Figure 15.64 Nexans SA Total Company EBITDA 2015-2019 (US$m)
Figure 15.65 Powell Industries, Inc. Total Company Revenue 2015-2019 (US$m, AGR %)
Figure 15.66 Powell Industries, Inc. Operating Income 2015-2019 (US$m)
Figure 15.67 Powell Industries, Inc. Net Income 2015-2019 (US$m)
Figure 15.68 Powell Industries, Inc. Total Company EBITDA 2015-2019 (US$m)
Figure 15.69 Interconexion Electrica S.A. Total Company Revenue 2014-2018 (US$m, AGR %)
Figure 15.70 Interconexion Electrica S.A. Operating Income 2014-2018 (US$m)
Figure 15.71 Interconexion Electrica S.A. Net Income 2014-2018 (US$m)
Figure 15.72 Interconexion Electrica S.A. Total Company EBITDA 2014-2018 (US$m)
Figure 15.73 Tokyo Electric Power Company Holding Inc Total Company Revenue 2015-2019 (US$m, AGR %)
Figure 15.74 Tokyo Electric Power Company Holding Inc Operating Income 2015-2019 (US$m)
Figure 15.75 Tokyo Electric Power Company Holding Inc Net Income 2015-2019 (US$m)
Figure 15.76 Tokyo Electric Power Company Holding Inc Total Company EBITDA 2015-2019 (US$m)
Figure 15.77 Kenya Power and Lighting Company Ltd Total Company Revenue 2014-2018 (US$m, AGR %)
Figure 15.78 Kenya Power and Lighting Company Ltd Operating Income 2014-2018 (US$m)
Figure 15.79 Kenya Power and Lighting Company Ltd Net Income 2014-2018 (US$m)
Figure 15.80 Kenya Power and Lighting Company Ltd Total Company EBITDA 2014-2018 (US$m)
Top companies Profiles in the Electric Power Transmission & Distribution (T&D) Infrastructure Market
ABB
Bharat Heavy Electricals Limited
Crompton Greaves
Eaton
Fuji Electric Co. Ltd.
General Electric
Hitachi
Hyosung
Interconexion Electrica S.A.
Kenya Power and Lighting Company Ltd
Larsen & Toubro Limited
Legrand SA
Mitsubishi Electric
Nexans SA
Powell Industries, Inc.
Prysmian Group
Schneider Electric
Siemens
Tokyo Electric Power Company Holding Inc.
Toshiba
Other Companies Mentioned
Abengoa
Actuant Group
Actuant Group
Alberta Electric System Operator
Alstom
AltaLink
Alupar
Ameren Corporation
Amprion
AMSC
Atco Electric
Atlantic Wind Connection
AZZ, Inc.
AZZ, Inc.
Borealis
Braxenergy
C-EPRI
Central Maine Power
China Southern Power Grid
China Xian Electrical Group
China Xian Electrical Group
Chint Group
Chint Group
Clean Line Energy Partners LLC
COES
Companhia de Transmissao de Energia Eletrica Paulista (CTEEP)
Copel – Companhia Paranaense de Energia
Coporacion Electrica del Ecuador
Crnogorski Elektroprenosni Sistem AD
Crompton Greaves
Cymimasa
DEH Quantum Energy
Delixi
Delixi
Dongfang Electric
Dongfang Electric
Duke American Transmission Company
Duke Energy Corporation
E-CL
East African Community
Eaton Cutler and Hammer
Edesur
Elecnor
Electrobras
Electronorte
Element Power
Elering
Elia
Emera
Emerson Electric Company
Empresa de Energia de Bogota (EEB)
EPM (Empresas Publicas de Medellin)
Eskom
Ethiopian Electric Power Corporation
Exelon Corporation
Fingrid
Fujikura
Furnas
Furukawa Electric
General Electric (GE)
Great River Energy
Hubbell Inc.
Hubbell, Inc.
Hyosung Corporation
INDECOPI
Interchile
Interconexion Electrica S.A.
Isolux Corsan
ITC Holdings Corporation
KETRACO – Kenya Electricity Transmission Co. Ltd.
Kirloskar Electric Company
Kirloskar Electric Company
Lapp
Legrand SA
LITGRID AB
LS Cable & System
LS power
Manitoba Hydro
Medgrid
Mitsubishi Electric
Nalcor Energy
National Grid Corporation of the Philippines (NGCP)
National Grid Plc
Nexans
Norte Energia
Northern Pass Transmission LLC
Nur Energie
Omnetric Group
Pacific Gas & Electric Company (PG&E)
PLN (Perusahaan Listrik Negara)
Powell Industries
Powell Industries
Power Grid Corporation of India (POWERGRID)
PPC Renewables
PPL Corporation
PT BICC BERCA Cables
Red Electrica de España
Russian Federal Grid Company
S&C Electric Company
S&C Electric Company
Sarawak Energy Berhad
Schneider Electric
Scottish and Southern Energy (SSE)
Siemens
Southern California Edison (SCE)
SouthWestern Power Group (SPG)
SPX Group
SPX Group
State Grid Corporation of China (SGCC)
Statnett
TenneT
TERNA
Tokyo Electric Power Company (TEPCO)
Toshiba Transmission Distribution & Industrial Systems Company
Transmission Developers Inc.
Transpower New Zealand
Uganda Electricity Transmission Company
Waukesha Electric Systems, Inc.
ZESCO
Government Agencies and Other Organisations Mentioned in This Report
American Society of Civil Engineers
American Wind Energy Association
ANDE – Administracion Nacional de Electricidad
ASEAN Centre for Energy
Association of Southeast Asian Nations (ASEAN)
Bundesnetzagentur (BNetZA) – German Federal Network Agency
Canadian Electricity Association
CIA World Factbook
CIGRE
Conference of the Parties 21
Council of European Energy Regulators (CEER)
Department of Energy and Climate Change
Electricidade de Moçambique (EDM)
Electricity of Vietnam (EVN)
Electricity Generating Authority of Thailand (EGAT)
Federal Government of Malaysia
German Renewable Energy Federation
Government of Argentina
Government of Egypt
Government of Mali
Government of Mozambique
International Trade Administration Industry & Analysis
Massachusetts Institute of Technology (MIT)
Ministry of Energy of the Russian Federation
Mozambique Electricity
Norwegian Smartgrid Centre
Office of Gas and Electricity Markets (Ofgem)
OSINERGMIN - Peruvian state energy and mines investment regulator
Peruvian Ministry of Energy and Mines (MEM)
Peruvian Ministry of the Environment
PROINVERSION
West African Power Pool
World Bank
World Nuclear Association
Download sample pages
Complete the form below to download your free sample pages for Electric Power Transmission & Distribution (T&D) Infrastructure Market 2020-2030Related reports
-

Lithium-Ion Battery Market Report 2020-2030
Visiongain values the lithium-ion battery market at $43.8bn in 2019.
...Full DetailsPublished: 30 March 2020 -

Aircraft Wire and Cable Market Report 2020-2030
The increasing new aircraft orders across the globe and growth in passenger traffic is expected to drive the revenue growth...
Full DetailsPublished: 01 January 1970 -
Gas to Liquids (GTL) Market Forecast 2020-2030
Visiongain assesses that the Global Gas to Liquids (GTL) market was valued at $2,915 million in 2019, and it is...
Full DetailsPublished: 25 February 2020 -
Submarine Power Cables Market Forecast 2020-2030
Growing developments/contracts related to submarine power cables coupled year-on-year deployment of underwater cables across the globe has led Visiongain to...Full DetailsPublished: 31 October 2019 -
Global Energy Infrastructure Resilience Market Forecast 2020-2030
Are you aware that global energy infrastructure resillience market spending reached $8,901.8 million in 2019?
...Full DetailsPublished: 24 March 2020 -
Small Scale Liquefied Natural Gas (LNG) Market Forecast 2019-2029
Visiongain has calculated that the global Small Scale Liquefied Natural Gas (LNG) Market will see a capital expenditure (CAPEX) of...
Full DetailsPublished: 18 June 2019 -
Geothermal Power Market Forecast 2019-2029
Visiongain has calculated that the global Geothermal Power Market will see a capital expenditure (CAPEX) of $7,256mn in 2019. Read...
Full DetailsPublished: 23 May 2019 -
Carbon Capture, Transportation & Storage Market Report 2021-2031
Government funding initiatives are crucial to ensure that government GHG emissions reduction targets are translated into tangible CCS projects. Visiongain...Full DetailsPublished: 29 September 2020 -
Zero Net Energy Buildings Market 2020-2030
Visiongain’s analysis indicates that total revenue on Zero Net Energy Buildings Market will be $15,057.2 million in 2020 as environmental...
Full DetailsPublished: 31 March 2020 -
Grid Scale Battery Storage Technologies Market Report 2021-2031
The increasing demand for storage for energy losses, in particular for portable batteries, is predicted to increase. ...Full DetailsPublished: 10 August 2021
Download sample pages
Complete the form below to download your free sample pages for Electric Power Transmission & Distribution (T&D) Infrastructure Market 2020-2030Do you have any custom requirements we can help you with?
Any specific country, geo region, market segment or specific company information?
Email us today, we can discuss your needs and see how we can help: jamie.roberts@visiongain.com
Would you like a free report overview of the report of your choice?
If so, please drop an email to Jamie Roberts stating your chosen report title to jamie.roberts@visiongain.com
Visiongain energy reports are compiled using a broad and rich mixture of both primary and secondary information to produce an overall industry outlook. In order to provide our clients with the best product possible product, we do not rely on any one single source of information. Visiongain analysts reach out to market-leading vendors and industry experts where possible but also review a wealth of financial data and product information from a vast range of sources. To find out more about our reports methodology, please email jamie.roberts@visiongain.com
Would you like to get the latest Visiongain energy reports catalogue?
What are the dynamic growth sectors? where are the regional business opportunities?
Which technologies will prevail and who are the leading companies succeeding in these sectors and why?
If you want definitive answers to business critical questions, discover Visiongain’s full range of business intelligence reports.
If so, please email Jamie Roberts on jamie.roberts@visiongain.com or call her today on +44 207 336 6100
“The Visiongain report was extremely insightful and helped us construct our basic go-to market strategy for our solution.”
H.
“F.B has used Visiongain to prepare two separate market studies on the ceramic proppants market over the last 12 months. These reports have been professionally researched and written and have assisted FBX greatly in developing its business strategy and investment plans.”
F.B
“We just received your very interesting report on the Energy Storage Technologies (EST) Market and this is a very impressive and useful document on that subject.”
I.E.N
“Visiongain does an outstanding job on putting the reports together and provides valuable insight at the right informative level for our needs. The EOR Visiongain report provided confirmation and market outlook data for EOR in MENA with the leading countries being Oman, Kuwait and eventually Saudi Arabia.”
E.S
“Visiongain produced a comprehensive, well-structured GTL Market report striking a good balance between scope and detail, global and local perspective, large and small industry segments. It is an informative forecast, useful for practitioners as a trusted and upto-date reference.”
Y.N Ltd
Association of Dutch Suppliers in the Oil & Gas Industry
Society of Naval Architects & Marine Engineers
Association of Diving Contractors
Association of Diving Contractors International
Associazione Imprese Subacquee Italiane
Australian Petroleum Production & Exploration Association
Brazilian Association of Offshore Support Companies
Brazilian Petroleum Institute
Canadian Energy Pipeline
Diving Medical Advisory Committee
European Diving Technology Committee
French Oil and Gas Industry Council
IMarEST – Institute of Marine Engineering, Science & Technology
International Association of Drilling Contractors
International Association of Geophysical Contractors
International Association of Oil & Gas Producers
International Chamber of Shipping
International Shipping Federation
International Marine Contractors Association
International Tanker Owners Pollution Federation
Leading Oil & Gas Industry Competitiveness
Maritime Energy Association
National Ocean Industries Association
Netherlands Oil and Gas Exploration and Production Association
NOF Energy
Norsk olje og gass Norwegian Oil and Gas Association
Offshore Contractors’ Association
Offshore Mechanical Handling Equipment Committee
Oil & Gas UK
Oil Companies International Marine Forum
Ontario Petroleum Institute
Organisation of the Petroleum Exporting Countries
Regional Association of Oil and Natural Gas Companies in Latin America and the Caribbean
Society for Underwater Technology
Society of Maritime Industries
Society of Petroleum Engineers
Society of Petroleum Enginners – Calgary
Step Change in Safety
Subsea UK
The East of England Energy Group
UK Petroleum Industry Association
All the events postponed due to COVID-19.
Don’t Miss Out!
Latest Energy news
Energy as a Service (EaaS) Market
The global Energy as a Service (EaaS) market is projected to grow at a CAGR of 12.6% by 2034
25 July 2024
Synthetic Fuels Market
The global Synthetic Fuels market is projected to grow at a CAGR of 23% by 2034
18 July 2024
Power-to-X (P2X) Market
The global Power-to-X (P2X) market is projected to grow at a CAGR of 10.6% by 2034
09 July 2024
Airborne Wind Energy Market
The global Airborne Wind Energy market is projected to grow at a CAGR of 9.7% by 2034
05 June 2024


