Growing developments/contracts related to submarine power cables coupled year-on-year deployment of underwater cables across the globe has led Visiongain to publish this unique report, which is crucial to your companies improved success. I thought it would be of interest to you.
Did you know?
• Globally, more than 1.2 million kilometres submarine power cables are in place/laid
• More than 350 submarine power cable projects are operational
• Offshore wind power-based submarine cables remain the major end-user
Visiongain assesses that Capex and length of the global submarine power cables will reach $16.1 bn and 2.5 million kilometres in 2030. Planned and future contracts is expected to trigger the investments into the submarine power cable industry. Cable manufacturers, raw material suppliers, services providers, cable installers are expected to benefit due to phase-wise deployment of planned projects.
Reasons why you must order and read this report today:
1. Underwater cable industry outlook
2. Value chain analysis of the role of each stakeholder in submarine power cable industry
3. Role of high voltage and low voltage cables
4. List of Operational projects, planned, and upcoming projects
5. U.S. and Europe likely be the most promising Markets
6. Government Regulations
Included in the report is a lengthy discussion of the existing and upcoming submarine power cable. The report includes 10 years forecast (upon which the CapEx and capacity forecasts are based), as well as laying out different types of type, cable material type, voltage type, end-user type preferred for submarine power cable business.
The report provides detailed profiles of key companies operating within the Submarine Power Cables market:
• Nexans
• Prysmian Group
• NKT A/S
• Furukawa Electric Co., LTD
• ZTT as well as key analysis and assessment of other important players
This independent, 200+ page report guarantees you will remain better informed than your competition. With 200 tables and figures examining the submarine power cable market space, the report gives you a visual, one-stop breakdown of your market. PLUS capital expenditure and volume forecasts, as well as analysis, from 2020-2030 keeps your knowledge that one step ahead that you require to succeed.
This report is essential reading for you or anyone in the energy sector with an interest in nuclear power. Purchasing this report today will help you to recognise those important market opportunities and understand the possibilities there. I look forward to receiving your order.
Visiongain is a trading partner with the US Federal Government
CCR Ref number: KD4R6
Do you have any custom requirements we can help you with? Any need for specific country, geo region, market segment or specific company information? Contact us today, we can discuss your needs and see how we can help: sara.peerun@visiongain.com
1. Report Overview
1.1 Submarine Power Cables Market Overview
1.2 Market Segmentation and Scope
1.3 Why You Should Read This Report
1.4 How This Report Delivers
1.5 Key Questions Answered by This Analytical Report Include
1.6 Who is This Report For?
1.7 Methodology
1.7.1 Primary Research
1.7.2 Secondary Research
1.7.3 Market Evaluation & Forecasting Methodology
1.8 Frequently Asked Questions (FAQ)
1.9 Associated Visiongain Reports
1.10 About Visiongain
2. Introduction to the Submarine Power Cables Market
2.1 Global Submarine Power Cables Market Structure
2.2 Market Definition
2.3 Submarine Power Cable System Outlook
2.4 Submarine Power Cables- Regulatory Scenario
3. Global Overview of Submarine Power Cables Market
3.1 Regional Overview of Submarine Power Cables Market 2019-2030
3.1 Global Submarine Power Cables Market Drivers and Restraints
3.3 Submarine Power Cables- CAPEX & Installation Cost (IC) Analysis
3.4 SWOT Analysis:Global Submarine Power Cables
4. Global Submarine Power Cables Submarkets Forecast 2020-2030
4.1 Global Submarine Power Cables Submarkets Forecast, by Type 2020-2030
4.1.1 Global Submarine Power Cables Market, by Single Core Forecasts 2020-2030
4.1.2 Global Submarine Power Cables Market, by Multicore Forecasts 2020-2030
4.2 Global Submarine Power Cables Submarkets Forecast, by Conductor Type 2020-2030
4.2.1 Global Submarine Power Cables Market, by Aluminum Forecasts 2020-2030
4.2.2 Global Submarine Power Cables Market, by Copper Forecasts 2020-2030
4.3 Global Submarine Power Cables Submarkets Forecast, by Voltage Type 2020-2030
4.3.1 Global Submarine Power Cables Market, by High (500KV and Above) Forecasts 2020-2030
4.3.2 Global Submarine Power Cables Market, by Medium (Below 500 KV) Forecasts 2020-2030
4.4 Global Submarine Power Cables Submarkets Forecast, by End-user Type 2020-2030
4.4.1 End-User Segment Overview
4.4.2.1 Global Submarine Power Cables Market, by Inter-Country & Island Connection Forecasts 2020-2030
4.4.2 Global Submarine Power Cables Market, by Offshore Oil & Gas Forecasts 2020-2030
4.4.3 Global Submarine Power Cables Market, by Offshore Wind Power Generation Forecasts 2020-2030
5. Leading Nations in Submarine Power Cables Market 2020-2030
5.1 North America Submarine Power Cables Market Forecast 2020-2030
5.1.1 North America Submarine Power Cables Submarket Forecast 2020-2030
5.1.1.1 North America Submarine Power Cables Market Forecast by Type 2020-2030
5.1.1.2 North America Submarine Power Cables Market Forecast by Conductor Type 2020-2030
5.1.1.3 North America Submarine Power Cables Market Forecast by Voltage 2020-2030
5.1.1.4 North America Submarine Power Cables Market Forecast by End-user 2020-2030
5.1.1.5 North America Submarine Power Cables Market Forecast by Country 2020-2030
5.1.2 North America Submarine Power Cables Market Analysis
5.2 Europe Submarine Power Cables Market Forecast 2020-2030
5.2.1 Europe Submarine Power Cables Submarket Forecast 2020-2030
5.2.1.1 Europe Submarine Power Cables Market Forecast by Type 2020-2030
5.2.1.2 Europe Submarine Power Cables Market Forecast by Conductor Type 2020-2030
5.2.1.3 Europe Submarine Power Cables Market Forecast by Voltage 2020-2030
5.2.1.4 Europe Submarine Power Cables Market Forecast by End-user 2020-2030
5.2.1.5 Europe Submarine Power Cables Market Forecast by Country 2020-2030
5.2.2 Europe Submarine Power Cables Market Analysis
5.3 Asia Pacific Submarine Power Cables Market Forecast 2020-2030
5.3.1 Asia Pacific Submarine Power Cables Submarket Forecast 2020-2030
5.3.1.1 Asia Pacific Submarine Power Cables Market Forecast by Type 2020-2030
5.3.1.2 Asia Pacific Submarine Power Cables Market Forecast by Conductor Type 2020-2030
5.3.1.3 Asia Pacific Submarine Power Cables Market Forecast by Voltage 2020-2030
5.3.1.4 Asia Pacific Submarine Power Cables Market Forecast by End-user 2020-2030
5.3.1.5 Asia Pacific Submarine Power Cables Market Forecast by Country 2020-2030
5.3.2 Asia Pacific Submarine Power Cables Market Analysis
5.4 Middle East & Africa Submarine Power Cables Market Forecast 2020-2030
5.4.1 Middle East & Africa Submarine Power Cables Submarket Forecast 2020-2030
5.4.1.1 Middle East & Africa Submarine Power Cables Market Forecast by Type 2020-2030
5.4.1.2 Middle East & Africa Submarine Power Cables Market Forecast by Conductor Type 2020-2030
5.4.1.3 Middle East & Africa Submarine Power Cables Market Forecast by Voltage 2020-2030
5.4.1.4 Middle East & Africa Submarine Power Cables Market Forecast by End-user 2020-2030
5.4.1.5 Middle East & Africa Submarine Power Cables Market Forecast by Country 2020-2030
5.4.2 Middle East & Africa Submarine Power Cables Market Analysis
5.5 Latin America Submarine Power Cables Market Forecast 2020-2030
5.5.1 Latin America Submarine Power Cables Submarket Forecast 2020-2030
5.5.1.1 Latin America Submarine Power Cables Market Forecast by Type 2020-2030
5.5.1.2 Latin America Submarine Power Cables Market Forecast by Conductor Type 2020-2030
5.5.1.3 Latin America Submarine Power Cables Market Forecast by Voltage 2020-2030
5.5.1.4 Latin America Submarine Power Cables Market Forecast by End-user 2020-2030
5.5.1.5 Latin America Submarine Power Cables Market Forecast by Country 2020-2030
5.5.2 Latin America Submarine Power Cables Market Analysis
6. PEST Analysis of the Submarine Power Cables Market
7. Leading Companies in Submarine Power Cables Market
7.1 Furukawa Electric Co., LTD.
7.1.1 Business Overview
7.1.2 Recent Development
7.1.3 Business Strategy
7.2 Hengtong Marine Cable Systems
7.2.1 Business Overview
7.2.2 Recent Development
7.2.3 Business Strategy
7.3 KEI Industries Limited
7.3.1 Business Overview
7.3.2 Business Strategy
7.4 LS Cable & System Ltd.
7.4.1 Business Overview
7.4.2 Recent Developments
7.4.3 Business Strategy
7.5 Nexans
7.5.1 Business Overview
7.5.2 Recent Developments
7.5.3 Business Strategy
7.6 NKT A/S
7.7Prysmian Group
7.7.1 Business Overview
7.7.2 Recent Developments
7.7.3 Business Strategy
7.8 Sumitomo Electric Industries, Ltd.
7.8.1 Business Overview
7.8.2 Recent Developments
7.8.3 Business Strategy
7.9 TFKable
7.9.1 Business Overview
7.9.2 Recent Developments
7.9.3 Business Strategy
7.10 ZTT
7.10.1 Business Overview
7.10.2 Recent Developments
7.10.3 Business Strategy
8. Conclusion & Recommendations
8.1 Recommendations
9. Glossary
Associated Visiongain Reports
Visiongain Report Sales Order Form
Appendix A
List of Worldwide Layed Submarine Cables
About Visiongain
Appendix B
List of Tables
Table 3.1 Global Submarine Power Cables Market Forecast 2020-2030 ($ mn, Thousand Kilometers, AGR %, CAGR %, Cumulative)
Table 3.2 Global Submarine Power Cables Marketby Regional Forecast 2020-2030 ($mn, AGR %, CAGR %, Cumulative)
Table 3.3 Global Submarine Power Cables Marketby Regional Forecast 2020-2030 (Thousand Kilometers), AGR %, CAGR %, Cumulative)
Table 3.4 Global Submarine Power Cables Market Drivers and Restraints
Table 3.5 Global Submarine Power Cables- List of Key Planned Projects
Table 3.6 Preliminary Cost Estimates (US$)- 345 kV Submarine Cable, Capital Expenditure (CAPEX) and Installation Cost Analysis
Table 3.7 SWOT Analysis, Submarine Power Cables Market
Table 5.4 Global Submarine Power Cables Market, by Type Forecast 2020-2030($mn, “000” Kilometers, AGR %, Cumulative, 2020-2030
Table 4.2 Global Submarine Power Cables Market, by Single Core Forecast 2020-2030($mn, AGR %, CAGR %, Cumulative)
Table 4.3 Global Submarine Power Cables Market, by Single Core Driver & Restraints
Table 4.4 Global Submarine Power Cables Market, by Multicore Forecasts 2020-2030($mn, AGR %, CAGR %, Cumulative)
Table 4.5 Global Submarine Power Cables Market, by Multicore Drivers and Restraints
Table 4.6 Gloabl Submarine Power Cables Market, by Conductor Type Forecast 2020-2030($mn, “000” Kilometers AGR %, Cumulative, 2020-2030
Table 4.7 Global Submarine Power Cables Market, by Aluminum Forecast 2020-2030($mn, AGR %, CAGR %, Cumulative)
Table 4.8 Global Submarine Power Cables Market, by Aluminum Driver & Restraints
Table 4.9 Global Submarine Power Cables Market, by Copper Forecasts 2020-2030 ($mn, AGR %, CAGR %, Cumulative)
Table 4.10 Global Submarine Power Cables Market, by Copper Drivers and Restraints
Table 4.11 Global Submarine Power Cables Market, by Voltage Type Forecast 2020-2030($mn, AGR %, Cumulative, 2020-2030
Table 4.12 Global Submarine Power Cables Market, by High (500KV and Above) Forecast 2020-2030($mn, AGR %, CAGR %, Cumulative)
Table 4.13 Global Submarine Power Cables Market, by High (500KV and Above) Driver & Restraints
Table 4.14 Global Submarine Power Cables Market, by Medium (Below 500 KV) Forecasts 2020-2030($mn, AGR %, CAGR %, Cumulative)
Table 4.15 Global Submarine Power Cables Market, by Medium (Below 500 KV) Drivers and Restraints
Table 4.16 Global Submarine Power Cables Market, by End-user Type Forecast 2020-2030($mn, AGR %, Cumulative, 2020-2030
Table 4.17 Global Submarine Power Cables Market, by Inter-Country & Island Connection Forecast 2020-2030($mn, AGR %, CAGR %, Cumulative)
Table 4.18 Global Submarine Power Cables Market, by Inter-Country & Island Connection Driver & Restraints
Table 4.19 Global Submarine Power Cables Market, by Offshore Oil & Gas Forecasts 2020-2030($mn, AGR %, CAGR %, Cumulative)
Table 4.20 Global Submarine Power Cables Market, by Offshore Oil & Gas Drivers and Restraints
Table 4.21 Global Submarine Power Cables Market, by Offshore Wind Power Generation Forecasts 2020-2030($mn, AGR %, CAGR %, Cumulative)
Table 4.22 Global Submarine Power Cables Market, by Offshore Wind Power Generation Drivers and Restraints
Table 5.3 North America Submarine Power Cables Market Forecast 2020-2030($mn, AGR %, CAGR %, Cumulative)
Table 5.4 North America Submarine Power Cables Market, by Type Forecast 2020-2030($mn, AGR %, Cumulative, 2020-2030
Table 5.5 North America Submarine Power Cables Market, by Conductor Type Forecast 2020-2030($mn, AGR %, Cumulative, 2020-2030
Table 5.6 North America Submarine Power Cables Market, by Voltage Forecast 2020-2030($mn, AGR %, Cumulative, 2020-2030
Table 5.7 North America Submarine Power Cables Market, by End-user Forecast 2020-2030($mn, AGR %, Cumulative, 2020-2030
Table 5.8 North America Submarine Power Cables Market, by Country Forecast 2020-2030($mn, AGR %, Cumulative, 2020-2030
Table 5.9 Europe Submarine Power Cables Market Forecast 2020-2030 ($mn, “000” Kilometers, AGR %, CAGR %, Cumulative)
Table 5.10 Europe Submarine Power Cables Market, by Type Forecast 2020-2030($mn, AGR %, Cumulative, 2020-2030
Table 5.11 Europe Submarine Power Cables Market, by Conductor Type Forecast 2020-2030($mn, AGR %, Cumulative, 2020-2030
Table 5.12 Europe Submarine Power Cables Market, by Voltage Forecast 2020-2030($mn, AGR %, Cumulative, 2020-2030
Table 5.13 Europe Submarine Power Cables Market, by End-user Forecast 2020-2030($mn, AGR %, Cumulative, 2020-2030
Table 5.14 Europe Submarine Power Cables Market, by Country Forecast 2020-2030($mn, AGR %, Cumulative, 2020-2030
Table 5.15 Europe Submarine Power Cables Market, by Country Forecast 2020-2030(“000” Kilometers, AGR %, Cumulative, 2020-2030
Table 5.16 Asia Pacific Submarine Power Cables Market Forecast 2020-2030 ($mn, “000” Kilometers, AGR %, CAGR %, Cumulative)
Table 5.17 Asia Pacific Submarine Power Cables Market, by Type Forecast 2020-2030($mn, AGR %, Cumulative, 2020-2030
Table 5.18 Asia Pacific Submarine Power Cables Market, by Conductor Type Forecast 2020-2030($mn, AGR %, Cumulative, 2020-2030
Table 5.19 Asia Pacific Submarine Power Cables Market, by Voltage Forecast 2020-2030($mn, AGR %, Cumulative, 2020-2030
Table 5.20 Asia Pacific Submarine Power Cables Market, by End-user Forecast 2020-2030($mn, AGR %, Cumulative, 2020-2030
Table 5.21 Asia Pacific Submarine Power Cables Market, by Country Forecast 2020-2030 ($mn, AGR %, Cumulative, 2020-2030
Table 5.22 Asia Pacific Submarine Power Cables Market, by Country Forecast 2020-2030(“000” Kilometers, AGR %, Cumulative, 2020-2030
Table 5.23 Asia Pacific Submarine Power Cables Market Forecast 2020-2030 ($mn, “000” Kilometers, AGR %, CAGR %, Cumulative)
Table 5.24 Middle East & Africa Submarine Power Cables Market, by Type Forecast 2020-2030($mn, AGR %, Cumulative, 2020-2030
Table 5.25 Middle East & Africa Submarine Power Cables Market, by Conductor Type Forecast 2020-2030($mn, AGR %, Cumulative, 2020-2030
Table 5.26 Middle East & Africa Submarine Power Cables Market, by Voltage Forecast 2020-2030($mn, AGR %, Cumulative, 2020-2030
Table 5.27 Middle East & Africa Submarine Power Cables Market, by End-user Forecast 2020-2030($mn, AGR %, Cumulative, 2020-2030
Table 5.28 Middle East & Africa Submarine Power Cables Market, by Country Forecast 2020-2030($mn, AGR %, Cumulative, 2020-2030
Table 5.29 Middle East & Africa Submarine Power Cables Market, by Country Forecast 2020-2030(“000” Kilometers, AGR %, Cumulative, 2020-2030
Table 5.23 Asia Pacific Submarine Power Cables Market Forecast 2020-2030 ($mn, “000” Kilometers, AGR %, CAGR %, Cumulative)
Table 5.31 Latin America Submarine Power Cables Market, by Type Forecast 2020-2030($mn, AGR %, Cumulative, 2020-2030
Table 5.32 Latin America Submarine Power Cables Market, by Conductor Type Forecast 2020-2030($mn, AGR %, Cumulative, 2020-2030
Table 5.33 Latin America Submarine Power Cables Market, by Voltage Forecast 2020-2030($mn, AGR %, Cumulative, 2020-2030
Table 5.34 Latin America Submarine Power Cables Market, by End-user Forecast 2020-2030($mn, AGR %, Cumulative, 2020-2030
Table 5.35 Latin America Submarine Power Cables Market, by Country Forecast 2020-2030($mn, AGR %, Cumulative, 2020-2030
Table 5.36 Latin America Submarine Power Cables Market, by Country Forecast 2020-2030(“000” Km, AGR %, Cumulative, 2020-2030)
Table 6.1 PEST Analysis, Submarine Power Cables Market
Table 7.1 Furukawa Electric Co., LTD. Profile 2018 (Market Entry, Public/Private, Headquarter, Total Company Sales $bn, Change in Revenue, Geography, Key Market, Company Sales from Submarine Power Cables Market, Listed on, Products/Services Strongest Business Region, Business Segment in the Market, Submarket Involvement, No. of Employees)
Table 7.2 Furukawa Electric Co., LTD. Total Company Sales 2014-2018 ($bn, AGR %)
Table 7.3Hengtong Marine Cable Systems Profile 2018 (Market Entry, Public/Private, Headquarter, Total Company Sales $bn, Change in Revenue, Geography, Key Market, Company Sales from Submarine Power Cables Market, Listed on, Products/Services Strongest Business Region, Business Segment in the Market, Submarket Involvement, No. of Employees)
Table 7.4 KEI Industries Limited Profile 2018 (Market Entry, Public/Private, Headquarter, Total Company Sales $bn, Change in Revenue, Geography, Key Market, Company Sales from Submarine Power Cables Market, Listed on, Products/Services Strongest Business Region, Business Segment in the Market, Submarket Involvement, No. of Employees)
Table 7.5KEI Industries Limited Total Company Sales 2014-2018 ($bn, AGR %)
Table 7.6 LS Cable & System Ltd. Profile 2018 (Market Entry, Public/Private, Headquarter, Total Company Sales US$b, Change in Revenue, Geography, Key Market, Company Sales from Submarine Power Cables Market, Listed on, Products/Services Strongest Business Region, Business Segment in the Market, Submarket Involvement, No. of Employees)
Table 7.7LS Cable & System Ltd. Total Company Sales 2014-2018 ($ bn, AGR %)
Table 7.8Nexans Profile 2018 (Market Entry, Public/Private, Headquarter, Total Company Sales US$b, Change in Revenue, Geography, Key Market, Company Sales from Submarine Power Cables Market, Listed on, Products/Services Strongest Business Region, Business Segment in the Market, Submarket Involvement, No. of Employees)
Table 7.9Nexans Total Company Sales 2014-2018 ($ bn, AGR %)
Table 7.10 NKT A/S Profile 2018(Market Entry,Public/Private, Headquarter, Total Company Sales $bn, Change in Revenue, Geography, Key Market, Company Sales from Submarine Power Cables Market, Listed on, Products/Services Strongest Business Region, Business Segment in the Market, Submarket Involvement, No. of Employees)
Table 7. 11 NKT A/S Total Company Sales 2014-2018 ($bn, AGR %)
Table 7.12Prysmian Group Profile 2018(Market Entry, Public/Private, Headquarter, Total Company Sales $bn, Change in Revenue, Geography, Key Market, Company Sales from Submarine Power Cables Market, Listed on, Products/Services Strongest Business Region, Business Segment in the Market, Submarket Involvement, No. of Employees)
Table 7.13Prysmian Group, Total Company Sales 2014-2018 ($bn, AGR %)
Table 7.14 Sumitomo Electric Industries, Ltd. Profile 2018 (Market Entry, Public/Private, Headquarter, Total Company Sales $bn, Change in Revenue, Geography, Key Market, Company Sales from Submarine Power Cables Market, Listed on, Products/Services Strongest Business Region, Business Segment in the Market, Submarket Involvement, No. of Employees)
Table 7.15Sumitomo Electric Industries Ltd. Total Company Revenue 2014-2018 ($bn, AGR %)
Table 7.16TFKable Profile 2018 (Market Entry, Public/Private, Headquarter, Total Company Sales $bn, Change in Revenue, Geography, Key Market, Company Sales from Submarine Power Cables Market, Listed on, Products/Services Strongest Business Region, Business Segment in the Market, Submarket Involvement, No. of Employees)
Table 7.17 ZTT Profile 2018 (Market Entry, Public/Private, Headquarter, Total Company Sales $bn, Change in Revenue, Geography, Key Market, Company Sales from Submarine Power Cables Market, Listed on, Products/Services Strongest Business Region, Business Segment in the Market, Submarket Involvement, No. of Employees)
Table 3.5 List of Layed Submarine Power Cables Worldwide
List of Figures
Figure 3.1 Global Submarine Power Cables Market Forecast 2020-2030 ($ mn, AGR %)
Figure 3.2 Global Submarine Power Cables Market Forecast 2020-2030 (“000” Kilometers, AGR %)
Figure 3.3 Regional Submarine Power Cables Market Forecast 2020-2030 (“000” Kilometers)
Figure 3.4 Regional Submarine Power Cables Market Forecast 2020-2030 ($mn)
Figure 3.5 Global Submarine Power Cables Market by Regional % Share Forecast 2020, 2025, 2030 (CAPEX)
Figure 4.1 Global Submarine Power Cables, by Type Submarket Forecast 2020-2030 ($mn)
Figure 4.2 Global Submarine Power Cables Market by Type (CAPEX) Share Forecast 2020, 2025, 2030 (% Share)
Figure 4.3 Global Submarine Power Cables Market, By Single Core Forecast 2020-2030 ($mn, AGR%)
Figure 4.4 Submarine Power Cables Market, By Multicore Forecast 2020-2030 ($mn, AGR%)
Figure 4.5 Global Submarine Power Cables Market, Comparison Matrix, by Type VS Region (Comparison Matric)
Figure 4.6 Global Submarine Power Cables,by Conductor Type Submarket Forecast 2020-2030 ($mn)
Figure 4.7 Global Submarine Power Cables Market by Conductor Type (CAPEX) Share Forecast 2020, 2025, 2030 (% Share)
Figure 4.8 Global Submarine Power Cables Market, By Aluminum Forecast 2020-2030 ($mn, AGR%)
Figure 4.9 Submarine Power Cables Market, By Copper Forecast 2020-2030 ($mn, AGR%)
Figure 4.10 Global Submarine Power Cables Market, Comparison Matrix, by Conductor Type VS Region (Comparison Matric)
Figure 4.11 Global Submarine Power Cables,by Voltage Type Submarket Forecast 2020-2030 ($mn)
Figure 4.12 Global Submarine Power Cables Market by Voltage Type (CAPEX) Share Forecast 2020, 2025, 2030 (% Share)
Figure 4.13 Global Submarine Power Cables Market, By High (500KV and Above) Forecast 2020-2030 ($mn, AGR%)
Figure 4.14 Submarine Power Cables Market, By Medium (Below 500 KV) Forecast 2020-2030 ($mn, AGR%)
Figure 4.15 Global Submarine Power Cables Market, Comparison Matrix, by Voltage Type VS Region (Comparison Matric)
Figure 4.16 Global Submarine Power Cables,by End-user Type Submarket Forecast 2020-2030 ($mn)
Figure 4.17 Global Submarine Power Cables Market by End-user Type Type (CAPEX) Share Forecast 2020, 2025, 2030 (% Share)
Figure 4.18 Global Submarine Power Cables Market, By Inter-Country & Island Connection Forecast 2020-2030 ($mn, AGR%)
Figure 4.19 Submarine Power Cables Market, By Offshore Oil & Gas Forecast 2020-2030 ($mn, AGR%)
Figure 4.20 Submarine Power Cables Market, By Offshore Wind Power Generation Forecast 2020-2030 ($mn, AGR%)
Figure 4.21 Global Submarine Power Cables Market, Comparison Matrix, by End-user VS Region (Comparison Matric)
Figure 5.1 Leading Country/Regional Submarine Power Cables Market Share Forecast 2020 (% Share)
Figure 5.2 Leading Country/Regional Submarine Power Cables Market ShareForecast 2025 (% Share)
Figure 5.3 Leading Country/Regional Submarine Power Cables Market Share Forecast 2030 (% Share)
Figure 5.4 North America Submarine Power Cables Market Forecast 2020-2030 (“000” Kilometers, AGR%)
Figure 5.5 North America Submarine Power Cables Market Forecast 2020-2030 ($mn, AGR%)
Figure 5.6 North America Submarine Power Cables Market Share Forecast 2020, 2025, 2030(% Share)
Figure 5.7 North America Submarine Power Cables Market Forecast 2020-2030, by Type($mn, AGR%)
Figure 5.8 North America Submarine Power Cables Market Share Forecast 2020, 2025, 2030 (% Share), by Type
Figure 5.9 North America Submarine Power Cables Market Forecast 2020-2030, by Conductor Type ($mn, AGR%)
Figure 5.10 North America Submarine Power Cables Market Share Forecast 2020, 2025, 2030(% Share), by Conductor Type
Figure 5.11 North America Submarine Power Cables Market Forecast 2020-2030, by Voltage ($mn, AGR%)
Figure 5.12 North America Submarine Power Cables Market Share Forecast 2020, 2025, 2030(% Share), by Voltage
Figure 5.13 North America Submarine Power Cables Market Forecast 2020-2030, by End-user ($mn, AGR%)
Figure 5.14 North America Submarine Power Cables Market Share Forecast 2020, 2025, 2030(% Share), by End-user
Figure 5.15 North America Submarine Power Cables Market Forecast 2020-2030, by Country ($mn, AGR%)
Figure 5.16 North America Submarine Power Cables Market Share Forecast 2020, 2025, 2030(% Share), by Country
Figure 5.17 Europe Submarine Power Cables Market Forecast 2020-2030 (“000” Kilometers, AGR%)
Figure 5.18 Europe Submarine Power Cables Market Forecast 2020-2030 ($mn, AGR%)
Figure 5.19 Europe Submarine Power Cables Market Share Forecast 2020, 2025, 2030(% Share)
Figure 5.20 Europe Submarine Power Cables Market Forecast 2020-2030, by Type($mn, AGR%)
Figure 5.21 Europe Submarine Power Cables Market Share Forecast 2020, 2025, 2030 (% Share), by Type
Figure 5.22 Europe Submarine Power Cables Market Forecast 2020-2030, by Conductor Type ($mn, AGR%)
Figure 5.23 Europe Submarine Power Cables Market Share Forecast 2020, 2025, 2030(% Share), by Conductor Type
Figure 5.24 Europe Submarine Power Cables Market Forecast 2020-2030, by Voltage ($mn, AGR%)
Figure 5.25 Europe Submarine Power Cables Market Share Forecast 2020, 2025, 2030(% Share), by Voltage
Figure 5.26 Europe Submarine Power Cables Market Forecast 2020-2030, by End-user ($mn, AGR%)
Figure 5.27 Europe Submarine Power Cables Market Share Forecast 2020, 2025, 2030(% Share), by End-user
Figure 5.28 Europe Submarine Power Cables Market Forecast 2020-2030, by Country ($mn, AGR%)
Figure 5.29 Europe Submarine Power Cables Market Share Forecast 2020, 2025, 2030(% Share), by Country
Figure 5.30 Asia Pacific Submarine Power Cables Market Forecast 2020-2030 (“000” Kilometers, AGR%)
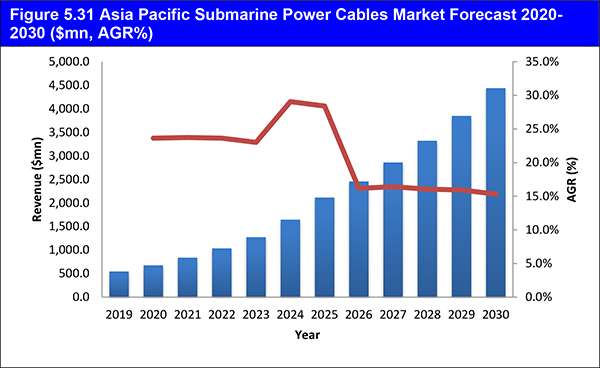
Figure 5.31 Asia Pacific Submarine Power Cables Market Forecast 2020-2030 ($mn, AGR%)
Figure 5.32 Asia Pacific Submarine Power Cables Market Share Forecast 2020, 2025, 2030(% Share)
Figure 5.33 Asia Pacific Submarine Power Cables Market Forecast 2020-2030, by Type($mn, AGR%)
Figure 5.34 Asia Pacific Submarine Power Cables Market Share Forecast 2020, 2025, 2030 (% Share), by Type
Figure 5.35 Asia Pacific Submarine Power Cables Market Forecast 2020-2030, by Conductor Type ($mn, AGR%)
Figure 5.36 Asia Pacific Submarine Power Cables Market Share Forecast 2020, 2025, 2030(% Share), by Conductor Type
Figure 5.37 Asia Pacific Submarine Power Cables Market Forecast 2020-2030, by Voltage ($mn, AGR%)
Figure 5.38 Asia Pacific Submarine Power Cables Market Share Forecast 2020, 2025, 2030(% Share), by Voltage
Figure 5.39 Asia Pacific Submarine Power Cables Market Forecast 2020-2030, by End-user ($mn, AGR%)
Figure 5.40 Asia Pacific Submarine Power Cables Market Share Forecast 2020, 2025, 2030(% Share), by End-user
Figure 5.41 Asia Pacific Submarine Power Cables Market Forecast 2020-2030, by Country ($mn, AGR%)
Figure 5.42 Asia Pacific Submarine Power Cables Market Share Forecast 2020, 2025, 2030(% Share), by Country
Figure 5.43 Middle East & Africa Submarine Power Cables Market Forecast 2020-2030 (“000” Kilometers, AGR%)
Figure 5.44 Middle East & Africa Submarine Power Cables Market Forecast 2020-2030 ($mn, AGR%)
Figure 5.45 Middle East & Africa Submarine Power Cables Market Share Forecast 2020, 2025, 2030(% Share)
Figure 5.46 Middle East & Africa Submarine Power Cables Market Forecast 2020-2030, by Type ($mn, AGR%)
Figure 5.47 Middle East & Africa Submarine Power Cables Market Share Forecast 2020, 2025, 2030 (% Share), by Type
Figure 5.48 Middle East & Africa Submarine Power Cables Market Forecast 2020-2030, by Conductor Type ($mn, AGR%)
Figure 5.49 Middle East & Africa Submarine Power Cables Market Share Forecast 2020, 2025, 2030(% Share), by Conductor Type
Figure 5.50 Middle East & Africa Submarine Power Cables Market Forecast 2020-2030, by Voltage ($mn, AGR%)
Figure 5.51 Middle East & Africa Submarine Power Cables Market Share Forecast 2020, 2025, 2030(% Share), by Voltage
Figure 5.52 Middle East & Africa Submarine Power Cables Market Forecast 2020-2030, by End-user ($mn, AGR%)
Figure 5.53 Middle East & Africa Submarine Power Cables Market Share Forecast 2020, 2025, 2030(% Share), by End-user
Figure 5.54 Middle East & Africa Submarine Power Cables Market Forecast 2020-2030, by Country ($mn, AGR%)
Figure 5.55 Middle East & Africa Submarine Power Cables Market Share Forecast 2020, 2025, 2030(% Share), by Country
Figure 5.56 Latin America Submarine Power Cables Market Forecast 2020-2030 (“000” Kilometers, AGR%)
Figure 5.57 Latin America Submarine Power Cables Market Forecast 2020-2030 ($mn, AGR%)
Figure 5.58 Latin America Submarine Power Cables Market Share Forecast 2020, 2025, 2030(% Share)
Figure 5.59 Latin America Submarine Power Cables Market Forecast 2020-2030, by Type($mn, AGR%)
Figure 5.60 Latin America Submarine Power Cables Market Share Forecast 2020, 2025, 2030 (% Share), by Type
Figure 5.61 Latin America Submarine Power Cables Market Forecast 2020-2030, by Conductor Type ($mn, AGR%)
Figure 5.62 Latin America Submarine Power Cables Market Share Forecast 2020, 2025, 2030(% Share), by Conductor Type
Figure 5.63 Latin America Submarine Power Cables Market Forecast 2020-2030, by Voltage ($mn, AGR%)
Figure 5.64 Latin America Submarine Power Cables Market Share Forecast 2020, 2025, 2030(% Share), by Voltage
Figure 5.65 Latin America Submarine Power Cables Market Forecast 2020-2030, by End-user ($mn, AGR%)
Figure 5.66 Latin America Submarine Power Cables Market Share Forecast 2020, 2025, 2030(% Share), by End-user
Figure 5.67 Latin America Submarine Power Cables Market Forecast 2020-2030, by Country ($mn, AGR%)
Figure 5.68 Latin America Submarine Power Cables Market Share Forecast 2020, 2025, 2030(% Share), by Country
Figure 7.0 Global Submarine Power Cables Company Market (%) Share, 2018
Figure 7.1 Furukawa Electric Co., LTD. Total Company Revenue, ($bn& AGR %), 2014-2018
Figure 7.2 Furukawa Electric Co., LTD. % Revenue Share, by Regional Segment, 2018
Figure 7.3 Furukawa Electric Co., LTD. % Revenue Share, by Business Segment, 2018
Figure 7.4KEI Industries Limited. Total Company Revenue, ($bn& AGR %), 2014-2018
Figure 7.5KEI Industries Limited. % Revenue Share, by Products, 2018
Figure 7.6LS Cable & System Ltd., Revenue, ($bn& AGR %), Y-o-Y Revenue Growth, 2014-2018
Figure 7.7 Nexans Revenue, ($bn& AGR %), Y-o-Y Revenue Growth, 2014-2018
Figure 7.8 Nexans % Revenue Share, by Business Segment, 2018
Figure 7.9 Nexans % Revenue Share, by Business Environment, 2018
Figure 7.10 NKT A/S Company Revenue, ($bn& AGR %), 2014-2018
Figure 7.11 NKT A/S % Revenue Share, by Regional Segment, 2018
Figure 7.12 NKT A/S % Revenue Share, by Business Segment, 2018
Figure 7.13Prysmian Group, Company Revenue, ($bn& AGR %), 2014-2018
Figure 7.14Prysmian Group, % Revenue Share, by Regional Segment, 2018
Figure 7.15Prysmian Group, % Revenue Share, by Business Segment, 2018
Figure 7.16 Sumitomo Electric Industries, Ltd.Total Company Revenue, ($bn& AGR %), 2014-2018
Figure 7.17Sumitomo Electric Industries, Ltd., % Revenue Share, by Business Segment, 2018
Figure 7.18TFKable, % Revenue Share, by Business Segment, 2018
Figure 7.19TFKable, % Revenue Share, by Regional Segment, 2018
Figure 8.1 Global Submarine Power Cables Market Forecast 2020-2030 ($ mn, AGR %)
ABB
AEI Cables
Belden
Benchmarking
Cablel Hellenic Cables Group
Furukawa Electric
Gaon Cable
General Cable Corporation
Hangzhou Cable
Hengtong Group
Hydro Group
JDR Cables
KEI Industries
LS Cable & System
NKT
NXT
Prysmian, Nexans
Southwire
Sumitomo Electric
TE Subcom
Tele-Fonika Kable
TMC
ZTT
Organisations/Association Mentioned in This Report
UK Environment Agency (EA)
United Nations – Convention on Climate Change (UNFCCC)
United Nations (UN)
North American Submarine Cable Association (NASCA)
International Cable Protection Committee (ICPC)
Renewables Grid Initiative (RGI)