Industries > Energy > Small Scale Liquefied Natural Gas (LNG) Market Forecast 2018-2028
Small Scale Liquefied Natural Gas (LNG) Market Forecast 2018-2028
Forecast by Capex ($mn) and Capacity (MTPA), by Type (Liquefaction, Regasification, Satellite Station, Bunkering Facilities for Vessels & Fueling), by Geography, Plus Profiles of Leading Companies Small Scale Liquefied Natural Gas (LNG) Market
Visiongain has calculated that the global Small Scale Liquefied Natural Gas (LNG) Market will see a capital expenditure (CAPEX) of $4,627.8 mn in 2018. Read on to discover the potential business opportunities available.
Small Scale LNG is used to supply small or isolated demand centers not connected to pipeline infrastructure, small scale LNG infrastructure is now increasingly deployed to cater to the growing demand for LNG as a transport fuel.
Natural gas can be transported from gas production centers to consumption centers in the form of liquefied natural gas (LNG) through ships and pipelines. Natural gas can be transported in ships and trucks to locations that are not connected to pipelines. Transportation of LNG takes place between exporting terminal (liquefaction plant) to importing terminal (regasification plant).
Small scale liquefaction and regasification infrastructure are ideally placed to assist with the development of stranded assets, the supply of remote residential and commercial demand centers but also the provision of LNG as a fuel.
LNG adoption is rapidly increasing due to the fact that natural gas is a competitive and environment-friendly option when compared to other fossil fuel sources. Small-scale LNG import terminals are primarily designed to serve the fuel requirements of a particular industry such as power generation and/or functions as a hub for ship and truck fueling. The risks associated with the development of large LNG facilities are significantly high when compared to small-scale terminals.
Small-scale LNG import terminals are the most economical option for such nations which have just started adopting LNG as a fuel in their respective industries. Several small nations are importing or planning to import LNG in small quantities specifically to cater to the feeling requirements of the power generation industry.
Several nations such as the Dominican Republic have just started importing LNG in small quantities to fulfil some of their industrial requirements. Such countries do not prefer importing large shipments of LNG as the demand for natural gas is still in the nascent stages in these nations.
The global market for small scale LNG is driven by high levels of spending in established and emerging markets. An important share of future capital expenditure will be driven by the greater deployment of LNG as a fuel, and growing investment in small scale LNG carriers.
Visiongain’s global Small Scale Liquefied Natural Gas (LNG)) Market report can keep you informed and up to date with the developments in the market, across six different nations: China, Indonesia, Japan, U.S, Europe and Rest of the World
With reference to this report, it details the key investments trend in the global market, subdivided by regions, capital expenditure and equipment. Through extensive secondary research and interviews with industry experts, visiongain has identified a series of market trends that will impact the Small Scale Liquefied Natural Gas (LNG) Market over the forecast timeframe.
The report will answer questions such as:
• How is the Small Scale Liquefied Natural Gas (LNG) market evolving?
• What is driving and restraining the Small Scale Liquefied Natural Gas (LNG) market dynamics?
• How will each technology in Small Scale Liquefied Natural Gas (LNG segment grow over the forecast period and how much sales will these submarkets account for in 2028?
• How will market shares of each the Small Scale Liquefied Natural Gas (LNG) submarket develop from 2018-2028?
• Which individual technologies will prevail and how will these shifts be responded to?
• Which Small Scale Liquefied Natural Gas (LNG) submarket will be the main driver of the overall market from 2018-2028?
• How will political and regulatory factors influence regional the Small Scale Liquefied Natural Gas (LNG) market and submarkets?
• Will leading national the Small Scale Liquefied Natural Gas (LNG) market broadly follow macroeconomic dynamics, or will individual country sectors outperform the rest of the economy?
• How will market shares of the national markets change by 2027 and which nation will lead the market in 2028?
• Who are the leading players and what are their prospects over the forecast period?
• How will the sector evolve as alliances form during the period between 2018 and 2028?
Five Reasons Why You Must Order and Read This Report Today:
1) The study analyses the Small Scale Liquefied Natural Gas (LNG) 2018-2028 Market in terms of :
– CAPEX ($ mn)
– Capacity MTPA)
2) The report provides Forecasts for the Small Scale Liquefied Natural Gas (LNG) Market by Type, for the period 2018-2028
– Small Scale Regasification Forecast 2018-2028
– Small Scale Liquefaction Forecast 2018-2028
– LNG Satellite Stations Forecast 2018-2028
– LNG Bunkering Facilities for Vessels Forecast 2018-2028
– Fueling Forecast 2018-2028
3) The report also Forecasts and Analyses the Small Scale Liquefied Natural Gas (LNG) Market by Geography from 2018-2028
China Small Scale LNG Market Forecast 2018-2028
– Small Scale Regasification Forecast 2018-2028
– Small Scale Liquefaction Forecast 2018-2028
– LNG Satellite Stations Forecast 2018-2028
– LNG Bunkering Facilities for Vessels Forecast 2018-2028
– Fueling Forecast 2018-2028
U.S Small Scale LNG Market Forecast 2018-2028
– Small Scale Regasification Forecast 2018-2028
– Small Scale Liquefaction Forecast 2018-2028
– LNG Satellite Stations Forecast 2018-2028
– LNG Bunkering Facilities for Vessels Forecast 2018-2028
– Fueling Forecast 2018-2028
Europe Small Scale LNG Market Forecast 2018-2028
– Small Scale Regasification Forecast 2018-2028
– Small Scale Liquefaction Forecast 2018-2028
– LNG Satellite Stations Forecast 2018-2028
– LNG Bunkering Facilities for Vessels Forecast 2018-2028
– Fueling Forecast 2018-2028
Indonesia Small Scale LNG Market Forecast 2018-2028
– Small Scale Regasification Forecast 2018-2028
– Small Scale Liquefaction Forecast 2018-2028
– LNG Satellite Stations Forecast 2018-2028
– LNG Bunkering Facilities for Vessels Forecast 2018-2028
– Fueling Forecast 2018-2028
Japan Small Scale LNG Market Forecast 2018-2028
– Small Scale Regasification Forecast 2018-2028
– Small Scale Liquefaction Forecast 2018-2028
– LNG Satellite Stations Forecast 2018-2028
– LNG Bunkering Facilities for Vessels Forecast 2018-2028
– Fueling Forecast 2018-2028
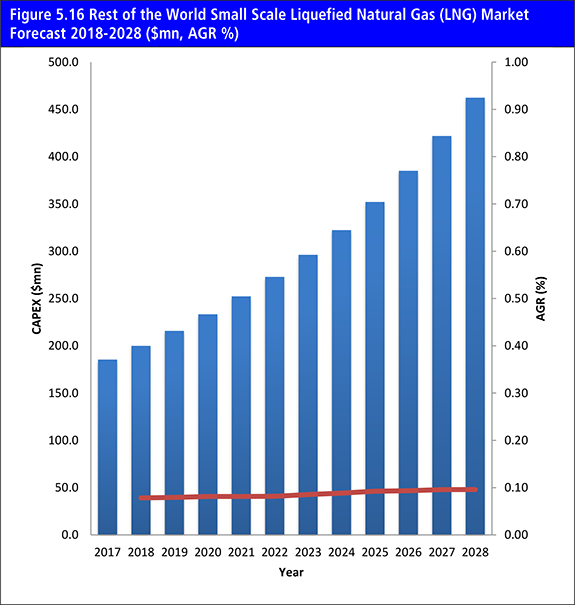
Rest of the World Small Scale LNG Market Forecast 2018-2028
– Small Scale Regasification Forecast 2018-2028
– Small Scale Liquefaction Forecast 2018-2028
– LNG Satellite Stations Forecast 2018-2028
– LNG Bunkering Facilities for Vessels Forecast 2018-2028
– Fueling Forecast 2018-2028
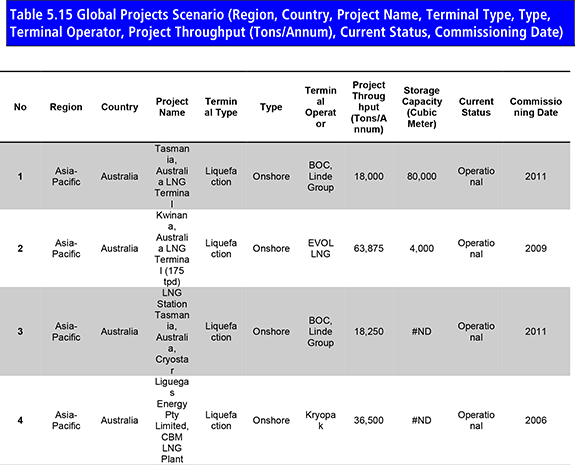
4) The report lists Extensive Details and Analysis of Global Projects in the Small Scale Liquefied Natural Gas (LNG) Market including:
– Region
– Country
– Project Name
– Terminal Type
– Type
– Terminal Operator
– Project Throughput (Tons/Annum)
– Current Status
– Commissioning Date
5) The report provides Detailed Profiles of The Leading Companies Operating within the Small Scale Liquefied Natural Gas (LNG) Market:
– Gasnor Shell
– Skangas
– Gazprom
– Wartsila
– Prometheus Energy Company
– PETRONAS
– EcoElectrica Inc.
– Air Products and Chemicals, Inc.
– ENN Energy Holdings Limited
– Kunlun Energy Company Limited
This independent 200-page report guarantees you will remain better informed than your competitors. With 106 tables and figures examining the Small Scale Liquefied Natural Gas (LNG) market space, the report gives you a direct, detailed breakdown of the market. PLUS, Capital expenditure and Capacity by type and geography, as well as in-depth analysis of leading companies in the Small Scale Liquefied Natural Gas (LNG) market from 2018-2028 that will keep your knowledge that one step ahead of your rivals.
This report is essential reading for you or anyone in the Energy sector. Purchasing this report today will help you to recognise those important market opportunities and understand the possibilities there. I look forward to receiving your order.
Visiongain is a trading partner with the US Federal Government
CCR Ref number: KD4R6
1. Report Overview
1.1 Small Scale Liquefied Natural Gas (LNG) Market Overview
1.2 Market Structure Overview and Market Definition
1.3 Why You Should Read This Report
1.4 How This Report Delivers
1.5 Key Questions Answered by This Analytical Report Include:
1.6 Who is This Report For?
1.7 Methodology
1.7.1 Primary Research
1.7.2 Secondary Research
1.7.3 Market Evaluation & Forecasting Methodology
1.8 Frequently Asked Questions (FAQ)
1.9 Associated Visiongain Reports
1.10 About Visiongain
2. Introduction to The Small Scale Liquefied Natural Gas (LNG) Market
2.1 Global Small Scale LNG Market Structure
2.2 Market Definition
2.3 Small Scale LNG Industry Outlook
2.4 Small Scale LNG- Value Chain Analysis
3. Global Overview of Small Scale Liquefied Natural Gas (LNG) Market 2018-2028
3.1 Global Small Scale Liquefied Natural Gas (LNG), Market Attractiveness Analysis
3.2 Global Small Scale Liquefied Natural Gas (LNG) Market Drivers and Restraints
4. Small Scale Liquefied Natural Gas (LNG) Submarkets Forecasts 2018-2028
4.1 Global Small Scale Liquefied Natural Gas (LNG) Submarkets Forecast, by Type 2018-2028
4.1.1 Global Small Scale Regasification Forecast 2018-2028
4.1.1.1 Global Small Scale Regasification Drivers and Restraints
4.1.2 Global Small Scale Liquefaction Forecast 2018-2028
4.1.2.1 Global Small Scale Liquefaction Drivers and Restraints
4.1.3 Global LNG Satellite Stations Forecast 2018-2028
4.1.3.1 Global LNG Satellite Stations Drivers and Restraints
4.1.4 Global LNG Bunkering Facilities for Vessels Forecast 2018-2028
4.1.4.1 Global LNG Bunkering Facilities for Vessels Drivers and Restraints
4.1.5 Global Fueling Forecast 2018-2028
4.1.5.1 Global Fueling Drivers and Restraints
5. Leading National Small Scale Liquefied Natural Gas (LNG) Market Forecast 2018-2028
5.1 China Small Scale Liquefied Natural Gas (LNG) Market 2018-2028
5.1.1 China Small Scale Liquefied Natural Gas (LNG) Submarket Forecast 2018-2028
5.1.2 China Small Scale Liquefied Natural Gas (LNG) Market Analysis
5.2 Indonesia Small Scale Liquefied Natural Gas (LNG) Market 2018-2028
5.2.1 Indonesia Small Scale Liquefied Natural Gas (LNG) Submarket Forecast 2018-2028
5.2.2 Indonesia Small Scale Liquefied Natural Gas (LNG) Market Analysis
5.3 Japan Small Scale Liquefied Natural Gas (LNG) Market 2018-2028
5.3.1 Japan Small Scale Liquefied Natural Gas (LNG) Submarket Forecast 2018-2028
5.3.2 Japan Small Scale Liquefied Natural Gas (LNG) Market Analysis
5.4 U.S. Small Scale Liquefied Natural Gas (LNG) Market 2018-2028
5.4.1 U.S. Small Scale Liquefied Natural Gas (LNG) Submarket Forecast 2018-2028
5.4.2 U.S. Small Scale Liquefied Natural Gas (LNG) Market Analysis
5.5 Europe Small Scale Liquefied Natural Gas (LNG) Market 2018-2028
5.5.1 Europe Small Scale Liquefied Natural Gas (LNG) Submarket Forecast 2018-2028
5.5.2 Europe Small Scale Liquefied Natural Gas (LNG) Market Analysis
5.6 Rest of the World Small Scale Liquefied Natural Gas (LNG) Market 2018-2028
5.6.1 Rest of the World Small Scale Liquefied Natural Gas (LNG) Submarket Forecast 2018-2028
5.6.2 Rest of the World Small Scale Liquefied Natural Gas (LNG) Market Analysis
6. PESTEL Analysis of the Small Scale Liquefied Natural Gas (LNG) 2018-2028
7. Expert Opinion
7.1 Primary Correspondents
7.2 Small Scale LNG Market Outlook
7.3 Drivers & Restraints
7.4 Dominant Region in the Small Scale LNG Market
7.5 By Type Market Scenario
7.6 Overall Growth Rate, Globally
8. Leading Companies in Small Scale Liquefied Natural Gas (LNG) Market
8.1 Gasnor Shell
8.1.1 Gasnor Shell Company Analysis
8.1.2 Gasnor Shell Company Outlook
8.2 Skangas
8.2.1 Skangas Company Analysis
8.2.2 Skangas Company Outlook
8.3 Gazprom
8.3.1 Gazprom Company Analysis
8.3.2 Gazprom Company Outlook
8.4 Wartsila
8.4.1 Wartsila Company Analysis
8.4.2 Wartsila Company Outlook
8.5 Prometheus Energy Company
8.5.1 Prometheus Energy Company Analysis
8.5.2 Prometheus Energy Company Outlook
8.6 PETRONAS
8.6.1 PETRONAS Company Analysis
8.6.2 PETRONAS Company Outlook
8.7 EcoElectrica Inc.
8.7.1 EcoElectrica Inc. Company Analysis
8.7.2 EcoElectrica Inc. Company Outlook
8.8 Air Products and Chemicals, Inc.
8.8.1 Air Products and Chemicals, Inc. Company Analysis
8.9 ENN Energy Holdings Limited
8.9.1 ENN Energy Holdings Limited Company Analysis
8.9.2 ENN Energy Holdings Limited Company Outlook
8.10 Kunlun Energy Company Limited
8.10.1 Kunlun Energy Company Limited Company Analysis
8.10.2 Kunlun Energy Company Limited Company Outlook
9. Conclusions and Recommendations
10. Glossary
Appendix
Associated Visiongain Reports
Visiongain Report Sales Order Form
Appendix A
Appendix B
Visiongain Report Evaluation Form
List of Tables
Table 1.1 The Small Scale LNG Market by Regional Market Forecast 2018-2028 ($ mn, MTPA, AGR %, CAGR)
Table 3.1 Global Small Scale Liquefied Natural Gas (LNG) Market, by Region Forecast 2018-2028 ($mn, AGR %, CAGR %, Cumulative)
Table 3.2 Global Small Scale Liquefied Natural Gas (LNG) Market, by Region Forecast 2018-2028 (MTPA, AGR %, CAGR %, Cumulative)
Table 3.3 Global Small Scale Liquefied Natural Gas (LNG) Market Drivers and Restraints
Table 4.1 Global Small Scale Liquefied Natural Gas (LNG) Market Forecast 2018-2028 ($mn, AGR %, Cumulative)
Table 4.2 Global Small Scale Regasification Forecast 2018-2028 ($mn, AGR %, CAGR %, Cumulative)
Table 4.3 Small Scale Regasification Operational Projects Examples (Plant Name, Country, Start Date, Company, Status)
Table 4.4 Small Scale Regasification Projects Examples (Plant Name, Location, Country, Receiving Capacity, Start Date, Company, Status)
Table 4.5 Global Small Scale Regasification Drivers and Restraints
Table 4.6 Global Small Scale Liquefaction Forecast 2018-2028 ($mn, AGR %, CAGR %, Cumulative)
Table 4.7 Small Scale Liquefaction Projects Examples (Name, Country, Start Date, Company, Status)
Table 4.8 Small Scale Liquefaction Projects Examples (Name, Country, Liquefaction Capacity, Start Date, Company, Status)
Table 4.9 Global Small Scale Liquefaction Drivers and Restraints
Table 4.10 Global LNG Satellite Stations Forecast 2018-2028 ($mn, AGR %, CAGR %, Cumulative)
Table 4.11 Global LNG Satellite Stations Drivers and Restraints
Table 4.12 Global LNG Bunkering Facilities for Vessels Forecast 2018-2028 ($mn, AGR %, CAGR %, Cumulative)
Table 4.13 Operational LNG Bunkering Facilities for Vessels (Name, Location, Country, Company, Date, Notes)
Table 4.14 Operational LNG Bunkering Facilities for Vessels (Name, Location, Country, Company, Date, Notes)
Table 4.15 Global LNG Bunkering Facilities for Vessels Drivers and Restraints
Table 4.16 Global Fueling Forecast 2018-2028($mn, AGR %, CAGR %, Cumulative)
Table 4.17 LNG Refueling Stations (Station Name, Year Built, Country, Location, Operator)
Table 4.18 Global Fueling Drivers and Restraints
Table 5.1 Leading National Small Scale Liquefied Natural Gas (LNG) Market Forecast by Submarket 2018-2028($mn, AGR)
Table 5.2 Leading National Small Scale Liquefied Natural Gas (LNG) Market Forecast by Submarket 2018-2028 (MTPA, AGR %)
Table 5.3 China Small Scale Liquefied Natural Gas (LNG) Market by Forecast 2018-2028 ($mn, MTPA, AGR %, CAGR %, Cumulative)
Table 5.4 China Small Scale Liquefied Natural Gas (LNG) Market, by Type Forecast 2018-2028 ($mn, AGR %, CAGR %, Cumulative)
aaaaAaaaaaaBVF1. Report
Table 5.5 Indonesia Small Scale Liquefied Natural Gas (LNG) Market by Forecast 2018-2028 ($mn, MTPA, AGR %, CAGR %, Cumulative)
Table 5.6 Indonesia Small Scale Liquefied Natural Gas (LNG) Market, by Type Forecast 2018-2028 ($mn, AGR %, CAGR %, Cumulative)
Table 5.7 Japan Small Scale Liquefied Natural Gas (LNG) Market by Forecast 2018-2028 ($mn, MTPA, AGR %, CAGR %, Cumulative)
Table 5.8 Japan Small Scale Liquefied Natural Gas (LNG) Market, by Type Forecast 2018-2028 ($mn, AGR %, CAGR %, Cumulative)
Table 5.9 U.S. Small Scale Liquefied Natural Gas (LNG) Market by Forecast 2018-2028 ($mn, MTPA, AGR %, CAGR %, Cumulative)
Table 5.10 U.S. Small Scale Liquefied Natural Gas (LNG) Market, by Type Forecast 2018-2028 ($mn, AGR %, CAGR %, Cumulative)
BVF
Table 5.11 Europe Small Scale Liquefied Natural Gas (LNG) Market by Forecast 2018-2028 ($mn, MTPA, AGR %, CAGR %, Cumulative)
Table 5.12 Europe Small Scale Liquefied Natural Gas (LNG) Market, by Type Forecast 2018-2028 ($mn, AGR %, CAGR %, Cumulative)
BVF1. Repo
Table 5.13 Rest of the World Small Scale Liquefied Natural Gas (LNG) Market by Forecast 2018-2028 ($mn, MTPA, AGR %, CAGR %, Cumulative)
Table 5.14 Rest of the World Small Scale Liquefied Natural Gas (LNG) Market, by Type Forecast 2018-2028 ($mn, AGR %, CAGR %, Cumulative)
Table 5.15 Global Projects Scenario (Region, Country, Project Name, Terminal Type, Type, Terminal Operator, Project Throughput (Tons/Annum), Current Status, Commissioning Date)
Table 6.1 PESTEL Analysis, Small Scale LNG Market
Table 8.1 Gasnor Shell Profile 2016 (Market Entry, Public/Private, Headquarters, No. of Employees, Revenue 2016 ($bn), Change in Revenue, Geography, Key Market, Listed on, Products/Services)
Table 8.2 Skangas 2015 (Market Entry, Public/Private, Headquarters, No. of Employees, Revenue 2016 ($bn), Change in Revenue, Geography, Key Market, Listed on, Products/Services)
Table 8.3 Skangas AS LNG Operations
Table 8.4 Gazprom 2015 (Market Entry, Public/Private, Headquarters, No. of Employees, Revenue 2016 ($bn), Change in Revenue, Geography, Key Market, Listed on, Products/Services)
Table 8.5 Gazprom, Total Company Sales 2012-2016 ($bn, AGR %)
Table 8.7 Wartsila Profile 2016 (Market Entry, Public/Private, Headquarters, No. of Employees, Revenue 2016 ($bn), Change in Revenue, Geography, Key Market, Listed on, Products/Services)
Table 8.8 Wartsila Total Company Sales 2012-2016 ($bn, AGR %)
Table 8.9 Prometheus Energy Company Profile 2016 (Market Entry, Public/Private, Headquarters, No. of Employees, Revenue 2016 ($bn), Change in Revenue, Geography, Key Market, Listed on, Products/Services)
Table 8.10 PETRONAS Profile 2016 (Market Entry, Public/Private, Headquarters, No. of Employees, Revenue 2016 ($bn), Change in Revenue, Geography, Key Market, Listed on, Products/Services)
Table 8.11 PETRONAS Total Company Revenue 2012-2016 ($bn, AGR %)
Table 8.12 EcoElectrica Inc. 2015 (Market Entry, Public/Private, Headquarters, No. of Employees, Revenue 2016 ($bn), Change in Revenue, Geography, Key Market, Listed on, Products/Services)
Table 8.13 Air Products and Chemicals, Inc. Profile 2016 (Market Entry, Public/Private, Headquarters, No. of Employees, Revenue 2016 ($bn), Change in Revenue, Geography, Key Market, Listed on, Products/Services)
Table 8.14 Air Products and Chemicals, Inc Total Company Revenue 2012-2016 ($bn, AGR %)
Table 8.15 ENN Energy Holdings Limited Profile 2015 (Market Entry, Public/Private, Headquarters, No. of Employees, Revenue 2016 ($bn), Change in Revenue, Geography, Key Market, Listed on, Products/Services)
Table 8.16 ENN Energy Holdings Limited Total Company Revenue 2012-2016 ($bn, AGR %)
Table 8.17 Kunlun Energy Company Limited 2015 (Market Entry, Public/Private, Headquarters, No. of Employees, Revenue 2016 ($bn), Change in Revenue, Geography, Key Market, Listed on, Products/Services)
Table 8.18 Kunlun Energy Company Limited, Total Company Sales 2012-2016 ($bn, AGR %)
Table 9.1 Global Small Scale Liquefied Natural Gas (LNG) Market, by Region Forecast 2018-2028 ($mn, AGR %, CAGR %, Cumulative)
Table 9.2 Global Small Scale Liquefied Natural Gas (LNG) Market, by Region Forecast 2018-2028 (MTPA, AGR %, CAGR %, Cumulative)
List of Figures
Figure 1.1 The Small Scale LNG Market by Country/Region Market Share Forecast 2018, 2023, 2028 (% Share)
Figure 2.1 Global Small Scale LNG Market Segmentation Overview
Figure 2.2 Small Scale LNG, Value Chain Analysis
Figure 3.1 Global Small Scale Liquefied Natural Gas (LNG) Forecast 2018-2028 ($mn, AGR %)
Figure 3.2 Small Scale Liquefied Natural Gas (LNG) Market by Regional Market Share Forecast 2018, 2023, 2028 (% Share)
Figure 3.3 Global Small Scale Liquefied Natural Gas (LNG) Market, Market Attractiveness, By Region
Figure 4.1 Global Small Scale Liquefied Natural Gas (LNG) Submarket Forecast 2018-2028 ($mn, AGR%)
Figure 4.2 Global Small Scale Liquefied Natural Gas (LNG) Market by Type Share Forecast 2018, 2023, 2028 (% Share)
Figure 4.3 Small Scale Liquefied Natural Gas (LNG) Market, By Small Scale Regasification Forecast 2018-2028 ($mn, AGR%)
Figure 4.4 Small Scale Liquefied Natural Gas (LNG) Market, By Small Scale Liquefaction Forecast 2018-2028 ($mn, AGR%)
Figure 4.5 Small Scale Liquefied Natural Gas (LNG) Market, By LNG Satellite Stations Forecast 2018-2028 ($mn, AGR%)
Figure 4.6 Small Scale Liquefied Natural Gas (LNG) Market, By LNG Bunkering Facilities for Vessels Forecast 2018-2028 ($mn, AGR%)
Figure 4.7 Small Scale Liquefied Natural Gas (LNG) Market, By Fueling Forecast 2018-2028 ($mn, AGR%)
Figure 5.1 Large Scale VS Small Scale LNG, Global LNG Trade Share % 2016
Figure 5.2 Leading National Small Scale Liquefied Natural Gas (LNG) Market Forecast 2018-2028 (MTPA)
Figure 5.3 Leading Regional Players in Small Scale Liquefied Natural Gas (LNG) Market, % Share, 2018
Figure 5.4 Leading Regional Players in Small Scale Liquefied Natural Gas (LNG) Market, % Share, 2023
Figure 5.5 Leading Regional Players in Small Scale Liquefied Natural Gas (LNG) Market, Share, 2028
Figure 5.6 China Small Scale Liquefied Natural Gas (LNG) Market Forecast 2018-2028 ($mn, AGR %)
Figure 5.7 China Small Scale Liquefied Natural Gas (LNG) Market Forecast 2018-2028 (MTPA, AGR %)
Figure 5.8 Indonesia Small Scale Liquefied Natural Gas (LNG) Market Forecast 2018-2028 ($mn, AGR %)
Figure 5.9 Indonesia Small Scale Liquefied Natural Gas (LNG) Market Forecast 2018-2028 (MTPA, AGR %)
Figure 5.10 Japan Small Scale Liquefied Natural Gas (LNG) Market Forecast 2018-2028 ($mn, AGR %)
Figure 5.11 Japan Small Scale Liquefied Natural Gas (LNG) Market Forecast 2018-2028 (MTPA, AGR %)
Figure 5.12 U.S. Small Scale Liquefied Natural Gas (LNG) Market Forecast 2018-2028 ($mn, AGR %)
Figure 5.13 U.S. Small Scale Liquefied Natural Gas (LNG) Market Forecast 2018-2028 (MTPA, AGR %)
Figure 5.14 Europe Small Scale Liquefied Natural Gas (LNG) Market Forecast 2018-2028 ($mn, AGR %)
Figure 5.15 Europe Small Scale Liquefied Natural Gas (LNG) Market Forecast 2018-2028 (MTPA, AGR %)
Figure 5.16 Rest of the World Small Scale Liquefied Natural Gas (LNG) Market Forecast 2018-2028 ($mn, AGR %)
Figure 5.17 Rest of the World Small Scale Liquefied Natural Gas (LNG) Market Forecast 2018-2028 (MTPA, AGR %)
Figure 8.1 Gazprom, Revenue ($bn& AGR %), 2012-2016
Figure 8.2 Wartsila, Revenue ($bn& AGR %), 2012-2016
Figure 8.3 Wartsila Revenue %Share, by Business Segment, 2016
Figure 8.4 Wartsila Revenue %Share, by Regional Segment, 2016
Figure 8.5 PETRONAS Total Company Revenue ($bn & AGR %), 2012-2016
Figure 8.6 Petronas Revenue % Share, by Product Segment, 2016
Figure 8.7 Petronas Revenue % Share, by Geographical Trade, 2016
Figure 8.8 Petronas Revenue % Share, by Business Segment, 2016
Figure 8.9 Petronas Revenue % Share, by Geographic Segment, 2016
Figure 8.10 Air Products and Chemicals, Inc Total Company Revenue ($bn, AGR %), 2012-2016
Figure 8.11 Air Products and Chemicals, Inc Revenue % Share, by Regional Segment, 2016
Figure 8.12 Air Products and Chemicals, Inc Revenue % Share, by Business Segment, 2016
Figure 8.13 ENN Energy Holdings Limited Total Company Revenue ($bn& AGR %), 2012-2016
Figure 8.14 Kunlun Energy Company Limited Revenue % Share, by Business Segment, 2016
Figure 8.15 Kunlun Energy Company Limited, Revenue ($bn& AGR %), 2012-2016
Figure 9.1 Global small scale LNG Market Forecast 2018-2028 ($ mn, AGR %)
Adpo
AGA AB
Air Liquide
Air Products and Chemicals, Inc.
Alabama Gas Company
Albert Heijn
Anhui Huaqiang Natural Gas
APNG
Applied LNG
Baldwin Park
Barents NaturGass
Bayernwerk AG
Black & Veatch
Black River Asset Management LLC
Blu LNG
BOC
Bomin Linde LNG
BP, Plc.
Brunsbuttel Ports
Buffalo Marine Service
Buquebus
CCB
Chevron Corporation
China National Offshore Oil Corporation’s (CNOOC)
China Natural Gas
China Natural Gas Guangyuan Company
China’s National Petroleum Corporation (CNPC)
Chive Fuels
Clean Energy Corp.
Clean Energy Fuels
Clean Marine Energy
Colony Energy Partners
ConferenzaGNL LNG Europe B.V.
Cove Point LNG
Cryothai Company Limited
Cyprus Noble Energy
DHL Bawtry
Distrigas Corporation Everett
Dunkerque LNG
EcoElectrica Inc.
Elengy
Emirates LNG LLC
Enagas S.A.
EnBW Kraftwerke Stutgart
Encana
Energigas
ENI
ENN Energy Holdings Limited
ENN Group Co. Ltd
ENOSLNG
EON
Erdgas Sudbayern Gmbh
Erdos-Xingxing Gas Co.
Evol LNG
Exmar
Exxon Mobil
Fairbanks Natural Gas
Ferus Natural Gas Fuels Inc.
Fjord Line AS
Flint Hills Resources
Fluxys
Fordonsgas
FortisBC
Gasnor AS
Gasnor Shell
Gasrec
Gasum Group
Gasum Ltd
Gasunie
Gavle Hamn
Gazprom
Gazprom Export
Gazprom Gas-Engine Fuel
GDF Suez
GE Energy
GNF
GoldEnergy
HAM Group
Harvey Gulf
Henan Green Energy
Henan Tian Lun
Hiroshima Gas
Hiroshima LNG
Hitachi, Ltd
Hokkaido GaS
Hopkinton LNG Corp
Huineng Coal Chemical Co. Ltd.
Idaho Falls
IM Skaugen
InterStream Barging
Jahre Marine
Japan Petroleum Exploration Co., Ltd.
Jensen Maritime
Kamaishi Gas
Keyspan LNG
Klaipedos Nafta
Kogas
Kosan Crisplant
Kryopak
Kunlun Energy Company Limited
Linde AG
Linde Group
Linde North America
LINN Energy, LLC
Liqueline
LNG 24
LNG America
LNG Hybrid
LNG Silesia
LNG-Gorskaya
Long Beach
Lyse Energi AS
Manga LNG
Monfort
Morioka Gas
National Grid
Naturgass Møre AS
New Times Energy
Nihon Gas
Nippon Gas
Nippon Oil
Nobel Energy
Northeast Midstream
Norwegian Cambi AS
OAO Gazprom
Okayama Gas
Okinawa Electric Power Co
Ordos Juchang New Energy
Osaka Gas
Oy AGA Ab
Peoples Gas
Petrobangla
Petrobras
PetroChina
Petronas
Petronet
PGNiG
Philadelphia Gas Works
Pioneer Natural Resources
Plum Energy
Polish Oil and Gas Co.
Polski LNG
Port of Antwerp
Portal Gas Group
Preem
Prometheus Energy
PT Pertamina
PT Perusahaan Listrik Negara
Puget Sound Energy
Regasificadora del Noroeste, SA.
Reola Gaas
Repsol
Rolande LNG
Rostock Port
Royal Dutch Shell
RWE
Saga Fjordbase
Saibu Gas
Sakaide LNG
Sendai Municipal Gas
Seneca Resources Corporation
Shaanxi Zhongyuan Green Energy
Shanxi Yigao Coal-bed Gas Co., Ltd.
Shell Technology Ventures Fund 1 B.V
Shikoku Gas
Shin-Minato Works
Sichuan Suoyu Gas
Siehuang Tonghei Energy & Technology Dev. Co. Ltd.
Simon Loos
Sinopec
Skagerak Naturgass
Skangass AS
Spectrum LNG
Stabilis Energy
Statoil
Stobart Group
Stolt LNGaz
Swedgas AB
Takamatsu
Temecula
Tenaska NG Fuels
TLF
Toho Gas
Tokyo Gas
Total
TOTE
Vanzetti
Veka Group
Via Augusta Gas
Vicuna
Vopak LNG
Vos Logistics
Waller Marine
Wartsila
Washington Gas
Wesfarmers Gas Ltd.
WesPac Midstream
Williams Midstream
Wuchang Shipbuilding
Wuxi Yongda Gas LNG Plant
Xilan Natural Gas Group
Xinjiang Xinjie
Zhejiang Energy Company
Other Organisations Mentioned in This Report
Aqueduct and Sewer Authority Energy
Brazilian Government
Chinese Government
Environmental Protection Agency (EPA)
European Commission
European Union (EU)
Government of Norway
Government of Canada
Government of Mexico
Inland Waterways Authority of India (IWAI)
International Organization for Standardization (ISO)
National Highway Traffic Safety Administration
New York City Department of Transportation
Occupational Health and Safety Management System (OHSAS
Puerto Rico Electric Power Authority
South Coast Power Authority
South Korean Ministry of Trade
U.S. Department of Energy (DOE)
Washington State
Download sample pages
Complete the form below to download your free sample pages for Small Scale Liquefied Natural Gas (LNG) Market Forecast 2018-2028
Related reports
-

Liquefied Natural Gas (LNG) Carrier Market Report 2019-2029
The latest report from business intelligence provider Visiongain offers comprehensive analysis of the global LNG carrier market. Visiongain assesses that...Full DetailsPublished: 20 June 2019 -

Liquefied Natural Gas (LNG) Bunkering Market 2019-2029
Visiongain has calculated that the LNG Bunkering market will see a capital expenditure (CAPEX) of $843mn in 2019. Read on...
Full DetailsPublished: 30 April 2019 -

Oil & Gas Subsea Umbilicals, Risers & Flowlines (SURF) Market Report 2019-2029
Visiongain has calculated that the global subsea umbilicals, risers and flowlines (SURF) market will see a capital expenditure (CAPEX) of...
Full DetailsPublished: 02 November 2018 -

Pipeline Leak Detection Market of the Oil and Gas Industry 2018-2028
The growing environmental concerns has led Visiongain to publish this timely report. The pipeline leak detection market is expected to...
Full DetailsPublished: 01 May 2018 -

Floating Liquefied Natural Gas (FLNG) Market Report 2018-2028
This latest report by business intelligence provider visiongain assesses that Floating Liquefied Natural Gas spending will reach $9.6bn in 2018.
...Full DetailsPublished: 28 June 2018 -

Liquefied Natural Gas (LNG) Carrier Market 2018-2028
Visiongain has calculated that the LNG Carrier market will see a capital expenditure (CAPEX) of $11,208 mn in 2018.Read on...
Full DetailsPublished: 13 February 2018 -

LNG Yearbook 2018: The Ultimate Guide to Liquefied Natural Gas Infrastructure 2018-2028
The definitive LNG Yearbook 2018 is the ultimate reference source for the liquefied natural gas industry. The yearbook indicates that...
Full DetailsPublished: 14 June 2018 -

Onshore Oil & Gas Pipelines Market Report 2019-2029
Visiongain’s extensive and detailed 427-page report reveals that onshore oil and gas pipeline infrastructure will experience CAPEX of $1,291.3bn in...Full DetailsPublished: 08 March 2019 -

Top 20 Small-Scale Liquified Natural Gas (SSLNG) Companies 2019
Small Scale LNG is used to supply small or isolated demand centers not connected to pipeline infrastructure, small scale LNG...
Full DetailsPublished: 24 January 2019 -

Small & Mid-Scaled LNGC & LNGBV Market Report 2019-2029
Visiongain’s forecasts indicate that the global the Small-Scale LNG Carrier, Medium-Scale Carrier and LNG Bunkering Vessels see capital expenditures (CAPEX)...
Full DetailsPublished: 13 May 2019
Download sample pages
Complete the form below to download your free sample pages for Small Scale Liquefied Natural Gas (LNG) Market Forecast 2018-2028
Do you have any custom requirements we can help you with?
Any specific country, geo region, market segment or specific company information?
Email us today, we can discuss your needs and see how we can help: jamie.roberts@visiongain.com
Would you like a free report overview of the report of your choice?
If so, please drop an email to Jamie Roberts stating your chosen report title to jamie.roberts@visiongain.com
Visiongain energy reports are compiled using a broad and rich mixture of both primary and secondary information to produce an overall industry outlook. In order to provide our clients with the best product possible product, we do not rely on any one single source of information. Visiongain analysts reach out to market-leading vendors and industry experts where possible but also review a wealth of financial data and product information from a vast range of sources. To find out more about our reports methodology, please email jamie.roberts@visiongain.com
Would you like to get the latest Visiongain energy reports catalogue?
What are the dynamic growth sectors? where are the regional business opportunities?
Which technologies will prevail and who are the leading companies succeeding in these sectors and why?
If you want definitive answers to business critical questions, discover Visiongain’s full range of business intelligence reports.
If so, please email Jamie Roberts on jamie.roberts@visiongain.com or call her today on +44 207 336 6100
“The Visiongain report was extremely insightful and helped us construct our basic go-to market strategy for our solution.”
H.
“F.B has used Visiongain to prepare two separate market studies on the ceramic proppants market over the last 12 months. These reports have been professionally researched and written and have assisted FBX greatly in developing its business strategy and investment plans.”
F.B
“We just received your very interesting report on the Energy Storage Technologies (EST) Market and this is a very impressive and useful document on that subject.”
I.E.N
“Visiongain does an outstanding job on putting the reports together and provides valuable insight at the right informative level for our needs. The EOR Visiongain report provided confirmation and market outlook data for EOR in MENA with the leading countries being Oman, Kuwait and eventually Saudi Arabia.”
E.S
“Visiongain produced a comprehensive, well-structured GTL Market report striking a good balance between scope and detail, global and local perspective, large and small industry segments. It is an informative forecast, useful for practitioners as a trusted and upto-date reference.”
Y.N Ltd
Association of Dutch Suppliers in the Oil & Gas Industry
Society of Naval Architects & Marine Engineers
Association of Diving Contractors
Association of Diving Contractors International
Associazione Imprese Subacquee Italiane
Australian Petroleum Production & Exploration Association
Brazilian Association of Offshore Support Companies
Brazilian Petroleum Institute
Canadian Energy Pipeline
Diving Medical Advisory Committee
European Diving Technology Committee
French Oil and Gas Industry Council
IMarEST – Institute of Marine Engineering, Science & Technology
International Association of Drilling Contractors
International Association of Geophysical Contractors
International Association of Oil & Gas Producers
International Chamber of Shipping
International Shipping Federation
International Marine Contractors Association
International Tanker Owners Pollution Federation
Leading Oil & Gas Industry Competitiveness
Maritime Energy Association
National Ocean Industries Association
Netherlands Oil and Gas Exploration and Production Association
NOF Energy
Norsk olje og gass Norwegian Oil and Gas Association
Offshore Contractors’ Association
Offshore Mechanical Handling Equipment Committee
Oil & Gas UK
Oil Companies International Marine Forum
Ontario Petroleum Institute
Organisation of the Petroleum Exporting Countries
Regional Association of Oil and Natural Gas Companies in Latin America and the Caribbean
Society for Underwater Technology
Society of Maritime Industries
Society of Petroleum Engineers
Society of Petroleum Enginners – Calgary
Step Change in Safety
Subsea UK
The East of England Energy Group
UK Petroleum Industry Association
All the events postponed due to COVID-19.
Don’t Miss Out!
Subscribe to receive the latest Industry news, trending insight and analysis straight to your inbox.Choose your preferences:
Latest Energy news
Energy as a Service (EaaS) Market
The global Energy as a Service (EaaS) market is projected to grow at a CAGR of 12.6% by 2034
25 July 2024
Synthetic Fuels Market
The global Synthetic Fuels market is projected to grow at a CAGR of 23% by 2034
18 July 2024
Power-to-X (P2X) Market
The global Power-to-X (P2X) market is projected to grow at a CAGR of 10.6% by 2034
09 July 2024
Airborne Wind Energy Market
The global Airborne Wind Energy market is projected to grow at a CAGR of 9.7% by 2034
05 June 2024
