Industries > Energy > Pipeline Leak Detection Market of the Oil and Gas Industry 2018-2028
Pipeline Leak Detection Market of the Oil and Gas Industry 2018-2028
Forecasts by Technology (Negative Pressure Wave, E-RTTM, Fibre Optic, Mass/Volume Balance, Vapour Sensing), Location of Application (Onshore and Offshore) Plus Leading Companies, Global, Regional and National Market Analysis
• Do you need definitive pipeline leak detection for oil and gas market data?
• Succinct pipeline leak detection for oil and gas market analysis?
• Technological insight?
• Clear competitor analysis?
• Actionable business recommendations?
Read on to discover how this definitive report can transform your own research and save you time.
The growing environmental concerns has led Visiongain to publish this timely report. The pipeline leak detection market is expected to flourish in the next few years because of increasing number of accidents due to leakages and also because of government policies. If you want to be part of this growing industry, then read on to discover how you can maximise your investment potential.
Report highlights
• 132 quantitative tables, charts, and graphs
• Analysis of key players in pipeline leak detection of the oil and gas technologies
• Atmos International
• PSI AG
• FLIR Systems
• ClampOn AS
• Krohne Messtechnik GmbHCGG
• Pentair PLC
• Perma-Pipe, Inc.
• Pure Technologies Ltd
• Schneider Electric SE
• Sensit Technologies LLC
• Siemens AG
• Synodon Inc.
• TTK-Leak Detection System
• Honeywell International Inc.
• Asel-Tech, Inc.
• Omnisens SA
• Global Pipeline Leak Detection Market of the Oil and Gas Industry outlook and analysis from 2018-2028
• Pipeline Leak Detection Market of the Oil and Gas Industry by region and location of application forecasts and analysis from 2018-2028
• Onshore Forecast 2018-2028
• Offshore Forecast 2018-2028
• Pipeline Leak Detection Market of the Oil and Gas Industry by region and technology analysis and potential from 2018-2028
• Negative Pressure Wave Forecast 2018-2028
• E-RTTM Forecast 2018-2028
• Fibre Optic Forecast 2018-2028
• Mass/Volume Balance Forecast 2018-2028
• Vapour Sensing Forecast 2018-2028
• Regional Pipeline Leak Detection Market of the Oil and Gas Industry forecasts from 2018-2028
• North America Forecast 2018-2028
• Europe Forecast 2018-2028
• Asia-Oceania Forecast 2018-2028
• Rest of the World Forecast 2018-2028
• National Pipeline Leak Detection Market of the Oil and Gas Industry forecasts from 2018-2028
• US Forecast 2018-2028
• Egypt Forecast 2018-2028
• Argentina Forecast 2018-2028
• China Forecast 2018-2028
• India Forecast 2018-2028
• Canada Forecast 2018-2028
• UK Forecast 2018-2028
• Germany Forecast 2018-2028
• Italy Forecast 2018-2028
• Russia Forecast 2018-2028
• Rest of Europe Forecast 2018-2028
• Australia Forecast 2018-2028
• Japan Forecast 2018-2028
• Rest of Asia-Oceania Forecast 2018-2028
• Brazil Forecast 2018-2028
• UAE Forecast 2018-2028
• Key questions answered
• What does the future hold for the pipeline leak detection for oil and gas industry?
• Where should you target your business strategy?
• Which applications should you focus upon?
• Which disruptive technologies should you invest in?
• Which companies should you form strategic alliances with?
• Which company is likely to succeed and why?
• What business models should you adopt?
• What industry trends should you be aware of?
• Target audience
• Leading pipeline leak detection companies in the oil and gas industry
• Suppliers
• Contractors
• Technologists
• R&D staff
• Consultants
• Analysts
• CEO’s
• CIO’s
• COO’s
• Business development managers
• Investors
• Governments
• Agencies
• Industry organisations
• Banks
Visiongain is a trading partner with the US Federal Government
CCR Ref number: KD4R6
1. Report Overview
1.1 Global Pipeline Leak Detection Market of the Oil and Gas Industry Overview
1.2 Why You Should Read This Report
1.3 Key Questions Answered by This Analytical Report
1.4 Who is this Report For?
1.5 Methodology
1.6 Associated Visiongain Reports
1.7 About Visiongain
2. Introduction to Pipeline Leak Detection System
2.1 What is Pipeline Leak Detection?
2.2 Classification of Pipeline Detection System Market for Oil and Gas Industry
2.3 Pipeline Detection Technology for Oil and Gas Industry
2.3.1 Negative Pressure Wave
2.3.2 E-RTTM
2.3.3 Fiber Optic
2.3.4 Mass/Volume Balance
2.3.5 Vapor Sensing Tubes
3. Market Dynamics
3.1 Introduction
3.2 Drivers and Restraints 2018-2028
3.2.1 Aging Pipelines are Driving the Growth of Pipeline Leak
Detection Market
3.2.2 Stringent Government Regulations and Standards on Oil Spill and Gas Emissions
3.2.3 Increasing number of accidents due to leakages in pipelines and storage tanks at oil and gas production facilities
3.2.4 Development and Expansion of Existing Pipelines and Construction of New Pipelines
3.3 Restraint
3.3.1 Complexity and Costs Involved in Leak Detection Systems during Harsh Working Conditions
3.4 Porter’s Five Forces Analysis of the Pipeline Leak Detection Market of the Oil and Gas Industry
3.4.1 Rivalry among Competitors [High to Medium]
3.4.2 Threat of New Entrants [High]
3.4.3 Power of Suppliers [High]
3.4.4 Power of Buyers [Low to Medium]
3.4.5 Threat of Substitutes [Low]
3.5 PEST Analysis of the Pipeline Leak Detection Market of the Oil and Gas Industry
3.5.1 Political Factors
3.5.2 Economic Factors
3.5.3 Social Factors
3.5.4 Technological Factors
3.6 Value Chain Analysis of Pipeline Leak Detection Market of the Oil and Gas Industry 2018-2028
3.6.1 Raw Material suppliers
3.6.2 Technology manufacturers
3.6.3 End Users
3.7 Barriers to Entry Analysis
4. Technology Overview & Regulations
4.1 Timeline of Pipeline
4.2 Need of leak detection in oil and gas transportation pipelines
4.3 Regulatory Standards for pipelines leak detection
5. Pipeline Leak Detection Market of the Oil and Gas Industry 2018-2028
5.1 Introduction
5.2 Global Pipeline Leak Detection Market of the Oil and Gas Industry by Region 2018-2028
5.3 Global Pipeline Leak Detection Market of the Oil and Gas Industry by Technology 2018-2028
5.4 Global Pipeline Leak Detection Market of the Oil and Gas Industry by Location 2018-2028
5.5 Global Pipeline Leak Detection Market of the Oil and Gas Industry by Region 2018-2028
5.5.1 North America Pipeline Leak Detection Market of the Oil and Gas Industry by Country 2018-2028
5.5.2 Europe Pipeline Leak Detection Market of the Oil and Gas Industry by Country 2018-2028
5.5.3 Asia-Oceania Pipeline Leak Detection Market of the Oil and Gas Industry by Country 2018-2028
5.5.4 ROW Pipeline Leak Detection Market of the Oil and Gas Industry by Country 2018-2028
6. Pipeline Leak Detection Market of the Oil and Gas Industry by Technology in Regions 2018-2028
6.1 North America Pipeline Leak Detection Market of the Oil and Gas Industry by Technology 2018-2028
6.2 Europe Pipeline Leak Detection Market of the Oil and Gas Industry by Technology 2018-2028
6.3 Asia Oceania Pipeline Leak Detection Market of the Oil and Gas Industry by Technology 2018-2028
6.4 ROW Pipeline Leak Detection Market of the Oil and Gas Industry by Technology 2018-2028
7. Pipeline Leak Detection Market of the Oil and Gas Industry in Regions by Location 2018-2028
7.1 North America Pipeline Leak Detection Market of the Oil and Gas Industry by Location 2018-2028
7.2 Europe Pipeline Leak Detection Market of the Oil and Gas Industry by Location 2018-2028
7.3 Asia Oceania Pipeline Leak Detection Market of the Oil and Gas Industry by Location 2018-2028
7.4 ROW Pipeline Leak Detection Market of the Oil and Gas Industry by Location 2018-2028
8. Pipeline Leak Detection Market of the Oil and Gas Industry by Technology in Regions 2018-2028
8.1 Negative Pressure Wave Pipeline Leak Detection Market of the Oil and Gas Industry by Region 2018-2028
8.2 E-RTTM Pipeline Leak Detection Market in the Oil and Gas Industry by Region 2018-2028
8.3 Fiber Optic Pipeline Leak Detection Market in the Oil and Gas Industry by Region 2018-2028
8.4 Mass/Volume Balance Pipeline Leak Detection Market in the Oil and Gas Industry by Region 2018-2028
8.5 Vapor Sensing Tubes Pipeline Leak Detection Market in the Oil and Gas Industry by Region 2018-2028
9. Pipeline Leak Detection Market of the Oil and Gas Industry by Location of application in Regions 2018-2028
9.1 Offshore Pipeline Leak Detection Market of the Oil and Gas Industry by Region 2018-2028
9.2 Onshore Pipeline Leak Detection Market of the Oil and Gas Industry by Region 2018-2028
10. Leading Companies in the Pipeline Leak Detection Market
10.1 Atmos International
10.1.1 Atmos International Product Portfolio
10.1.2 Atmos International Sales Analysis
10.2 PSI AG
10.2.1 PSI AG Product Portfolio
10.2.2 PSI AG Sales Analysis
10.3 Flir Systems, Inc.
10.3.1 Flir Systems, Inc. Product Portfolio
10.3.2 Flir Systems, Inc. Sales Analysis
10.4 ClampOn AS
10.4.1 ClampOn AS Product Portfolio
10.5 Krohne Messtechnik GmbH
10.5.1 Krohne Messtechnik GmbH Product Portfolio
10.5.2 Krohne Messtechnik GmbH Sales Analysis
10.6 Pentair PLC
10.6.1 Pentair PLC Product Portfolio
10.6.2 Pentair PLC Revenue Analysis
10.7 Perma-Pipe, Inc.
10.7.1 Perma-Pipe, Inc. Product Portfolio
10.7.2 Perma-Pipe, Inc. Revenue Analysis
10.8 Pure Technologies Ltd
10.8.1 Pure Technologies Ltd. Product Portfolio
10.8.2 Pure Technologies Ltd. Revenue Analysis
10.9 Schneider Electric SE
10.9.1 Schneider Electric SE Product Portfolio
10.9.2 Schneider Electric SE Revenue Analysis
10.10 Sensit Technologies LLC
10.10.1 Sensit Technologies LLC Product Portfolio
10.11 Siemens AG
10.11.1 Siemens AG Product Portfolio
10.11.2 Siemens AG Revenue Analysis
10.12 Synodon Inc.
10.12.1 Synodon Inc. Product Portfolio
10.12.2 Synodon Inc. Sales Analysis
10.13 TTK-Leak Detection System
10.13.1 TTK-Leak Detection System Product Portfolio
10.13.2 TTK-Leak Detection System Sales Analysis
10.14 Honeywell International Inc.
10.14.1 Honeywell International Inc. Product Portfolio
10.14.2 Honeywell International Inc. Sales Analysis
10.15 Asel-Tech, Inc.
10.15.1 Asel-Tech, Inc. Product Portfolio
10.16 Omnisens SA
10.16.1 Omnisens SA Product Portfolio
10.17 OMEGA Engineering, Inc.
10.17.1 OMEGA Engineering, Inc. Product Portfolio
10.18 Other Active Companies in Pipeline Leak Detection Market
11. Conclusions
11.1 Current Leading Pipeline Leak Detection Techniques
11.2 Leading Pipeline Leak Detection Techniques Manufacturing Companies
11.3 Growth in Regional Markets
11.4 What is the Future of the Pipeline Leak Detection Market?
12. Glossary
Visiongain Report Sales Order Form
Appendix A
About Visiongain
Appendix B
Visiongain report evaluation form
List of Tables
Table 5-1: Global Pipeline Leak Detection Market of the Oil and Gas Industry by Region 2018-2028 ($MN, AGR (%))
Table 5-2: Global Pipeline Leak Detection of the Oil and Gas Market by Region CAGR Forecast 2018-2023, 2023-2028, 2018-2028 (CAGR %)
Table 5-3: Global Pipeline Leak Detection Market of the Oil and Gas industry by Technology 2018-2028 ($MN, AGR (%))
Table 5-4: Global Pipeline Leak Detection of the Oil and Gas Market by Technology CAGR Forecast 2018-2023, 2023-2028, 2018-2028 (CAGR %)
Table 5-5: Global Pipeline Leak Detection Market of the Oil and Gas Industry by Location 2018-2028 ($MN, AGR (%))
Table 5-6: Global Pipeline Leak Detection of the Oil and Gas Market by Location CAGR Forecast 2018-2023, 2023-2028, 2018-2028 (CAGR %)
Table 5-7: North America Pipeline Leak Detection Market of the Oil and Gas Industry by Country 2018-2028 ($MN, AGR (%))
Table 5-8: North America Pipeline Leak Detection of the Oil and Gas Market by Country CAGR Forecast 2018-2023, 2023-2028, 2018-2028 (CAGR %)
Table 5-9: Europe Pipeline Leak Detection Market of the Oil and Gas Industry by Country 2018-2028 ($MN, AGR (%))
Table 5-10: Europe Pipeline Leak Detection of the Oil and Gas Market by Country, CAGR Forecast 2018-2023, 2023-2028, 2018-2028 (CAGR %)
Table 5-11: Asia-Oceania Pipeline Leak Detection Market of the Oil and Gas Industry by Country 2018-2028 ($MN, AGR (%))
Table 5-12: Asia-Oceania Pipeline Leak Detection Market of the Oil and Gas Industry by Country CAGR Forecast 2018-2023, 2023-2028, 2018-2028 (CAGR %)
Table 5-13: ROW Pipeline Leak Detection Market of the Oil and Gas Industry by Country 2018-2028 ($MN, AGR (%))
Table 5-14: ROW Pipeline Leak Detection for the Oil and Gas Market by Country CAGR Forecast 2018-2023, 2023-2028, 2018-2028 (CAGR %)
Table 6-1: North America Pipeline Leak Detection Market of the Oil and Gas Industry by Technology 2018-2028 ($MN, AGR (%))
Table 6-2: North America Pipeline Leak Detection of the Oil and Gas Market by Technology CAGR Forecast 2018-2023, 2023-2028, 2018-2028 (CAGR %)
Table 6-3: Europe Pipeline Leak Detection Market of the Oil and Gas Industry by Technology 2018-2028 ($MN, AGR (%))
Table 6-4: Europe Pipeline Leak Detection of the Oil and Gas Market by Technology CAGR Forecast 2018-2023, 2023-2028, 2018-2028 (CAGR %)
Table 6-5: Asia Oceania Pipeline Leak Detection Market of the Oil and Gas Industry by Technology 2018-2028 ($MN, AGR (%))
Table 6-6: Asia Oceania Pipeline Leak Detection for the Oil and Gas Market by Technology CAGR Forecast 2018-2023, 2023-2028, 2018-2028 (CAGR %)
Table 6-7: ROW Pipeline Leak Detection Market of the Oil and Gas Industry by Technology 2018-2028 ($MN, AGR (%))
Table 6-8: ROW Pipeline Leak Detection of the Oil and Gas Market by Technology CAGR Forecast 2018-2023, 2023-2028, 2018-2028 (CAGR %)
Table 7-1: North America Pipeline Leak Detection Market of the Oil and Gas Industry by Location 2018-2028 ($MN, AGR (%))
Table 7-2: North America Pipeline Leak Detection of the Oil and Gas Market by Location CAGR Forecast 2018-2023, 2023-2028, 2018-2028 (CAGR %)
Table 7-3: Europe Pipeline Leak Detection Market of the Oil and Gas Industry by Location ($MN, AGR (%))
Table 7-4: Europe Pipeline Leak Detection for the Oil and Gas Market by Location CAGR Forecast 2018-2023, 2023-2028, 2018-2028 (CAGR %)
Table 7-5: Asia Oceania Pipeline Leak Detection Market of the Oil and Gas Industry by Location 2018-2028 ($MN, AGR (%))
Table 7-6: Asia Oceania Pipeline Leak Detection of the Oil and Gas Market by Location CAGR Forecast 2018-2023, 2023-2028, 2018-2028 (CAGR %)
Table 7-7: ROW Pipeline Leak Detection Market of the Oil and Gas Industry by Location 2018-2028 ($MN, AGR (%))
Table 7-8: ROW Pipeline Leak Detection of the Oil and Gas Market by Location CAGR Forecast 2018-2023, 2023-2028, 2018-2028 (CAGR %)
Table 8-1: Negative Pressure Wave Pipeline Leak Detection Market of the Oil and Gas Industry by Region 2018-2028 ($MN, AGR (%))
Table 8-2: Negative Pressure Wave Pipeline Leak Detection Market of the Oil and Gas Industry by Region CAGR Forecast 2018-2023, 2023-2028, 2018-2028 (CAGR %)
Table 8-3: E-RTTM Pipeline Leak Detection Market in the Oil and Gas Industry by Region 2018-2028 ($MN, AGR (%))
Table 8-4: E-RTTM Pipeline Leak Detection Market in the Oil and Gas Industry by Region CAGR Forecast 2018-2023, 2023-2028, 2018-2028 (CAGR %)
Table 8-5: Fiber Optic Pipeline Leak Detection Market in the Oil and Gas Industry by Region 2018-2028 ($MN, AGR (%))
Table 8-6: Fiber Optic Pipeline Leak Detection Market in the Oil and Gas Industry by Region CAGR Forecast 2018-2023, 2023-2028, 2018-2028 (CAGR %)
Table 8-7: Mass/Volume Balance Pipeline Leak Detection Market in the Oil and Gas Industry by Region 2018-2028 ($MN, AGR (%))
Table 8-8: Mass/Volume Balance Pipeline Leak Detection Market in the Oil and Gas Industry by Region CAGR Forecast 2018-2023, 2023-2028, 2018-2028 (CAGR %)
Table 8-9: Vapor Sensing Tubes Pipeline Leak Detection Market in the Oil and Gas Industry by Region 2018-2028 ($MN, AGR (%))
Table 8-10: Vapor Sensing Tubes Pipeline Leak Detection Market in the Oil and Gas Industry by Region CAGR Forecast 2018-2023, 2023-2028, 2018-2028 (CAGR %)
Table 9-1: Offshore Pipeline Leak Detection Market of the Oil and Gas Industry by Region 2018-2028 ($MN, AGR (%))
Table 9-2: Offshore Pipeline Leak Detection Market of the Oil and Gas Industry by Region CAGR Forecast 2018-2023, 2023-2028, 2018-2028 (CAGR %)
Table 9-3: Onshore Pipeline Leak Detection Market of the Oil and Gas Industry by Region 2018-2028 ($MN, AGR (%))
Table 9-4: Onshore Pipeline Leak Detection Market of the Oil and Gas Industry by Region CAGR Forecast 2018-2023, 2023-2028, 2018-2028 (CAGR %)
Table 10-1: Atmos International Product Portfolio
Table 10-2: PSI AG Product Portfolio
Table 10-3: Flir Systems, Inc. Product Portfolio
Table 10-4: ClampOn AS Product Portfolio
Table 10-5: Krohne Messtechnik GmbH Product Portfolio
Table 10-6: Pentair PLC Product Portfolio
Table 10-7: Perma-Pipe, Inc. Product Portfolio
Table 10-8: Pure Technologies Ltd. Product Portfolio
Table 10-9: Schneider Electric SE Product Portfolio
Table 10-10: Sensit Technologies LLC Product Portfolio
Table 10-11: Siemens AG Product Portfolio
Table 10-12: Synodon Inc. Product Portfolio
Table 10-13: TTK-Leak Detection System Product Portfolio
Table 10-14: Honeywell International Inc. Product Portfolio
Table 10-15: Asel-Tech, Inc. Product Portfolio
Table 10-16: Omnisens SA Product Portfolio
Table 10-17: OMEGA Engineering, Inc. Product Portfolio
Table 10-18: Other Active Companies in Pipeline Leak Detection Market
List of Figures
Figure 1-1: Leading Pipeline Leak Detection Technology Manufacturers
Figure 2-1: Global Pipeline Detection System in the Oil and Gas Industry Market Segmentation Overview 2018
Figure 3-1: Market: Drivers and Restraints 2018-2028
Figure 3-2: Porter’s Five Forces Analysis of the Pipeline Leak Detection Market of the Oil and Gas Industry 2018-2028
Figure 3-3: Value Chain Analysis of the Pipeline Leak Detection Market of the Oil and Gas Industry 2018-2028
Figure 3-4: Barriers to Entry Analysis Vs. National Market Size (2018) Vs. CAGR (2018-2028)
Figure 5-1: Global Pipeline Leak Detection Market by Region 2018, 2023 and 2028 (%)
Figure 5-2: Global Pipeline Leak Detection Market of the Oil and Gas Industry by Region ($MN)
Figure 5-3: Global Pipeline Leak Detection Market of the Oil and Gas Industry by Region ($MN, AGR (%))
Figure 5-4: Global Pipeline Leak Detection of the Oil and Gas Industry by Region, Cumulative Spending 2018-2028 ($MN)
Figure 5-5: Global Pipeline Leak Detection Market by Technology 2018, 2023 and 2028 (%)
Figure 5-6: Global Pipeline Leak Detection of the Oil and Gas Industry by Technology ($MN)
Figure 5-7: Global Pipeline Leak Detection Market of the Oil and Gas Industry by Technology ($MN, AGR (%))
Figure 5-8: Global Pipeline Leak Detection of the Oil and Gas Industry by Technology, Cumulative Spending 2018-2028 ($Mn)
Figure 5-9: Global Pipeline Leak Detection Market by Location 2018, 2023 and 2028 (%)
Figure 5-10: Global Pipeline Leak Detection of the Oil And Gas Industry by Location ($MN)
Figure 5-11: Global Pipeline Leak Detection Market of the Oil And Gas Industry by Location ($MN, AGR (%))
Figure 5-12: Global Pipeline Leak Detection of the Oil And Gas Industry by Location, Cumulative Spending 2018-2028 ($MN)
Figure 5-13: Pipeline Leak Detection Market of the Oil And Gas Industry in North America ($MN)
Figure 5-14: Pipeline Leak Detection Market of Oil And Gas Industry in North America ($MN, AGR (%))
Figure 5-15: Pipeline Leak Detection Market of the Oil And Gas Industry in Europe ($MN)
Figure 5-16: Pipeline Leak Detection Market of the Oil And Gas Industry in Europe ($MN, AGR (%))
Figure 5-17: Pipeline Leak Detection Market of the Oil And Gas Industry in Asia-Oceania ($MN)
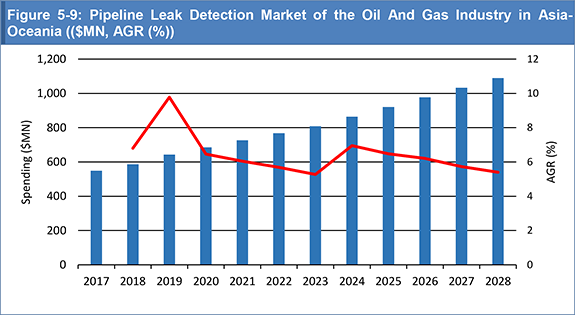
Figure 5-18: Pipeline Leak Detection Market of the Oil And Gas Industry in Asia-Oceania (($MN, AGR (%))
Figure 5-19: Pipeline Leak Detection Market of the Oil And Gas Industry in the ROW ($MN)
Figure 5-20: Pipeline Leak Detection Market of the Oil And Gas Industry in the ROW ($MN, AGR (%))
Figure 6-1: Pipeline Leak Detection of the Oil And Gas Industry By Technology in North America ($MN)
Figure 6-2: Pipeline Leak Detection Market of the Oil And Gas Industry By Technology in North America ($MN, AGR (%))
Figure 6-3: Pipeline Leak Detection of the Oil And Gas Industry by Technology in Europe ($MN)
Figure 6-4: Pipeline Leak Detection Market of the Oil And Gas Industry by Technology in Europe (($MN, AGR (%))
Figure 6-5: Pipeline Leak Detection of the Oil And Gas Industry By Technology in Asia Oceania ($MN)
Figure 6-6: Pipeline Leak Detection Market of the Oil And Gas Industry by Technology in Asia Oceania (($MN, AGR (%))
Figure 6-7: Pipeline Leak Detection of the Oil And Gas Industry by Technology in ROW ($MN)
Figure 6-8: Pipeline Leak Detection Market of the Oil And Gas Industry by Technology in ROW (($MN, AGR (%))
Figure 7-1: Pipeline Leak Detection of the Oil And Gas Industry by Location in North America ($MN)
Figure 7-2: Pipeline Leak Detection Market of the Oil And Gas Industry by Location in North America ($MN, AGR (%))
Figure 7-3: Pipeline Leak Detection of the Oil And Gas Industry by Location in Europe ($MN)
Figure 7-4: Pipeline Leak Detection Market of the Oil And Gas Industry by Location in Europe ($MN, AGR (%))
Figure 7-5: Pipeline Leak Detection of the Oil And Gas Industry by Location in Asia-Oceania ($MN)
Figure 7-6: Pipeline Leak Detection Market of the Oil And Gas Industry by Location in Asia-Oceania ($MN, AGR (%))
Figure 7-7: Pipeline Leak Detection of the Oil And Gas Industry by Location in the ROW ($MN)
Figure 7-8: Pipeline Leak Detection Market of the Oil And Gas Industry By Location in ROW ($MN, AGR (%))
Figure 8-1: Negative Pressure Wave Pipeline Leak Detection Market in the Oil and Gas Industry by Region 2018-2028 ($MN)
Figure 8-2: E-RTTM Pipeline Leak Detection Market in the Oil and Gas Industry by Region 2018-2028 ($MN)
Figure 8-3: Fiber Optic Pipeline Leak Detection Market in the Oil and Gas Industry by Region 2018-2028 ($MN)
Figure 8-4: Mass/Volume Balance Pipeline Leak Detection Market in the Oil and Gas Industry by Region 2018-2028 ($MN)
Figure 8-5: Vapor Sensing Tubes Pipeline Leak Detection Market in the Oil and Gas Industry by Region 2018-2028 ($MN)
Figure 9-1: Offshore Pipeline Leak Detection Market of the Oil and Gas Industry by Region 2018-2028 ($MN)
Figure 9-2: Onshore Pipeline Leak Detection Market of the Oil and Gas Industry by Region 2018-2028 ($MN)
Figure 10-1: PSI AG Revenues 2013-2017 ($Mn)
Figure 10-2: PSI AG Revenues by Business Segments 2017 (%)
Figure 10-3: PSI AG Revenue by Geographic Segments 2017 (%)
Figure 10-4: Flir Systems, Inc. Revenue 2014-2016 ($Mn)
Figure 10-5: Flir Systems, Inc. Revenue by Business Segments 2016 (%)
Figure 10-6: Flir Systems, Inc. Revenue by Geographic Segments 2016 (%)
Figure 10-7: Pentair PLC Revenue 2014-2017 ($Mn)
Figure 10-8: Pentair PLC Revenue Analysis by Business Segments 2017 (%)
Figure 10-9: Pentair PLC Revenue Analysis by Geographical segments 2017 (%)
Figure 10-10: Perma-Pipe, Inc. Revenue 2014-2016 ($Mn)
Figure 10-11: Perma-Pipe, Inc. Revenue by Geographic Segments 2016 (%)
Figure 10-12: Pure Technologies Ltd. Revenue 2014-2016 ($Mn)
Figure 10-13: Pure Technologies Ltd. Revenue by Operating Segments 2016 (%)
Figure 10-14: Schneider Electric SE Revenue 2013-2017 ($Mn)
Figure 10-15: Schneider Electric SE Revenue by Geographic Segment 2017 (%)
Figure 10-16: Schneider Electric SE by Business Segment 2017 (%)
Figure 10-17: Siemens AG Revenue 2013-2017 ($Mn)
Figure 10-18: Siemens AG Revenue by Geographic Segments 2017 (%)
Figure 10-19: Honeywell International Inc. Net Sales 2013-2017 ($Mn)
Figure 10-20: Honeywell International Inc. Net Sales Analysis by Business Segments 2017 (%)
Figure 10-21: Honeywell International Inc. Net Sales Analysis by Geographic Segments 2017 (%)
Aegion Corporation
Airwave Electronics Ltd
American Gas & Chemical Co. Ltd
Atmos International
Broadcom Limited (Avago)
BP
Cameron
ClampOn AS
Concept Controls Inc
Crowcon Detection Instruments Ltd - a Halma company
Desu Systems BV
Detcon, Inc. -a Scott Safety company
EnTech Engineering, Inc.
Enviro Trace Ltd.
ESP Safety, Inc.
Exterran Corporation
ExxonMobil
FLIR Systems Inc.
Frontline Safety (UK) Ltd.
Gas Alarm Systems Ltd
Gazprom
Geospatial Corporation
Hanby Environmental
Hetek Solutions Inc.
Honeywell International Inc.
International Gas Detectors (IGD) Ltd.
IRT Consult Ltd.
KROHNE Messtechnik GmbH
KWJ Engineering, Inc.
LG Electronics Inc.
NXP Semiconductors N.V
Pentair PLC
Pergam-Suisse AG
Perma-Pipe Inc.
Petrobras
Pipa Ltd
Point Safety Ltd
Polycab Wires Pvt. Ltd.
PSI AG
Pure Technologies
Raychem
Ribble Enviro Ltd
Robert Bosch GmbH
Royal Dutch Shell
RR Kabel
Saipem
Samsung Electronics Co Ltd
Saudi Aramco
Schneider Electric
Sensit Technologies LLC
Sharp Corporation
Shell
Siemens AG
Spectris PLC
Sterlite Technologies Ltd.
Stmicroelectronics N.V.
Synodon Inc.
TE Connectivity Ltd.
TechnipFMC
Texas Instruments Inc.
The Sniffers
Total
TraceTek Leak Detection and Locating System
TTK Leak Detection System
Tyco Gas & Flame Detection
United Pipeline Systems, Inc.
Variable Bore Rams, Inc.
Xylem Inc.
Organisations Mentioned
American Gas Association (AGA)
American Petroleum Institute (API)
Association of Oil Pipelines (AOPL)
Canadian Energy Pipeline Association (CEPA)
International Energy Outlook (IEO)
Pipeline Research Council International (PRCI)
United States Environmental Protection Agency (EPA)
US Department of Transportation Agency
US Energy Information Administration (EIA)
US Pipeline Hazardous Materials Safety Administration (PHMSA)
Download sample pages
Complete the form below to download your free sample pages for Pipeline Leak Detection Market of the Oil and Gas Industry 2018-2028
Related reports
-

Carbon Dioxide (CO2) Enhanced Oil Recovery (EOR) Market 2017-2027
The latest report from business intelligence provider visiongain offers in Depth analysis of the global carbon dioxide (CO2) enhanced oil...
Full DetailsPublished: 08 August 2017 -
Small Scale Liquefied Natural Gas (LNG) Market Forecast 2018-2028
Visiongain has calculated that the global Small Scale Liquefied Natural Gas (LNG) Market will see a capital expenditure (CAPEX) of...
Full DetailsPublished: 05 February 2018 -

Critical Infrastructure Protection (CIP) Market Report 2018-2028
Our 304 page report provides 198 tables, charts, and graphs. Read on to discover the most lucrative areas in the...
Full DetailsPublished: 28 June 2018 -

Border Security Market Report 2018-2028
The latest report from business intelligence provider Visiongain offers comprehensive analysis of the global border security market. Visiongain assesses that...
Full DetailsPublished: 29 May 2018 -

EOR Yearbook 2018: The Ultimate Guide To Enhanced Oil Recovery (EOR)
Visiongain’s latest EOR yearbook provides you with this unprecedented in-Depth analysis of the global EOR market. Visiongain assesses that the...
Full DetailsPublished: 24 January 2018 -

Top 20 Distributed Fibre Optic Sensing (DFOS) Companies 2019
The market for DFOS technologies is expected to be valued US$1,040.7 million in 2019. ...Full DetailsPublished: 14 March 2019 -
LNG Yearbook 2018: The Ultimate Guide to Liquefied Natural Gas Infrastructure 2018-2028
The definitive LNG Yearbook 2018 is the ultimate reference source for the liquefied natural gas industry. The yearbook indicates that...
Full DetailsPublished: 14 June 2018 -
Oil & Gas Subsea Umbilicals, Risers & Flowlines (SURF) Market Report 2019-2029
Visiongain has calculated that the global subsea umbilicals, risers and flowlines (SURF) market will see a capital expenditure (CAPEX) of...
Full DetailsPublished: 02 November 2018 -

US Border Security Market Report 2018-2028
Visiongain’s definitive new report assesses that the US Border Security market will reach $5,853mn in 2018. The performance of the...
Full DetailsPublished: 08 December 2017 -

Fibre Optic Market Outlook to 2027
Fibre optics is the technology used to transmit information through very fine glass or plastic optical fibres from one source...
Full DetailsPublished: 04 December 2017
Download sample pages
Complete the form below to download your free sample pages for Pipeline Leak Detection Market of the Oil and Gas Industry 2018-2028
Do you have any custom requirements we can help you with?
Any specific country, geo region, market segment or specific company information?
Email us today, we can discuss your needs and see how we can help: jamie.roberts@visiongain.com
Would you like a free report overview of the report of your choice?
If so, please drop an email to Jamie Roberts stating your chosen report title to jamie.roberts@visiongain.com
Visiongain energy reports are compiled using a broad and rich mixture of both primary and secondary information to produce an overall industry outlook. In order to provide our clients with the best product possible product, we do not rely on any one single source of information. Visiongain analysts reach out to market-leading vendors and industry experts where possible but also review a wealth of financial data and product information from a vast range of sources. To find out more about our reports methodology, please email jamie.roberts@visiongain.com
Would you like to get the latest Visiongain energy reports catalogue?
What are the dynamic growth sectors? where are the regional business opportunities?
Which technologies will prevail and who are the leading companies succeeding in these sectors and why?
If you want definitive answers to business critical questions, discover Visiongain’s full range of business intelligence reports.
If so, please email Jamie Roberts on jamie.roberts@visiongain.com or call her today on +44 207 336 6100
“The Visiongain report was extremely insightful and helped us construct our basic go-to market strategy for our solution.”
H.
“F.B has used Visiongain to prepare two separate market studies on the ceramic proppants market over the last 12 months. These reports have been professionally researched and written and have assisted FBX greatly in developing its business strategy and investment plans.”
F.B
“We just received your very interesting report on the Energy Storage Technologies (EST) Market and this is a very impressive and useful document on that subject.”
I.E.N
“Visiongain does an outstanding job on putting the reports together and provides valuable insight at the right informative level for our needs. The EOR Visiongain report provided confirmation and market outlook data for EOR in MENA with the leading countries being Oman, Kuwait and eventually Saudi Arabia.”
E.S
“Visiongain produced a comprehensive, well-structured GTL Market report striking a good balance between scope and detail, global and local perspective, large and small industry segments. It is an informative forecast, useful for practitioners as a trusted and upto-date reference.”
Y.N Ltd
Association of Dutch Suppliers in the Oil & Gas Industry
Society of Naval Architects & Marine Engineers
Association of Diving Contractors
Association of Diving Contractors International
Associazione Imprese Subacquee Italiane
Australian Petroleum Production & Exploration Association
Brazilian Association of Offshore Support Companies
Brazilian Petroleum Institute
Canadian Energy Pipeline
Diving Medical Advisory Committee
European Diving Technology Committee
French Oil and Gas Industry Council
IMarEST – Institute of Marine Engineering, Science & Technology
International Association of Drilling Contractors
International Association of Geophysical Contractors
International Association of Oil & Gas Producers
International Chamber of Shipping
International Shipping Federation
International Marine Contractors Association
International Tanker Owners Pollution Federation
Leading Oil & Gas Industry Competitiveness
Maritime Energy Association
National Ocean Industries Association
Netherlands Oil and Gas Exploration and Production Association
NOF Energy
Norsk olje og gass Norwegian Oil and Gas Association
Offshore Contractors’ Association
Offshore Mechanical Handling Equipment Committee
Oil & Gas UK
Oil Companies International Marine Forum
Ontario Petroleum Institute
Organisation of the Petroleum Exporting Countries
Regional Association of Oil and Natural Gas Companies in Latin America and the Caribbean
Society for Underwater Technology
Society of Maritime Industries
Society of Petroleum Engineers
Society of Petroleum Enginners – Calgary
Step Change in Safety
Subsea UK
The East of England Energy Group
UK Petroleum Industry Association
All the events postponed due to COVID-19.
Don’t Miss Out!
Subscribe to receive the latest Industry news, trending insight and analysis straight to your inbox.Choose your preferences:
Latest Energy news
Energy as a Service (EaaS) Market
The global Energy as a Service (EaaS) market is projected to grow at a CAGR of 12.6% by 2034
25 July 2024
Synthetic Fuels Market
The global Synthetic Fuels market is projected to grow at a CAGR of 23% by 2034
18 July 2024
Power-to-X (P2X) Market
The global Power-to-X (P2X) market is projected to grow at a CAGR of 10.6% by 2034
09 July 2024
Airborne Wind Energy Market
The global Airborne Wind Energy market is projected to grow at a CAGR of 9.7% by 2034
05 June 2024
