Industries > Energy > Liquefied Natural Gas (LNG) Carrier Market Report 2019-2029
Liquefied Natural Gas (LNG) Carrier Market Report 2019-2029
Forecasts by Type (GTT NO 96, Mark II, Moss, SPB and Small Scale), by Market Type (Retrofit/Converted and New Build), by Propulsion Type (XDF, ME-GI, SSD, TFDE, DFDE, Steam, Others) Plus Contract Tables & Profiles of Leading Companies
The latest report from business intelligence provider Visiongain offers comprehensive analysis of the global LNG carrier market. Visiongain assesses that this market will generate revenues of US17.55bn in 2019.
How this report will benefit you
Read on to discover how you can exploit the future business opportunities emerging in this sector. Visiongain’s new study tells you and tells you NOW.
In this brand new report you find 200+ in-depth tables, charts and graphs.
The 266 page report provides clear detailed insight into the global LNG carrier. Discover the key drivers and challenges affecting the market.
By ordering and reading our brand new report today you stay better informed and ready to act.
Report Scope
The Report Provides Detailed Profiles Of Key Companies Operating Within The LNG Carrier Market:
Samsung Heavy Industries (SHI)
Kawasaki Heavy Industries (KHI)
NYK Line.
Misc Berhad
STX Offshore and Shipbuilding
Hudong Zhonghua
Daewoo Shipbuilding and Marine Engineering (DSME)
Mitsubishi Heavy Industries, Ltd. (MHI)
Maran Gas Maritime Inc. (MGM)
Hyundai Heavy Industries Co.,(HHI) Ltd.
Global Liquefied Natural Gas (LNG) Carrier Forecasts From 2019-2029
Global Liquefied Natural Gas (LNG) Carrier Submarkets Forecasts, by Type 2019-2029
GTT No 96 Liquefied Natural Gas (LNG) Carrier Forecasts 2019-2029
Mark III Forecasts 2019-2029
Moss Forecasts 2019-2029
SPB Forecasts 2019-2029
Small Scale Forecasts 2019-2029
Global Liquefied Natural Gas (LNG) Carrier Submarkets Forecasts, by Market Type 2019-2029
Retrofit/Conversion Forecast 2019-2029
New Build Forecast 2019-2029
Global Liquefied Natural Gas (LNG) Carrier Submarkets Forecasts, by Propulsion Type 2019-2029
XDF Forecast 2019-2029
ME-GI Forecast 2019-2029
SSD Forecast 2019-2029
TFDE Forecast 2019-2029
DFDE Forecast 2019-2029
Steam Forecast 2019-2029
Others Forecast 2019-2029
Leading Regional Players in Liquefied Natural Gas (LNG) Carrier Market 2019-2029
China Liquefied Natural Gas (LNG) Carrier Forecast 2019-2029
Japan Liquefied Natural Gas (LNG) Carrier Forecast 2019-2029
South Korea Liquefied Natural Gas (LNG) Carrier Forecast 2019-2029
India Liquefied Natural Gas (LNG) Carrier Forecast 2019-2029
Greece Liquefied Natural Gas (LNG) Carrier Forecast 2019-2029
Qatar Liquefied Natural Gas (LNG) Carrier Forecast 2019-2029
Rest of the World Liquefied Natural Gas (LNG) Carrier Forecast 2019-2029
How will you benefit from this report?
• Keep your knowledge base up to speed. Don’t get left behind
• Reinforce your strategic decision-making with definitive and reliable market data
• Learn how to exploit new technological trends
• Realise your company’s full potential within the market
• Understand the competitive landscape and identify potential new business opportunities & partnerships
Who should read this report?
• Anyone within the LNG carrier value chain.
• LNG vessel manufacturers
• Oil & gas companies
• Engineering contractors
• Technologists
• Business development managers
• Marketing managers
• Market analysts
• Consultants
• Investors
• Banks
• Government agencies
• Associations
Visiongain’s study is intended for anyone requiring commercial analyses for the LNG carrier market and leading companies. You find data, trends and predictions.
Buy our report today Liquefied Natural Gas (LNG) Carrier Market Report 2019-2029: Forecasts by Type (GTT NO 96, Mark II, Moss, SPB and Small Scale), by Market Type (Retrofit/Converted and New Build), by Propulsion Type (XDF, ME-GI, SSD, TFDE, DFDE, Steam, Others) Plus Contract Tables & Profiles of Leading Companies.
Visiongain is a trading partner with the US Federal Government
CCR Ref number: KD4R6
Do you have any custom requirements we can help you with? Any need for specific country, geo region, market segment or specific company information? Contact us today, we can discuss your needs and see how we can help: sara.peerun@visiongain.com
1.1 Liquefied Natural Gas (LNG) Carrier Market Overview
1.2 Market Structure Overview and Market Definition
1.3 Why You Should Read This Report
1.4 How This Report Delivers
1.5 Key Questions Answered by This Analytical Report Include:
1.6 Who is This Report For?
1.7 Methodology
1.7.1 Primary Research
1.7.2 Secondary Research
1.7.3 Market Evaluation & Forecasting Methodology
1.8 Frequently Asked Questions (FAQ)
1.9 Associated Visiongain Reports
1.10 About Visiongain
2. Introduction to the Liquefied Natural Gas (LNG) Carrier Market
2.1 Global LNG Carrier Market Structure
2.2 Market Definition
2.3 LNG Carrier Industry Outlook
2.4 LNG- Value Chain Analysis
3. Global Overview of Liquefied Natural Gas (LNG) Carrier Market
3.1 LNG Carriers Fleet and Historical Data
3.2 Global Liquefied Natural Gas (LNG) Carrier Drivers and Restraints
4. Global LNG Carrier Submarkets Forecast 2019-2029
4.1 Global Liquefied Natural Gas (LNG) Carrier Submarkets Forecasts, by Type 2019-2029
4.1.1 Global GTT No 96 Liquefied Natural Gas (LNG) Carrier Forecasts 2019-2029
4.1.2 Global Mark III Forecasts 2019-2029
4.1.3 Global Moss Forecasts 2019-2029
4.1.4 Global SPB Forecasts 2019-2029
4.1.5 Global Small Scale Forecasts 2019-2029
4.2 Global Liquefied Natural Gas (LNG) Carrier Submarkets Forecasts, by Market Type 2019-2029
4.2.1 Global Retrofit/Conversion Liquefied Natural Gas (LNG) Carrier Forecasts 2019-2029
4.2.2 Global New Build Forecasts 2019-2029
4.3 Global Liquefied Natural Gas (LNG) Carrier Submarkets Forecasts, by Propulsion Type 2019-2029
4.3.1 Global Steam Reheat Liquefied Natural Gas (LNG) Carrier Forecasts 2019-2029
4.3.2 Global XDF Forecasts 2019-2029
4.3.3 Global ME-GI Forecasts 2019-2029
4.3.4 Global SSD Forecasts 2019-2029
4.3.5 Global TFDE Forecasts 2019-2029
4.3.6 Global DFDE Forecasts 2019-2029
4.3.7 Global Steam Forecasts 2019-2029
4.3.8 Global Others Forecasts 2019-2029
5. Leading Regional Players in Liquefied Natural Gas (LNG) Carrier Market 2019-2029
5.1. China Liquefied Natural Gas (LNG) Carrier Market
5.2. Japan Liquefied Natural Gas (LNG) Carrier Market
5.3. South Korea Liquefied Natural Gas (LNG) Carrier Market
5.4. India Liquefied Natural Gas (LNG) Carrier Market
5.5. Greece Liquefied Natural Gas (LNG) Carrier Market
5.6. Qatar Liquefied Natural Gas (LNG) Carrier Market
5.7. Rest of the World Liquefied Natural Gas (LNG) Carrier Market
6. PESTEL Analysis of the LNG Carrier Market
7. Expert Opinion
7.1 Primary Correspondents
7.2 Global LNG Infra Market Outlook
7.3 Driver & Restraints
7.4 Dominant Region/Country in the LNG Carrier Market
7.5 Dominant LNG Carrier Type
7.6 Overall Growth Rate, Globally
8. Leading Companies in LNG Carrier Market
8.1 Global LNG Carrier Market, Company Market Share (%), 2018
8.2 Samsung Heavy Industries (SHI)
8.3 Kawasaki Heavy Industries
8.4 NYK Line.
8.5 Misc Berhad
8.6 STX Offshore and Shipbuilding
8.7 Hudong Zhonghua
8.8 Daewoo Shipbuilding and Marine Engineering (DSME)
8.9 Mitsubishi Heavy Industries, Ltd.
8.10 Maran Gas Maritime Inc. (MGM)
8.11 Hyundai Heavy Industries Co., Ltd.
9. Conclusion & Recommendations
10. Glossary
List of Tables
Table 1.1 The LNG Carrier Market by Regional Market Forecast 2019-2029 ($ mn, MCM, AGR %, CAGR)
Table 3.1 Global Liquefied Natural Gas (LNG)Carrier Market by Forecast 2019-2029 ($mn, MCM, AGR %, CAGR %, Cumulative)
Table 3.2 LNG Carriers List, Above 60,000cm of Capacity, (Year Built, Ship Name, Shipbuilder, Capacity (cm), Operator, Cargo System)
Table 3.3 Global Liquefaction Natural Gas (LNG) Carrier Drivers and Restraints
Table 4.1 Global Liquefied Natural Gas (LNG) Carrier Submarket Forecast 2019-2029($mn, MCM, AGR %, Cumulative)
Table 4.2 Global GTT No 96 Liquefied Natural Gas (LNG) Carrier Market by Forecast 2019-2029 ($mn, MCM, AGR %, CAGR %, Cumulative)
Table 4.3 GTT No. 96 LNG Carrier Orders (Containment System, Shipbuilder, Owner, Year, Capacity (cm))
Table 4.4 Global GTT No. 96 Drivers and Restraints
Table 4.5 Global Mark III Liquefied Natural Gas (LNG) Carrier Market by Forecast 2019-2029 ($mn, MCM, AGR %, CAGR %, Cumulative)
Table 4.6 Mark III LNG Carrier Orders (Containment System, Shipbuilder, Owner, Year, Capacity (cm))
Table 4.7 Global Mark III Drivers and Restraints
Table 4.8 Global Moss Liquefied Natural Gas (LNG) Carrier Market by Forecast 2019-2029 ($mn, MCM, AGR %, CAGR %, Cumulative)
Table 4.9 Moss LNG Carrier Orders (Containment System, Shipbuilder, Owner, Year, Capacity (cm))
Table 4.10 Global Moss Drivers and Restraints
Table 4.11 Global SPB No 96 Liquefied Natural Gas (LNG) Carrier Market by Forecast 2019-2029 ($mn, MCM, AGR %, CAGR %, Cumulative)
Table 4.12 SPB LNG Carrier Orders (Containment System, Shipbuilder, Owner, Year, Capacity (cm))
Table 4.13 Global SBP Drivers and Restraints
Table 4.14 Global Small Scale Liquefied Natural Gas (LNG) Carrier Market by Forecast 2019-2029 ($mn, MCM, AGR %, CAGR %, Cumulative)
Table 4.15 Global Liquefied Natural Gas (LNG) Carrier Submarket Forecast 2019-2029($mn, MCM, AGR %, Cumulative)
Table 4.16 Global Retrofit/ Converted Liquefied Natural Gas (LNG) Carrier Market by Forecast 2019-2029 ($mn, MCM, AGR %, CAGR %, Cumulative)
Table 4.17 Global Retrofit/Conversion Drivers and Restraints
Table 4.18 Global New Build Liquefied Natural Gas (LNG) Carrier Market by Forecast 2019-2029 ($mn, MCM, AGR %, CAGR %, Cumulative)
Table 4.19 Global New Build LNG Carrier Drivers and Restraints
Table 4.20 Global Liquefied Natural Gas (LNG) Carrier Submarket Forecast 2019-2029($mn, MCM, AGR %, Cumulative)
Table 4.21 Global Steam Reheat Liquefied Natural Gas (LNG) Carrier Market by Forecast 2019-2029 ($mn, MCM, AGR %, CAGR %, Cumulative)
Table 4.22 Global XDF Liquefied Natural Gas (LNG) Carrier Market by Forecast 2019-2029 ($mn, MCM, AGR %, CAGR %, Cumulative)
Table 4.23 Global ME-GI Liquefied Natural Gas (LNG) Carrier Market by Forecast 2019-2029 ($mn, MCM, AGR %, CAGR %, Cumulative)
Table 4.24 Global SSD Liquefied Natural Gas (LNG) Carrier Market by Forecast 2019-2029 ($mn, MCM, AGR %, CAGR %, Cumulative)
Table 4.25 Global TFDE Liquefied Natural Gas (LNG) Carrier Market by Forecast 2019-2029 ($mn, MCM, AGR %, CAGR %, Cumulative)
Table 4.26 Global DFDE Liquefied Natural Gas (LNG) Carrier Market by Forecast 2019-2029 ($mn, MCM, AGR %, CAGR %, Cumulative)
Table 4.27 Global Steam Liquefied Natural Gas (LNG) Carrier Market by Forecast 2019-2029 ($mn, MCM, AGR %, CAGR %, Cumulative)
Table 4.28 Global Others Liquefied Natural Gas (LNG) Carrier Market by Forecast 2019-2029 ($mn, MCM, AGR %, CAGR %, Cumulative)
Table 5.1 Global LNG Carrier Market, by Country/Region Forecast 2019-2029 ($mn, AGR %, Cumulative)
Table 5.2 Global LNG Carrier Market, by Country/Region Forecast 2019-2029 (MCM, AGR %, Cumulative)
Table 5.3 China Liquefied Natural Gas (LNG)Carrier Market by Forecast 2019-2029 ($mn, MCM, AGR %, CAGR %, Cumulative)
Table 5.4 Chinese LNG Import Terminals (Country, Terminal Name, Start Year, Capacity (MTPA), EPC Cost ($), Owners, Status)
Table 5.5 Current Chinese LNG Carrier Order Book (Containment System, Shipbuilder, Owner, Delivery Year, Capacity (cm))
Table 5.6 China Liquefaction Natural Gas (LNG) Carrier Drivers and Restraints
Table 5.7 Japan Liquefied Natural Gas (LNG)Carrier Market by Forecast 2019-2029 ($mn, MCM, AGR %, CAGR %, Cumulative)
Table 5.8 Current Japanese LNG Carrier Order Book (Containment System, Shipbuilder, Owner, Year, Capacity (cm))
Table 5.9 Japan Liquefaction Natural Gas (LNG) Carrier Drivers and Restraints
Table 5.10 South Korea Liquefied Natural Gas (LNG)Carrier Market by Forecast 2019-2029 ($mn, MCM, AGR %, CAGR %, Cumulative)
Table 5.11 Current South Korean LNG Carrier Order Book (Containment System, Shipbuilder, Owner, Year, Capacity(cm)
Table 5.12 South Korea Liquefaction Natural Gas (LNG) Carrier Drivers and Restraints
Table 5.13 India Liquefied Natural Gas (LNG)Carrier Market by Forecast 2019-2029 ($mn, MCM, AGR %, CAGR %, Cumulative)
Table 5.14 India Liquefaction Natural Gas (LNG) Carrier Drivers and Restraints
Table 5.15 Greece Liquefied Natural Gas (LNG)Carrier Market by Forecast 2019-2029 ($mn, MCM, AGR %, CAGR %, Cumulative)
Table 5.16 Greece Liquefaction Natural Gas (LNG) Carrier Drivers and Restraints
Table 5.17 Qatar Liquefied Natural Gas(LNG)Carrier Market by Forecast 2019-2029 ($mn, MCM, AGR %, CAGR %, Cumulative)
Table 5.18 Qatar Liquefaction Natural Gas (LNG) Carrier Drivers and Restraints
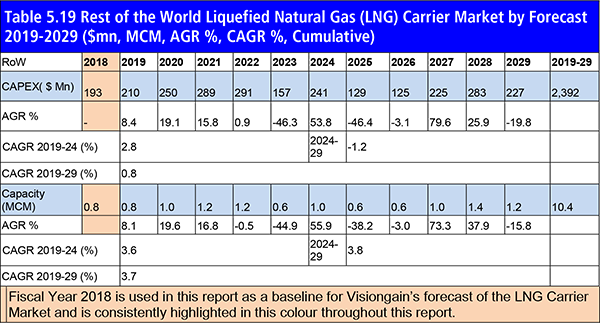
Table 5.19 Rest of the World Liquefied Natural Gas(LNG)Carrier Market by Forecast 2019-2029 ($mn, MCM, AGR %, CAGR %, Cumulative)
Table 5.20 Rest of the World Liquefaction Natural Gas (LNG) Carrier Drivers and Restraints
Table 6.1 PESTEL Analysis, LNG Carrier Market
Table 8.1 Samsung Heavy Industries (SHI) Profile 2016(Market Entry, Public/Private, Headquarter, Total Company Sales $mn, Change in Revenue, Geography, Key Market, Company Sales from Hydrogen Generator Market, Listed on, Products/Services Strongest Business Region, Business Segment in the Market, Submarket Involvement, No. of Employees)
Table 8.2 Samsung Heavy Industries LNG Carrier Orders (Containment System, Shipbuilder, Owner, Year, Capacity (cm))
Table 8.3 Samsung Heavy Industries (SHI) Total Company Sales 2013-2017 ($ bn, AGR %)
Table 8.4 Kawasaki Heavy Industries Profile 2015(Market Entry, Public/Private, Headquarter, Total Company Sales $bn, Change in Revenue, Geography, Key Market, Company Sales from Hydrogen Generator Market, Listed on, Products/Services Strongest Business Region, Business Segment in the Market, Submarket Involvement, No. of Employees)
Table 8.5 Kawasaki Heavy Industries LNG Carrier Orders (Containment System, Shipbuilder, Owner, Year, Capacity (cm))
Table 8.6 Kawasaki Heavy Industries Total Company Sales 2014-2018 ($ bn, AGR %)
Table 8.7 NYK Line. Profile 2016(Market Entry, Public/Private, Headquarter, Total Company Sales $bn, Change in Revenue, Geography, Key Market, Company Sales from Hydrogen Generator Market, Listed on, Products/Services Strongest Business Region, Business Segment in the Market, Submarket Involvement, No. of Employees)
Table 8.8 NYK Line. Overview (Total Revenue, Total LNG Carrying Capacity, Percentage in Order Book, Existing Vessels – Orders – Joint Projects, HQ, Contact, Website)
Table 8.9 NYK Line.Total Company Sales 2015-2018 ($ bn, AGR %)
Table 8.10 Misc Berhad Profile 2016(Market Entry, Public/Private, Headquarter, Total Company Sales $bn, Change in Revenue, Geography, Key Market, Company Sales from Hydrogen Generator Market, Listed on, Products/Services Strongest Business Region, Business Segment in the Market, Submarket Involvement, No. of Employees)
Table 8.11 Misc Berhad LNG Carrier Orders (Containment System, Shipbuilder, Owner, Year, Capacity)
Table 8.12 Misc Berhad Total Company Sales 2015-2018 ($ bn, AGR %)
Table 8.13 Misc Berhad, List of LNG Carriers Owned
Table 8.14 STX Offshore and Shipbuilding Profile 2013 (Market Entry, Public/Private, Headquarter, Total Company Sales $bn, Change in Revenue, Geography, Key Market, Company Sales from Hydrogen Generator Market, Listed on, Products/Services Strongest Business Region, Business Segment in the Market, Submarket Involvement, No. of Employees)
Table 8.15 Hudong Zhonghua Profile(Market Entry, Public/Private, Headquarter, Total Company Sales $bn, Change in Revenue, Geography, Key Market, Company Sales from Hydrogen Generator Market, Listed on, Products/Services Strongest Business Region, Business Segment in the Market, Submarket Involvement, No. of Employees)
Table 8.16 Hudong Zhonghua LNG Carrier Orders (Containment System, Shipbuilder, Owner, Year, Capacity (cm))
Table 8.17 Daewoo Shipbuilding and Marine Engineering (DSME) Profile 2017 (Market Entry, Public/Private, Headquarter, Total Company Sales $bn, Change in Revenue, Geography, Key Market, Company Sales from Hydrogen Generator Market, Listed on, Products/Services Strongest Business Region, Business Segment in the Market, Submarket Involvement, No. of Employees)
Table 8.18 Daewoo Shipbuilding and Marine Engineering (DSME, Fleet StTA
Table 8.19 Daewoo Shipbuilding and Marine Engineering (DSME)Total Company Sales 2014-2017 ($ bn, AGR %)
Table 8.20 Mitsubishi Heavy Industries, Ltd. Profile 2016(Market Entry, Public/Private, Headquarter, Total Company Sales $bn, Change in Revenue, Geography, Key Market, Company Sales from Hydrogen Generator Market, Listed on, Products/Services Strongest Business Region, Business Segment in the Market, Submarket Involvement, No. of Employees)
Table 8.21 Mitsubishi Heavy Industries LNG Carrier Orders (Containment System, Shipbuilder, Owner, Year, Capacity (cm))
Table 8.22 Mitsubishi Heavy Industries, Ltd.,Total Company Sales 2013-2017 ($bn, AGR %)
Table 8.23 Maran Gas Maritime Inc. (MGM)Profile 2016(Market Entry, Public/Private, Headquarter, Total Company Sales $mn, Change in Revenue, Geography, Key Market, Company Sales from Hydrogen Generator Market, Listed on, Products/Services Strongest Business Region, Business Segment in the Market, Submarket Involvement, No. of Employees)
Table 8.24 MGM LNG Fleet Statistics, 2019
Table 8.25 MGM LNG Carrier Orders (Containment System, Shipbuilder, Owner, Year, Capacity)
Table 8.26 Hyundai Heavy Industries Co., Ltd.Profile 2016(Market Entry, Public/Private, Headquarter, Total Company Sales $mn, Change in Revenue, Geography, Key Market, Company Sales from Hydrogen Generator Market, Listed on, Products/Services Strongest Business Region, Business Segment in the Market, Submarket Involvement, No. of Employees)
Table 8.27 Hyundai Heavy Industries Co. and Hyundai Samho LNG Carrier Orders (Shipbuilder, Future Owner, Tank Type, LNG Capacity (cm), Delivery Date)
Table 8.28 Hyundai Heavy Industries (HHI) Total Company Sales 2015-2017 ($ bn, AGR %)
Table 8.29 Hyundai Heavy Industries Co., Performance Record- As of December 31, 2018
List of Figures
Figure 1.1 The LNG Carrier Market by Country/Region Market Share Forecast 2019, 2024, 2029 (% Share)
Figure 2.1 Global LNG Carrier Market Segmentation Overview
Figure 2.2 Small Scale LNG, Value Chain Analysis
Figure 3.1 Global Liquefied Natural Gas (LNG) Carrier Forecast 2019-2029 ($mn, AGR %)
Figure 3.2 Global LNG Carrier, by Capacity (MCM)Forecast 2019-2029 (MCM)
Figure 4.1 Global Liquefied Natural Gas (LNG) Carrier Submarket Forecast 2019-2029 ($mn)
Figure 4.2 Global Liquefied Natural Gas (LNG) Carrier Market by Type (CAPEX) Share Forecast 2019, 2024, 2029 (% Share)
Figure 4.3 Global Liquefied Natural Gas (LNG) Carrier Submarket Forecast 2019-2029 (MCM)
Figure 4.4 Liquefied Natural Gas (LNG) Carrier Market, By GTT No 96 Forecast 2019-2029 ($mn, AGR%)
Figure 4.5 Liquefied Natural Gas (LNG) Carrier Market, By GTT No. 96 Forecast 2019-2029 (MCM, AGR%)
Figure 4.6 Liquefied Natural Gas (LNG) Carrier Market, By Mark III Forecast 2019-2029 ($mn, AGR%)
Figure 4.7 Liquefied Natural Gas (LNG) Carrier Market, By Mark III Forecast 2019-2029 (MCM, AGR%)
Figure 4.8 Liquefied Natural Gas (LNG) Carrier Market, By Moss Forecast 2019-2029 ($mn, AGR%)
Figure 4.9 Liquefied Natural Gas (LNG) Carrier Market, By Moss Forecast 2019-2029 (MCM, AGR%)
Figure 4.10 Liquefied Natural Gas (LNG) Carrier Market, By SPB Forecast 2019-2029 ($mn, AGR%)
Figure 4.11 Liquefied Natural Gas (LNG) Carrier Market, By SPB Forecast 2019-2029 (MCM, AGR%)
Figure 4.12 Liquefied Natural Gas (LNG) Carrier Market, By Small Scale Forecast 2019-2029 ($mn, AGR%)
Figure 4.13 Liquefied Natural Gas (LNG) Carrier Market, By Small Scale Forecast 2019-2029 (MCM, AGR%)
Figure 4.14 LNG Bunkering Capacity Forecast (bcm), 2015-2025
Figure 4.15 Liquefied Natural Gas (LNG) Carrier Market, By Retrofit/Conversion Forecast 2019-2029 (MCM, AGR%)
Figure 4.16 Global Liquefied Natural Gas (LNG) Carrier Submarket Forecast 2019-2029 ($mn)
Figure 4.17 Global Liquefied Natural Gas (LNG) Carrier Market by Market Type (CAPEX) Share Forecast 2019, 2024, 2029 (% Share)
Figure 4.18 Liquefied Natural Gas (LNG) Carrier Market, By Retrofit/Conversion Forecast 2019-2029 ($mn, AGR%)
Figure 4.19 Liquefied Natural Gas (LNG) Carrier Market, By Retrofit/Conversion Forecast 2019-2029 (MCM, AGR%)
Figure 4.20 Liquefied Natural Gas (LNG) Carrier Market, By New Build Forecast 2019-2029 ($mn, AGR%)
Figure 4.21 Liquefied Natural Gas (LNG) Carrier Market, By New Build Forecast 2019-2029 (MCM, AGR%)
Figure 4.22 Global Liquefied Natural Gas (LNG) Carrier Submarket Forecast 2019-2029 (MCM)
Figure 4.23 Global Liquefied Natural Gas (LNG) Carrier Submarket Forecast 2019-2029 ($mn)
Figure 4.24 Global Liquefied Natural Gas (LNG) Carrier Market by Market Type (CAPEX) Share Forecast 2019, 2024, 2029 (% Share)
Figure 4.25 Liquefied Natural Gas (LNG) Carrier Market, By Steam Reheat Forecast 2019-2029 ($mn, AGR%)
Figure 4.26 Liquefied Natural Gas (LNG) Carrier Market, By Steam Reheat Forecast 2019-2029 (MCM, AGR%)
Figure 4.27 Liquefied Natural Gas (LNG) Carrier Market, By XDF Forecast 2019-2029 ($mn, AGR%)
Figure 4.28 Liquefied Natural Gas (LNG) Carrier Market, By XDF Forecast 2019-2029 (MCM, AGR%)
Figure 4.29 Liquefied Natural Gas (LNG) Carrier Market, By ME-GI Forecast 2019-2029 ($mn, AGR%)
Figure 4.30 Liquefied Natural Gas (LNG) Carrier Market, By ME-GI Forecast 2019-2029 (MCM, AGR%)
Figure 4.31 Liquefied Natural Gas (LNG) Carrier Market, By SSD Forecast 2019-2029 ($mn, AGR%)
Figure 4.32 Liquefied Natural Gas (LNG) Carrier Market, By SSD Forecast 2019-2029 (MCM, AGR%)
Figure 4.33 Liquefied Natural Gas (LNG) Carrier Market, By TFDE Forecast 2019-2029 ($mn, AGR%)
Figure 4.34 Liquefied Natural Gas (LNG) Carrier Market, By TFDE Forecast 2019-2029 (MCM, AGR%)
Figure 4.35 Liquefied Natural Gas (LNG) Carrier Market, By DFDE Forecast 2019-2029 ($mn, AGR%)
Figure 4.36 Liquefied Natural Gas (LNG) Carrier Market, By DFDE Forecast 2019-2029 (MCM, AGR%)
Figure 4.37 Liquefied Natural Gas (LNG) Carrier Market, By Steam Forecast 2019-2029 ($mn, AGR%)
Figure 4.38 Liquefied Natural Gas (LNG) Carrier Market, By Steam Forecast 2019-2029 (MCM, AGR%)
Figure 4.39 Liquefied Natural Gas (LNG) Carrier Market, By Others Forecast 2019-2029 ($mn, AGR%)
Figure 4.40 Liquefied Natural Gas (LNG) Carrier Market, By Others Forecast 2019-2029 (MCM, AGR%)
Figure 5.1 Regional/Country LNG Carrier Market, by CAPEX
Figure 5.2 Regional/Country LNG Carrier Market, by Capacity (MCM)
Figure 5.3 Leading Country/Regional LNG Carrier Market Share, by CAPEX 2019
Figure 5.4 Leading Country/Regional LNG Carrier Market Share, by CAPEX 2024
Figure 5.5 Leading Country/Regional LNG Carrier Market Share, by CAPEX 2029
Figure 5.6 China LNG Carrier Forecast 2019-2029($mn, AGR%)
Figure 5.7 China LNG Carrier Share Forecast 2018, 2023, 2028 (% Share)
Figure 5.8 China LNG Carrier, by Capacity(MCM)Forecast 2019-2029 (MCM)
Figure 5.9 China LNG Carrier, by Type, 2018
Figure 5.10 Japan LNG Carrier Forecast 2019-2029 ($mn, AGR%)
Figure 5.11 Japan LNG Carrier Share Forecast 2019, 2024, 2029 (% Share)
Figure 5.12 Japan LNG Carrier, by Capacity (MCM)Forecast 2019-2029 (MCM)
Figure 5.13 Japan LNG Carrier, by Type, 2018
Figure 5.14 South Korea LNG Carrier Forecast 2019-2029 ($mn, AGR%)
Figure 5.15 South Korea LNG Carrier Share Forecast 2019, 2024, 2029 (% Share)
Figure 5.16 South Korea LNG Carrier, by Capacity (MCM)Forecast 2019-2029(MCM)
Figure 5.17 South Korea LNG Carrier, by Type, 2017
Figure 5.18 India LNG Carrier Forecast 2019-2029 ($mn, AGR%)
Figure 5.19 India LNG Carrier Share Forecast 2019, 2024, 2029 (% Share)
Figure 5.20 India LNG Carrier, by Type, 2018
Figure 5.21 India LNG Carrier, by Capacity (MCM)Forecast 2019-2029 (MCM)
Figure 5.22 Greece LNG Carrier Forecast 2019-2029 ($mn, AGR%)
Figure 5.23 Greece LNG Carrier Share Forecast 2019, 2024, 2029 (% Share)
Figure 5.24 Greece LNG Carrier, by Type, 2018
Figure 5.25 Greece LNG Carrier, by Capacity (MCM)Forecast 2019-2029 (MCM)
Figure 5.26 Qatar LNG Carrier Forecast 2019-2029 ($mn, AGR%)
Figure 5.27 Qatar LNG Carrier Share Forecast 2019, 2024, 2029 (% Share)
Figure 5.28 Qatar LNG Carrier, by Type, 2018
Figure 5.29 Qatar LNG Carrier, by Capacity (MCM)Forecast 2019-2029 (MCM)
Figure 5.30 Rest of the World LNG Carrier Forecast 2019-2029 ($mn, AGR%)
Figure 5.31 Rest of the World LNG Carrier Share Forecast 2019, 2024, 2029(% Share)
Figure 5.32 Rest of the World LNG Carrier, by Capacity (MCM)Forecast 2019-2029 (MCM)
Figure 5.33 Rest of the World LNG Carrier, by Type, 2018
Figure 8.1 Leading Companies Market Share, 2018 LNG Carrier Market
Figure 8.2 Leading Companies Market Share, 2017 LNG Carrier Market (By Orderbook)
Figure 8.3 Samsung Heavy Industries (SHI), Contracts Share %
Figure 8.4 Samsung Heavy Industries (SHI) Revenue,($bn & AGR %), Y-o-Y Revenue Growth, 2013-2017
Figure 8.5 Kawasaki Heavy Industries, % Revenue Share, by Business Segment, 2018
Figure 8.6 Kawasaki Heavy Industries, % Revenue Share, by Geographical Segment, 2018
Figure 8.7 Kawasaki Heavy Industries Revenue,($bn & AGR %), Y-o-Y Revenue Growth, 2014-2018
Figure 8.8 NYK Line., % Revenue Share, by Business Segment, 2017
Figure 8.9 NYK Line., Number of Patents, 2013-2017
Figure 8.10 NYK Line., Number of Vessels in Operation, 2013-2017
Figure 8.11 NYK Line.Revenue,($bn & AGR %), Y-o-Y Revenue Growth, 2015-2018
Figure 8.12 Misc Berhad LNG Revenue,($bn & AGR %), Y-o-Y Revenue Growth, 2015-2018
Figure 8.13 Misc Berhad Revenue Breakup, by Business Segment,2018
Figure 8.14 Misc Berhad Revenue Breakup, by Contract,2018
Figure 8.15 Daewoo Shipbuilding and Marine Engineering (DSME, % Revenue Share, by Business Segment, 2017
Figure 8.16 Daewoo Shipbuilding and Marine Engineering (DSME),($mn & AGR %), Y-o-Y Revenue Growth, 2014-2017
Figure 8.17 Mitsubishi Heavy Industries, Ltd., Company Revenue,($bn & AGR %), 2013-2017
Figure 8.18 Mitsubishi Heavy Industries, Ltd., % Revenue Share, by Regional Segment, 2017
Figure 8.19 Mitsubishi Heavy Industries, Ltd., % Revenue Share, by Business Segment, 2017
Figure 8.20 Hyundai Heavy Industries Co., % Revenue Share, by Sales, 2017
Figure 8.21 Hyundai Heavy Industries (HHI) Revenue,($bn & AGR %), Y-o-Y Revenue Growth, 2015-2017
Figure 9.1 Global LNG Carrier Market Forecast 2019-2029 ($ mn, AGR %)
Alpha Tankers
Anadarko
Anangel Maritime Services
Angelicoussis Shipping Group
Anglo Eastern Group
Australia LNG
Awilco AS
Bernhard Schulte
BG Group
BGT (Bonny Gas Transport)
Boelwerf
Bonny Gas
BP
BPRL
Brunei Gas Carriers Sdn
Brunei LNG
BW Gas ASA
BW Maritime
Cameron
Canadian FortisBC Energy
Cardiff Gas
Celsius Tankers
Chandris (Hellas) Inc.
Chantiers de France-Dunkerque
Chevron
China LNG Shipping LNG
China Ocean Shipping Group.
China Petroleum and Chemicals Corp., Ltd
China Shipbuilding Group Corporation
China Shipping Group
China Shipping LNG
China State Shipbuilding Corp (CSSC)
Chubu Electric Power
CNIM (Constructions Navales et Industrielles de la Mediteranee)
CNOOC
CNOOC Energy Technology and Services Ltd.
CNPC
Cochin Shipyard Limited (CSL)
Constructions Navales et Industrielles de la Mediteranee
Cove Energy
Cryovision
CSSC (Hong Kong) Shipping Leasing
CSSC Wärtsilä Engine (Shanghai) Co (CWEC)
Daewoo
Daewoo Shipbuilding and Marine Engineering (DSME)
Dailian Construction Investment Corp.
Dailian Port
Deen Shipping
DNV GL
Dongguan Fuel Industrial
Dynacom Corporation
Dynacom Tankers Management
Dynagas (Dynacom)
Elcano
ENH
Eni
Excelerate
Exmar NV
ExxonMobil
Fincantieri
Fiskerstrand Verft
Flex LNG
Foshan Gas
Fujian Investment Development Co.
GAIL
GasLog
Gaz Transport
GazOcean
Gazprom
Gaztransport & Technigaz (GTT)
GD (General Dynamics)
General Dynamics UK
Golar LNG
GTT
Guangdong Gas
Guangdong Yudean
Guangzhou Gas Group
Hainan Development Holding Co.
Hanjin Heavy Industries and Construction Company Ltd. (HHIC)
Hanjin Shipping Co. Ltd.
Hawaiian Electric Co.
HDW (Howaldtswerke-Deutsche Werft)
HDW Kiel
HHI
Höegh LNG
Hong Kong & China Gas
Hong Kong Electric
HSHI
Hudon
Hudong Heavy Machinery
Hudong-Zhonghua Shipbuilding (Group) Co,
Humpuss Intermoda Transportasi
Hyproc Shipping Co.
Hyundai Corporation
Hyundai Heavy Industries (HHI) Co.
Hyundai LNG
Hyundai Merchant Marine
Hyundai Mipo Dockyard Co.
Hyundai Samho Heavy Industries
HZ
I.M. Skaugen
IINO Kaiun Kaisha Ltd.
Imabari Shipbuilding
Ishikawajima-Harima Heavy Industries
IZAR
Japan Marine United (JMU)
Japan Petroleum Exploration Company (Japex)
Japex
JERA Co., Inc.
Jiangsu Guoxin
JMU
Jovo Group
Kawasaki Heavy Industries
Kawasaki Kisen Kaisha, Ltd. ("K" Line)
Kawasaki Sakaide Works
K-Line
K-Line America Inc.
Knutsen OAS Shipping
Korea Line Corporation
Kvaerner Masa
L&T Shipbuilding Ltd
La Ciotat (Chantiers Navales De La Ciotat)
Latsco Shipping
MAN Diesel and Turbo
Maran Gas Maritime Inc.
Maran Tankers
MBK
MHI
MISC
Mitsubishi Corporation
Mitsubishi Heavy Industries (MHI)
Mitsubishi Heavy Industries Group
Mitsubishi Shipbuilding
Mitsui
Mitsui Engineering and Shipbuilding
Mitsui O.S.K. Lines, Ltd.
MO
Moss
Moss Rosenberg Verft
Nakilat
National Gas Shipping Co.
Ningbo Power Development Co LTD
Nippon Yusen Kabushiki Kaisha (NYK Line)
Northrop Grumman
NYK Line
Ocean LNG
Oceanus LNG
OLT Offshore
Oman Shipping Co.
Overseas Shipholding Group Inc.
Pacific Oil and Gas
PetroChina
Petronas
Petronet
Pipavav Defence and Offshore Engineering (POED) Ltd.
Prometheus Energy
Pronav
Qatar Petroleum
Qingdao Port
Repsol
Royal Dutch Shell Plc
Samho Heavy Industries
Samsung
Samsung Heavy Industries (SHI)
Shell
Shenergy Group
Shenzhen Energy Group
Shenzhen Gas
Sinochem Corporation
Sinopacific Shipbuilding Group
Sinopec
Sirius Rederi
SK Shipping
Skangass AS
Sovcomflot
Statoil
Stena Bulk
STX Dalian
STX Finland
STX France
STX Offshore & Shipbuilding
STX Pan Ocean
STX Shipbuilding
Technigaz
Teekay Corporation
Teekay LNG Partners LP
Teekay Shipping
Thenamaris
Tokyo Century Corporation
Tokyo Electric Power Company
Total
Total Gas & Power Chartering Limited (TGPCL)
Toyota Motor Corporation
Tractebel Engineering (GDF SUEZ)
Trans Pacific Shipping 7 Limited
Tsakos Energy Navigation Ltd.
Universal Shipbuilding Corporation
Universal Shipping
Veka Deen LNG
Veka Group
Yamal Trade (ice)
Zhejiang Energy Group Co Ltd
Organisations mentioned
Department of Energy (DoE)
EIA
Environmental Protection Agency (EPA)
Federal Energy Regulatory Commission (FERC).
Government of Canada
Government of Mexico
International Maritime Organisation (IMO)
National Highway Traffic Safety Administration
The Bank for Development and Foreign Economic Affairs in Russia (Vnesheconombank)
United Nations
Download sample pages
Complete the form below to download your free sample pages for Liquefied Natural Gas (LNG) Carrier Market Report 2019-2029
Related reports
-
Floating LNG Power Vessel Market Report 2021-2031
Over the next 20 years, LNG supply is expected to more than treble, resulting in a surge in demand —...Full DetailsPublished: 16 June 2021 -

Liquefied Natural Gas (LNG) Bunkering Market Report 2021-2031
China is the fastest-growing market, with officials promising gas as a cleaner energy source in an effort to quell public...Full DetailsPublished: 22 July 2021 -

The Top 20 LNG Infrastructure Companies 2019
There are a number of exciting LNG liquefaction prospects around the world, both under construction and prospective.
...Full DetailsPublished: 11 March 2019 -

Top 20 Small-Scale Liquified Natural Gas (SSLNG) Companies 2019
Small Scale LNG is used to supply small or isolated demand centers not connected to pipeline infrastructure, small scale LNG...
Full DetailsPublished: 24 January 2019 -

LNG Yearbook 2018: The Ultimate Guide to Liquefied Natural Gas Infrastructure 2018-2028
The definitive LNG Yearbook 2018 is the ultimate reference source for the liquefied natural gas industry. The yearbook indicates that...
Full DetailsPublished: 14 June 2018 -

Small & Mid-Scaled LNGC & LNGBV Market Report 2019-2029
Visiongain’s forecasts indicate that the global the Small-Scale LNG Carrier, Medium-Scale Carrier and LNG Bunkering Vessels see capital expenditures (CAPEX)...
Full DetailsPublished: 13 May 2019 -

Small Scale Liquefied Natural Gas (LNG) Market Report 2021-2031
Special emphasis is given to ongoing research into improved efficiencies of small scale LNG. Important trends are identified and sales...Full DetailsPublished: 25 March 2021 -

Floating Liquefied Natural Gas (FLNG) Market Report 2021-2031
LNG terminals require a vast amount of capital to build: four projects approved in the previous few years, according to...Full DetailsPublished: 28 June 2021 -

Cryogenic Valve Market Report 2021-2031
The pursuit of energy efficiency and the reduction of CO2 and NOx emissions has led to a greater use of...Full DetailsPublished: 02 June 2021 -

Small Scale Liquefied Natural Gas (LNG) Market Forecast 2018-2028
Visiongain has calculated that the global Small Scale Liquefied Natural Gas (LNG) Market will see a capital expenditure (CAPEX) of...
Full DetailsPublished: 05 February 2018
Download sample pages
Complete the form below to download your free sample pages for Liquefied Natural Gas (LNG) Carrier Market Report 2019-2029
Do you have any custom requirements we can help you with?
Any specific country, geo region, market segment or specific company information?
Email us today, we can discuss your needs and see how we can help: jamie.roberts@visiongain.com
Would you like a free report overview of the report of your choice?
If so, please drop an email to Jamie Roberts stating your chosen report title to jamie.roberts@visiongain.com
Visiongain energy reports are compiled using a broad and rich mixture of both primary and secondary information to produce an overall industry outlook. In order to provide our clients with the best product possible product, we do not rely on any one single source of information. Visiongain analysts reach out to market-leading vendors and industry experts where possible but also review a wealth of financial data and product information from a vast range of sources. To find out more about our reports methodology, please email jamie.roberts@visiongain.com
Would you like to get the latest Visiongain energy reports catalogue?
What are the dynamic growth sectors? where are the regional business opportunities?
Which technologies will prevail and who are the leading companies succeeding in these sectors and why?
If you want definitive answers to business critical questions, discover Visiongain’s full range of business intelligence reports.
If so, please email Jamie Roberts on jamie.roberts@visiongain.com or call her today on +44 207 336 6100
“The Visiongain report was extremely insightful and helped us construct our basic go-to market strategy for our solution.”
H.
“F.B has used Visiongain to prepare two separate market studies on the ceramic proppants market over the last 12 months. These reports have been professionally researched and written and have assisted FBX greatly in developing its business strategy and investment plans.”
F.B
“We just received your very interesting report on the Energy Storage Technologies (EST) Market and this is a very impressive and useful document on that subject.”
I.E.N
“Visiongain does an outstanding job on putting the reports together and provides valuable insight at the right informative level for our needs. The EOR Visiongain report provided confirmation and market outlook data for EOR in MENA with the leading countries being Oman, Kuwait and eventually Saudi Arabia.”
E.S
“Visiongain produced a comprehensive, well-structured GTL Market report striking a good balance between scope and detail, global and local perspective, large and small industry segments. It is an informative forecast, useful for practitioners as a trusted and upto-date reference.”
Y.N Ltd
Association of Dutch Suppliers in the Oil & Gas Industry
Society of Naval Architects & Marine Engineers
Association of Diving Contractors
Association of Diving Contractors International
Associazione Imprese Subacquee Italiane
Australian Petroleum Production & Exploration Association
Brazilian Association of Offshore Support Companies
Brazilian Petroleum Institute
Canadian Energy Pipeline
Diving Medical Advisory Committee
European Diving Technology Committee
French Oil and Gas Industry Council
IMarEST – Institute of Marine Engineering, Science & Technology
International Association of Drilling Contractors
International Association of Geophysical Contractors
International Association of Oil & Gas Producers
International Chamber of Shipping
International Shipping Federation
International Marine Contractors Association
International Tanker Owners Pollution Federation
Leading Oil & Gas Industry Competitiveness
Maritime Energy Association
National Ocean Industries Association
Netherlands Oil and Gas Exploration and Production Association
NOF Energy
Norsk olje og gass Norwegian Oil and Gas Association
Offshore Contractors’ Association
Offshore Mechanical Handling Equipment Committee
Oil & Gas UK
Oil Companies International Marine Forum
Ontario Petroleum Institute
Organisation of the Petroleum Exporting Countries
Regional Association of Oil and Natural Gas Companies in Latin America and the Caribbean
Society for Underwater Technology
Society of Maritime Industries
Society of Petroleum Engineers
Society of Petroleum Enginners – Calgary
Step Change in Safety
Subsea UK
The East of England Energy Group
UK Petroleum Industry Association
All the events postponed due to COVID-19.
Don’t Miss Out!
Subscribe to receive the latest Industry news, trending insight and analysis straight to your inbox.Choose your preferences:
Latest Energy news
Energy as a Service (EaaS) Market
The global Energy as a Service (EaaS) market is projected to grow at a CAGR of 12.6% by 2034
25 July 2024
Synthetic Fuels Market
The global Synthetic Fuels market is projected to grow at a CAGR of 23% by 2034
18 July 2024
Power-to-X (P2X) Market
The global Power-to-X (P2X) market is projected to grow at a CAGR of 10.6% by 2034
09 July 2024
Airborne Wind Energy Market
The global Airborne Wind Energy market is projected to grow at a CAGR of 9.7% by 2034
05 June 2024
