There are a number of exciting LNG liquefaction prospects around the world, both under construction and prospective. The question is how many of these prospective projects will come to fruition, given the slowdown in East Asian, the next wave of projects in the US, Canada and East Africa will be competing to find alternative export markets. The lifting of the sanctions in Iran may also lead to the entrance of a new major player in global liquefaction, challenging Qatar.
A range of companies made up of oil majors as well independents are focusing their investments on the LNG liquefaction sector. The global demand for energy is set to grow and gas will continue to play an important role as a fuel, due to its reliability when compared to renewable and its lower carbon emissions when compared to coal.
The construction of large-scale onshore liquefaction and regasification terminals is a function of the development of the global LNG industry. Investment in such infrastructure is dictated by unique supply and demand circumstances in different geographies, such as the US unconventional oil and gas boom and the future of Japanese nuclear power generation. Our report assesses upstream asset viability, infrastructure EPC costs and demand-side outlook to anticipate the market direction.
The global market for LNG is driven by high levels of spending in established and emerging markets. An important share of future capital expenditure will be driven by the greater deployment of LNG as a fuel, and growing investment in LNG carriers.
The report will answer questions such as:
• Who are the leading companies in the LNG infrastructure industry?
– What is their strategy?
– What is their existing processing capacity and where is it based?
– What are their core strengths and weaknesses?
• What is driving and restraining the involvement of each leading company within the market?
• What political, economic, environmental and technological factors affect the LNG infrastructure market?
How will you benefit from this report?
• This report you will keep your knowledge base up to speed. Don’t get left behind
• This report will allow you to reinforce strategic decision-making based upon definitive and reliable market data
• You will learn how to exploit new technological trends
• You will be able to realise your company’s full potential within the market
• You will better understand the competitive landscape and identify potential new business opportunities and partnerships
Three reasons why you must order and read this report today:
1) The study reveals where and how leading companies are investing in the LNG Infrastructure market. We show you the prospects for companies operating in:
– North America
– Middle East
– Asia
– Europe
– South America
2) The report provides a detailed individual profile for each of the 20 leading companies in the LNG infrastructure market in 2017, providing data for Revenue and details of existing and upcoming LNG infrastructure projects:
– Gazprom
– ExxonMobil
– Royal Dutch Shell
– Rosneft
– Woodside Energy
– Novatek
– Chevron Corporation
– Inpex Corporation
– Petronas
– Cheniere Energy
– Sempra Energy
– Steelhead LNG
– Engie
– Freeport LNG
– Dominion Energy Inc.
– Anadarko Petroleum Corporation
– Veresen Inc
– Snam SpA
– Royal Vopak
– NextDecade
3) It also provides a PEST analysis of the key factors affecting the overall LNG Infrastructure market:
– Political
– Economic
– Social
– Technical
Competitive advantage
This independent, 118-page report guarantees you will remain better informed than your competitors. With 114 tables and figures examining the companies within the LNG infrastructure market space, the report gives you an immediate, one-stop breakdown of the leading LNG infrastructure companies plus analysis and future outlooks, keeping your knowledge one step ahead of your rivals.
Who should read this report?
• Anyone within the geothermal value chain
• CEOs
• COOs
• CIOs
• Business development managers
• Marketing managers
• Technologists
• Suppliers
• Investors
• Banks
• Government agencies
• Contractors
Don’t miss out
This report is essential reading for you or anyone in the oil or other industries with an interest in LNG. Purchasing this report today will help you to recognise those important market opportunities and understand the possibilities there. Order our The Top 20 Liquid Natural Gas Infrastructure Companies 2019 report.
Visiongain is a trading partner with the US Federal Government
CCR Ref number: KD4R6
1. Report Overview
1.1 Global LNG Infrastructure Market Overview
1.2 Why You Should Read This Report
1.3 How This Report Delivers
1.4 Key Questions Answered by This Analytical Report Include:
1.5 Who is This Report For?
1.6 Methodology
1.6.1 Primary Research
1.6.2 Secondary Research
1.7 Frequently Asked Questions (FAQ)
1.8 Associated Visiongain Reports
1.9 About Visiongain
2. Introduction to the LNG Infrastructure Market
2.1 LNG Infrastructure Market Overview
2.2 Brief History of LNG
2.3 LNG Infrastructure Market Drivers & Restraints 2019
2.3.1 Drivers in LNG Infrastructure Market
2.3.1.1 Increasing Supply of LNG
2.3.1.2 Growing Global Demand for Natural Gas
2.3.1.3 Declining Arbitrage Opportunity
2.3.1.4 Rising Desire to Increase Energy Security
2.3.1.5 Environmental and Climate Dimensions
2.3.2 Restraints in the LNG Infrastructure Market
2.3.2.1 Fluctuation in Crude Oil Prices
3. Competitor Positioning in the LNG Infrastructure Market
3.1 The Leading Twenty Companies’ Market Share in the Global LNG Infrastructure Market 2019
4. The Leading Twenty Companies in the LNG infrastructure Market 2019
4.1 Anadarko Petroleum Corporation
4.1.1 Anadarko LNG Infrastructure Selected Recent Contracts / Projects / Programmes 2018
4.1.2 Anadarko Total Company Regional Sales 2017
4.1.3 Anadarko Total Company Sales 2011-2017
4.1.4 Anadarko SWOT Analysis
4.2 Cheniere Energy
4.2.1 Cheniere LNG Infrastructure Selected Recent Contracts / Projects / Programmes 2018
4.2.2 Cheniere Total Company Sales 2011-2017
4.2.3 Cheniere SWOT Analysis
4.3 Chevron Corporation
4.3.1 Chevron LNG Infrastructure Selected Recent Contracts / Projects / Programmes 2014-2018
4.3.2 Chevron Total Company Sales 2011-2017
4.3.3 Chevron SWOT Analysis
4.4 Dominion Energy, Inc.
4.4.1 Dominion Energy LNG Infrastructure Selected Recent Contracts / Projects / Programmes 2018
4.4.2 Dominion Energy Total Company Sales 2011-2017
4.4.3 Dominion Energy SWOT Analysis
4.5 ExxonMobil Corporation
4.5.1 ExxonMobil LNG Infrastructure Selected Recent Contracts / Projects / Programmes 1997-2025
4.5.2 ExxonMobil Total Company Sales 2011-2017
4.5.3 ExxonMobil SWOT Analysis
4.6 Gazprom
4.6.2 Gazprom Total Company Segment Sales 2017
4.6.3 Gazprom Total Company Sales 2011-2017
4.6.4 Gazprom SWOT Analysis
4.7 Freeport LNG
4.7.1 Freeport LNG Infrastructure Selected Recent Contracts / Projects / Programmes 2018
4.7.2 Freeport LNG SWOT Analysis
4.8 Royal Vopak N.V.
4.8.1 Vopak LNG Infrastructure Selected Recent Contracts / Projects / Programmes 2018
4.8.2 Vopak Total Company Regional Sales 2017
4.8.3 Vopak Total Company Sales 2011-2017
4.8.4 Vopak SWOT Analysis
4.9 Petronas
4.9.1 Petronas LNG Infrastructure Selected Recent Contracts / Projects / Programmes 2018
4.9.2 Petronas Total Company Regional Sales 2017
4.9.3 Petronas Total Company Sales 2011-2017
4.9.4 Petronas SWOT Analysis
4.10 Rosneft Oil Company
4.10.1 Rosneft Total Company Segment Sales 2017
4.10.2 Rosneft Total Company Sales 2011-2017
4.10.3 Rosneft SWOT Analysis
4.11 Sempra Energy
4.11.1 Sempra LNG Infrastructure Selected Recent Contracts / Projects / Programmes 2018
4.11.2 Sempra Total Company Regional Sales 2017
4.11.3 Sempra Total Company Sales 2011-2017
4.11.4 Sempra SWOT Analysis
4.12 Royal Dutch Shell plc.
4.12.2 Shell Total Company Regional Sales 2017
4.12.3 Shell Total Company Sales 2011-2017
4.12.4 Shell SWOT Analysis
4.13 Engie
4.13.1 Engie LNG Infrastructure Selected Recent Contracts / Projects / Programmes 2018
4.13.2 Engie Total Company Regional Sales 2017
4.13.3 Engie Total Company Sales 2011-2017
4.13.4 Engie SWOT Analysis
4.14 Inpex Corporation
4.14.1 Inpex LNG Infrastructure Selected Recent Contracts / Projects / Programmes 2018
4.14.2 Inpex Total Company Regional Sales 2017
4.14.3 Inpex Total Company Sales 2011-2017
4.14.4 Inpex SWOT Analysis
4.15 Woodside Energy
4.15.1 Woodside LNG Infrastructure Selected Recent Contracts / Projects / Programmes 2018
4.15.2 Woodside Total Company Regional Sales 2017
4.15.3 Woodside Total Company Sales 2011-2017
4.15.4 Woodside SWOT Analysis
4.16 Steelhead LNG
4.16.1 Steelhead Group LNG Infrastructure Selected Recent Contracts / Projects / Programmes 2018
4.16.2 Steelhead SWOT Analysis
4.17 Veresen Inc.
4.17.1 Veresen LNG Infrastructure Selected Recent Contracts / Projects / Programmes 2018
4.17.2 Veresen SWOT Analysis
4.18 Novatek
4.18.1 Novatek LNG Infrastructure Selected Recent Contracts / Projects / Programmes 2018
4.18.2 Novatek Total Company Regional Sales 2017
4.18.3 Novatek Total Company Sales 2011-2017
4.18.4 Novatek SWOT Analysis
4.19 Snam S.p.A.
4.19.1 Snam Total Company Sales 2011-2017
4.19.2 Snam SWOT Analysis
4.20 NextDecade
4.20.1 NextDecade SWOT Analysis
5. SWOT Analysis of the LNG Infrastructure Market 2019-2029
6. PEST Analysis of the LNG Infrastructure Market 2019-2029
7. Conclusion & Recommendations
8. Glossary
Associated Visiongain Reports
Visiongain Report Sales Order Form
Appendix A
About Visiongain
Appendix B
Visiongain report evaluation form
List of Tables
Table 2.1 LNG Infrastructure Market Drivers & Restraints
Table 2.2 Visiongain’s Anticipated Brent Crude Oil Price, 2018, 2019, 2020-2022, 2023-2025, 2026-2029 ($/bbl)
Table 3.1 The Leading Twenty Companies in the LNG Infrastructure Market 2019 (Rank, Company, Market Share %, Revenue $m)
Table 4.1 Anadarko Profile 2017 (CEO, Total Company Sales US$m, Share of the Relevant Business Segment Revenue that comes from LNG, LNG Revenue (US $m), Net Income / Loss US$m, Net Capital Expenditure US$m, Strongest Business Region, HQ, Founded, No. of Employees, IR Contact, Ticker, Website)
Table 4.2 Selected Recent Anadarko LNG Infrastructure Contracts / Projects / Programmes 2018 (Project, Owner, Capacity MTPA, Location, Start Year)
Table 4.3 Anadarko Total Company Sales 2010-2017 (US$m, AGR %)
Table 4.4 SWOT Analysis of Anadarko
Table 4.5 Cheniere Profile 2017 (CEO, Total Company Sales US$m, Share of the Relevant Business Segment Revenue that comes from LNG (%), LNG Revenue (US $m), Net Income / Loss US$m, Strongest Business Region, HQ, Founded, No. of Employees, IR Contact, Ticker, Website)
Table 4.6 Selected Recent Cheniere LNG Infrastructure Contracts / Projects / Programmes 2018 (Project, Owner, Capacity MTPA, Location, Start Year)
Table 4.7 Cheniere Total Company Sales 2010-2017 (US$m, AGR %)
Table 4.8 SWOT Analysis of Cheniere
Table 4.9 Chevron Profile 2017 (CEO, Total Company Sales US$m, Share of the Relevant Business Segment Revenue that comes from LNG (%), Natural Gas Revenue (US $m), Net Income / Loss US$m, Strongest Business Region, HQ, Founded, No. of Employees, IR Contact, Ticker, Website)
Table 4.10 Selected Recent Chevron LNG Infrastructure Contracts / Projects / Programmes 2018 (Project, Owner, Capacity MTPA, Location, Start Year)
Table 4.11 Chevron Total Company Sales 2010-2017 (US$m, AGR %)
Table 4.12 SWOT Analysis of Chevron
Table 4.13 Dominion Energy Profile 2017 (CEO, Total Company Sales US$m, Share of the Relevant Business Segment Revenue that comes from LNG (%), Natural Gas Revenue (US $m), Strongest Business Region, HQ, Founded, No. of Employees, IR Contact, Ticker, Website)
Table 4.14 Selected Recent Dominion Energy LNG Infrastructure Contracts / Projects / Programmes 2018 (Project, Owner, Capacity MTPA, Location, Start Year)
Table 4.15 Dominion Energy Total Company Sales 2010-2017 (US$m, AGR %)
Table 4.16 SWOT Analysis of Dominion Energy
Table 4.17 ExxonMobil Profile 2017 (CEO, Total Company Sales US$m, Share of the Relevant Business Segment Revenue that comes from LNG (%), LNG Revenue (US $m), Net Income / Loss US$m, Strongest Business Region, HQ, Founded, No. of Employees, IR Contact, Ticker, Website)
Table 4.18 Selected Recent ExxonMobil LNG Infrastructure Contracts / Projects / Programmes 2018 (Project, Owner, Capacity MTPA, Location, Start Year)
Table 4.19 ExxonMobil Total Company Sales 2010-2017 (US$m, AGR %)
Table 4.20 SWOT Analysis of ExxonMobil
Table 4.21 Gazprom Profile 2017 (CEO, Total Company Sales US$m, Share of the Relevant Business Segment Revenue that comes from LNG (%), LNG Revenue (US $m), Net Capital Expenditure US$m, Strongest Business Region, HQ, Founded, No. of Employees, IR Contact, Ticker, Website)
Table 4.22 Gazprom Total Company Sales 2010-2017 (US$b, AGR %)
Table 4.23 SWOT Analysis of Gazprom
Table 4.24 Freeport LNG Profile 2017 (CEO, Strongest Business Region, HQ, Liquefied Natural Gas Revenue (US$m), Founded, IR Contact, Website)
Table 4.25 Selected Recent Freeport LNG Infrastructure Contracts / Projects / Programmes 2018 (Project, Owner, Capacity (MTPA), Location, Start Year)
Table 4.26 SWOT Analysis of Freeport LNG
Table 4.27 Vopak Profile 2017 (CEO, Total Company Sales US$m, Share of the Relevant Business Segment Revenue that comes from LNG (%), LNG Revenue (US $m), Net Income / Loss US$m, Net Capital Expenditure US$m, Strongest Business Region, HQ, Founded, No. of Employees, IR Contact, Ticker, Website)
Table 4.28 Selected Recent Vopak LNG Infrastructure Contracts / Projects / Programmes 2018 (Project, Owner, Capacity MTPA, Location, Start Year)
Table 4.29 Vopak Total Company Sales 2010-2017 (US$m, AGR %)
Table 4.30 SWOT Analysis of Vopak
Table 4.31 Petronas Profile 2017 (CEO, Total Company Sales US$m, Share of the Relevant Business Segment Revenue that comes from LNG (%), LNG Revenue (US $m), Net Income / Loss US$m, Net Capital Expenditure US$m, Strongest Business Region, HQ, Founded, No. of Employees, IR Contact, Website)
Table 4.32 Selected Recent Petronas LNG Infrastructure Contracts / Projects / Programmes 2018 (Project, Owner, Capacity MTPA, Location, Start Year)
Table 4.33 Petronas Total Company Sales 2010-2017 (US$b, AGR %)
Table 4.34 SWOT Analysis of Petronas
Table 4.35 Rosneft Profile 2017 (CEO, Total Company Sales US$m, Share of the Relevant Business Segment Revenue that comes from LNG (%), LNG Revenue (US $m), Net Income / Loss US$m, Net Capital Expenditure US$m, Strongest Business Region, HQ, Founded, No. of Employees, IR Contact, Ticker, Website)
Table 4.36 Rosneft Total Company Sales 2010-2017 (US$b, AGR %)
Table 4.37 SWOT Analysis of Rosneft
Table 4.38 Sempra Profile 2017 (CEO, Total Company Sales US$m, Share of the Relevant Business Segment Revenue that comes from LNG (%), LNG Revenue (US $m), Net Income / Loss US$m, Net Capital Expenditure US$m, Strongest Business Region, HQ, Founded, No. of Employees, IR Contact, Ticker, Website)
Table 4.39 Selected Recent Sempra LNG Infrastructure Contracts / Projects / Programmes 2018 (Project, Owner, Capacity MTPA, Location, Start Year)
Table 4.40 Sempra Total Company Sales 2010-2017 (US$m, AGR %)
Table 4.41 SWOT Analysis of Sempra
Table 4.42 Shell Profile 2017 (CEO, Total Company Sales US$m, Share of the Relevant Business Segment Revenue that comes from LNG (%), LNG Revenue (US $m), Net Income / Loss US$m, Net Capital Expenditure US$m, Strongest Business Region, HQ, Founded, No. of Employees, IR Contact, Ticker, Website)
Table 4.43 Shell Total Company Sales 2010-2017 (US$m, AGR %)
Table 4.44 SWOT Analysis of Shell
Table 4.45 Engie Profile 2017 (CEO, Total Company Sales US$m, Share of the Relevant Business Segment Revenue that comes from LNG (%), LNG Revenue (US $m), Net Income / Loss US$m, Net Capital Expenditure US$m, Strongest Business Region, HQ, Founded, No. of Employees, IR Contact, Ticker, Website)
Table 4.46 Selected Recent Engie LNG Infrastructure Contracts / Projects / Programmes 2018 (Project, Owner, Capacity MTPA, Location, Start Year)
Table 4.47 Engie Total Company Sales 2010-2017 (US$m, AGR %)
Table 4.48 SWOT Analysis of Engie
Table 4.49 Inpex Profile 2017 (CEO, Total Company Sales US$m, Share of the Relevant Business Segment Revenue that comes from LNG (%), LNG Revenue (US $m), Net Income / Loss US$m, Net Capital Expenditure US$m, Strongest Business Region, HQ, Founded, No. of Employees, IR Contact, Ticker, Website)
Table 4.50 Selected Recent Inpex LNG Infrastructure Contracts / Projects / Programmes 2018 (Project, Owner, Capacity MTPA, Location, Start Year)
Table 4.51 Inpex Total Company Sales 2010-2017 (US$m, AGR %)
Table 4.52 SWOT Analysis of Inpex
Table 4.53 Woodside Profile 2017 (CEO, Total Company Sales US$m, Share of the Relevant Business Segment Revenue that comes from LNG (%), LNG Revenue (US $m), Net Capital Expenditure US$m, Strongest Business Region, HQ, Founded, No. of Employees, IR Contact, Ticker, Website)
Table 4.54 Selected Recent Woodside LNG Infrastructure Contracts / Projects / Programmes 2018 (Project, Owner, Capacity MTPA, Location, Start Year)
Table 4.55 Woodside Total Company Sales 2010-2017 (US$m, AGR %)
Table 4.56 SWOT Analysis of Woodside
Table 4.57 Steelhead LNG Profile 2017 (CEO, Strongest Business Region, HQ, LNG Revenue (US$m), Founded, No. of Employees, IR Contact, Website)
Table 4.58 Selected Recent Steelhead Group LNG Infrastructure Contracts / Projects / Programmes 2018 (Project, Owner, Capacity MTPA, Location, Start Year)
Table 4.59 SWOT Analysis of Steelhead
Table 4.60 Veresen Profile 2017 (CEO, Strongest Business Region, LNG Revenue (US$m), HQ, Founded, No. of Employees, IR Contact, Ticker, Website)
Table 4.61 Selected Recent Veresen LNG Infrastructure Contracts / Projects / Programmes 2018 (Project, Owner, Capacity MTPA, Location, Start Year)
Table 4.62 SWOT Analysis of Veresen
Table 4.63 Novatek Profile 2017 (CEO, Total Company Sales US$m, Share of the Relevant Business Segment Revenue that comes from LNG (%), LNG Revenue (US $m), Net Capital Expenditure US$m, Strongest Business Region, HQ, Founded, No. of Employees, IR Contact, Ticker, Website)
Table 4.64 Selected Recent Novatek LNG Infrastructure Contracts / Projects / Programmes 2018 (Project, Owner, Capacity MTPA, Location, Start Year)
Table 4.65 Novatek Total Company Sales 2010-2017 (US$m, AGR %)
Table 4.66 SWOT Analysis of Novatek
Table 4.67 Snam Profile 2017 (CEO, Total Company Sales US$m, Share of the Relevant Business Segment Revenue that comes from LNG (%), LNG Revenue (US $m), Net Income / Loss US$m, Strongest Business Region, HQ, Founded, No. of Employees, IR Contact, Ticker, Website)
Table 4.68 Snam Total Company Sales 2010-2017 (US$m, AGR %)
Table 4.69 SWOT Analysis of Snam
Table 4.70 NextDecade Profile 2017 (CEO, No. of Employees, Strongest Business Region, HQ, Founded, IR Contact, Ticker, Website)
Table 4.71 SWOT Analysis of NextDecade
Table 5.1 Global LNG Infrastructure Market SWOT Analysis 2019-2029
Table 6.1 PEST Analysis of the LNG Infrastructure Market 2019 – 2029
List of Figures
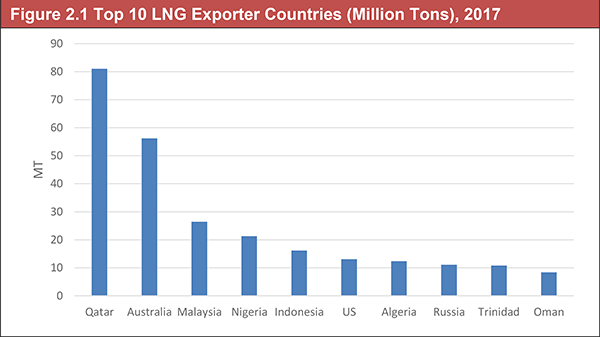
Figure 2.1 Top 10 LNG Exporter Countries (Million Tons), 2017
Figure 2.2 Top 10 LNG Exporter Countries (Market Share), 2017
Figure 2.3 Australian and Qatari LNG Production, 2010 and 2035 (mmtpa)
Figure 2.4 Natural Gas Production and Trade Growth, 2013-2035 (Billion Cubic Feet per Day (Bcf/d))
Figure 2.5 Natural Gas Production by Type and Region (1990-2035) (Billion Cubic Feet per Day (Bcf/d))
Figure 2.6 World Energy-Related Carbon Dioxide Emissions by Fuel Type, 1990-2040 (Billion Metric Tons)
Figure 2.7 Greenhouse Gases and Harmful Emissions: Coal and Natural Gas Compared (Parts per Million)
Figure 2.8 WTI and Brent Oil Prices 2006-2017 ($/bbl)
Figure 2.9 Average Monthly OPEC Crude Oil Price July 2017-July 2018 ($/bbl)
Figure 2.10 China and India Annual GDP Growth 2012-2018 (%)
Figure 2.11 US Refined Product Consumption January 2017 to Sept 2018 Four-Week Average (Mbpd)
Figure 3.1 The Leading Twenty Companies in the LNG Infrastructure Market 2019 (Market Share %)
Figure 4.1 Anadarko Total Company Regional Sales 2017 (%)
Figure 4.2 Anadarko Total Company Sales 2011-2017 (US $m, AGR %)
Figure 4.3 Cheniere Total Company Sales 2011-2017 (US $m, AGR %)
Figure 4.4 Chevron Total Company Sales 2011-2017 (US $m, AGR %)
Figure 4.5 Dominion Energy Total Company Sales 2011-2017 (US $m, AGR %)
Figure 4.6 ExxonMobil Total Company Sales 2011-2017 (US $m, AGR %)
Figure 4.7 Gazprom Total Company Segment Sales 2017 (%)
Figure 4.8 Gazprom Total Company Sales 2011-2017 (US $b, AGR %)
Figure 4.9 Vopak Total Company Regional Sales 2017 (%)
Figure 4.10 Vopak Total Company Sales 2011-2017 (US $m, AGR %)
Figure 4.11 Petronas Total Company Regional Sales 2017 (%)
Figure 4.12 Petronas Total Company Sales 2011-2017 (US $m, AGR %)
Figure 4.13 Rosneft Total Company Segment Sales 2017 (%)
Figure 4.14 Rosneft Total Company Sales 2011-2017 (US $b, AGR %)
Figure 4.15 Sempra Total Company Regional Sales 2017 (%)
Figure 4.16 Sempra Total Company Sales 2011-2017 (US $m, AGR %)
Figure 4.17 Shell Total Company Regional Sales 2017 (%)
Figure 4.18 Shell Total Company Sales 2011-2017 (US $m, AGR %)
Figure 4.19 Engie Total Company Regional Sales 2017 (%)
Figure 4.20 Engie Total Company Sales 2011-2017 (US $m, AGR %)
Figure 4.21 Inpex Total Company Regional Sales 2017 (%)
Figure 4.22 Inpex Total Company Sales 2011-2017 (US $m, AGR %)
Figure 4.23 Woodside Total Company Regional Sales 2017 (%)
Figure 4.24 Woodside Total Company Sales 2011-2017 (US $m, AGR %)
Figure 4.25 Novatek Total Company Regional Sales 2017 (%)
Figure 4.26 Novatek Total Company Sales 2011-2017 (US $m, AGR %)
Figure 4.27 Snam Total Company Sales 2011-2017 (US $m, AGR %)

