Industries > Energy > Carbon Capture & Storage (CCS) Market Report 2018-2028
Carbon Capture & Storage (CCS) Market Report 2018-2028
Capacity (MMtpa), CAPEX ($m) & OPEX ($m) Forecasts for CO2 Capture (Pre-Combustion, Post-Combustion, Oxy-Fuel Combustion), CO2 Transportation & Transmission (Pipelines, Ships / Chemical Tankers (Offshore), Chemical Carrier Vehicles (Onshore), CO2 Storage (Depleted Oil & Gas Reservoirs, Un-Minable Coal Seams, Deep Saline Aquifers, Salt Caverns, CO2 EOR, Onshore Reinjection, Subsea Reinjection)
• Do you need definitive CCS market data?
• Succinct CCS market analysis?
• Technological insight?
• Clear competitor analysis?
• Actionable business recommendations?
Read on to discover how this definitive report can transform your own research and save you time.
The Paris Climate Summit had 187 countries in attendance and certain measures were put in place to combat climate change and this has led Visiongain to publish this important report. Notwithstanding the recent decision by the US administration to withdraw from the agreement. the CCS market is nonetheless expected to grow in importance in the next few years because of CO2 EOR and also because pressure from emission targets is expected to feed through in the latter part of the decade driving growth to new heights. If you want to be part of the CCS industry, then read on to discover how you can maximise your investment potential.
Report Highlights
210 Quantitative Tables, Charts, And Graphs
Analysis Of Key Players Providing CCS Technologies
• Air Products & Chemicals Inc.
• Air Liquide
• Babcock& Wilcox
• Fluor Corporation
• General Electric
• HTC Purenergy Inc.
• Linde AG
• Mitsubishi Heavy Industries Ltd.
• Praxair Inc.
Insight Into Utility Companies Involved In The Carbon Capture & Storage Market
• E.ON SE
• Enel S.p.A
• RWE AG
• Saskatchewan Power Cooperation
• Scottish & Southern Company Plc
• Southern Company
Examination Of Energy Companies Involved in the CO2 Storage Market
• Baker Hughes
• Halliburton
• Petrofac
• Schlumberger
Profiles Of Companies Involved In CO2 Transmission By Pipeline
• Kinder Morgan
• National Grid Plc.
Market Share Analysis Of The Top 15 CCS Companies By Capacity
An Exclusive Expert Interview With A Key Industry Expert
• Saskatchewan Power Cooperation (Saskpower)
Global CCS Market Outlook And Analysis From 2018-2028 (CAPEX, OPEX & Capacity)
50 Major CCS Contracts And Projects
• 11 detailed tables of 50 large scale CCS projects
CCS Submarket Forecasts And Analysis From 2018-2028 (CAPEX, OPEX)
• CO2 Capture Submarket Forecast 2018-2028
• CO2 Transportation Submarket Forecast t 2018-2028
• CO2 Storage Submarket Forecast 2018-2028
Regional CCS Market Forecasts From 2018-2028 (CAPEX, OPEX & Capacity)
• The Americas CCS Forecast 2018-2028
• Europe CCS Forecast 2018-2028
• The Africa & Middle East CCS Forecast 2018-2028
• Asia & Oceania CCS Forecast 2018-2028
National CCS Market Forecasts From 2018-2028 (CAPEX, OPEX & Capacity)
• US CCS Forecast 2018-2028
• China CCS Forecast 2018-2028
• Canada CCS Forecast 2018-2028
• Brazil CCS Forecast 2018-2028
• Norway CCS Forecast 2018-2028
• UK CCS Forecast 2018-2028
• Rest of Europe CCS Forecast 2018-2028
• UAE CCS Forecast 2018-2028
• Australia CCS Forecast 2018-2028
• Rest of Africa & Middle East CCS Forecast 2018-2028
• Rest of Asia & Oceania CCS Forecast 2018-2028
Plus Qualitative Analysis Of CCS In The Following Countries
• Algeria
• Saudi Arabia
• Qatar
• Bahrain
• Kuwait
• South Africa
Key Questions Answered
• What does the future hold for the CCS industry?
• Where should you target your business strategy?
• Which applications should you focus upon?
• Which disruptive technologies should you invest in?
• Which companies should you form strategic alliances with?
• Which company is likely to success and why?
• What business models should you adopt?
• What industry trends should you be aware of?
Target Audience
• Leading CCS companies
• Oil & gas companies
• Enhanced oil recovery (EOR) specialists
• Suppliers
• Contractors
• Technologists
• R&D staff
• Consultants
• Market analysts
• CEO’s
• CIO’s
• COO’s
• Business development managers
• Investors
• Governments
• Agencies
• Industry organisations
• Banks
• Industry regulators
Visiongain is a trading partner with the US Federal Government
CCR Ref number: KD4R6
1. Report Overview
1.1 Global Carbon Capture & Storage Market Overview
1.2 Market Definition
1.3 Carbon Capture & Storage Market Segmentation
1.4 Methodology
1.5 How This Report Delivers
1.6 Key Questions Answered by This Analytical Report Include
1.7 Why You Should Read This Report
1.8 Frequently Asked Questions
1.9 Associated Visiongain Reports
1.10 About Visiongain
2. Introduction to the Carbon Capture & Storage Market
2.1 Carbon Capture
2.2 Carbon Transportation
2.3 Carbon Storage
2.3.1 Storage in Depleted Oil and Gas Fields
2.3.2 Storage in Deep Saline Aquifers
2.3.3 Storage in Un-minable Coal Seams
2.4 Carbon Dioxide Enhanced Oil Recovery
2.5 Sources of Carbon Dioxide
2.6 Policy Incentives for the Increased Uptake of Carbon Capture & Storage
2.7 Why Are Carbon Tax Policies & Emission Trading Schemes Necessary?
3 Global Carbon Capture & Storage Market Forecast 2018-2028
3.1 The Global Carbon Capture & Storage Market Forecast 2018-2028
3.2 Drivers & Restraints in the Global Carbon Capture & Storage Market 2018-2028
3.2.1 Ambitious Emissions Reduction Targets Set at the Paris Climate Summit Will Provide New Impetus for CCS Development
3.2.2 Government Funding and Legislation as Principal Drivers to Translate National GHG Emissions Reduction Targets Into Viable Carbon Capture & Storage Projects
3.2.3 A Range of Uses for Carbon Capture & Storage Technologies Could Support Development
3.2.4 Can CO2 Be Seen as a Commodity?
3.2.5 Technological Progression and Market Leaders Give Stimulus to the Carbon Capture & Storage Market
3.2.6 The Impact of Rival Technologies and Alternative Fuels
3.2.7 A Low Carbon Price, Absent Policy and a Global Economic Stagnation are Restricting the Market
3.2.8 Earthquakes, Leaks and Fossil Fuel Dominance: Public Opposition to Carbon Capture & Storage Technology
4. Carbon Capture & Storage Submarket Forecasts 2018-2028
4.1 CO2 Capture Submarket Forecast 2018-2028
4.2 CO2 Transmission Submarket Forecast 2018-2028
4.3 CO2 Storage Submarket Forecast 2018-2028
5. The Americas Carbon Capture and Storage Market Forecasts 2018-2028
5.1 Regional Market Forecasts 2018-2028
5.2 The US CCS Market Forecast 2018-2028
5.2.1 The US CCS Market Analysis
5.2.2 US Carbon Capture & Storage Projects
5.2.3 Numerous Carbon Capture & Storage Project Cancellations in the US
5.2.4 When and How Much? Details on the Carbon Capture & Storage Projects Under Development
5.2.5 Research and Development in the US Carbon Capture & Storage Market
5.2.6 Drivers and Restraints in the US Carbon Capture & Storage Market
5.2.6.1 Strong Investments and Emissions Legislation – Should Carbon Capture & Storage the US?
5.2.6.2 Cost of Carbon Capture & Storage Continues to Restrain Progress
5.2.6.3 Weak Taxes and Increased Concerns Over Uncertainties
5.3 The Canadian CCS Market Forecast 2018-2028
5.3.1 Canada CCS Market Analysis
5.3.2 Canadian Carbon Capture & Storage Projects
5.3.3 Drivers and Restraints in the Canadian Carbon Capture & Storage Market
5.3.3.1 Rising Emissions or Commercial Opportunity as the Main Driver of the Canadian Carbon Capture & Storage Market?
5.3.3.2 The Role of the Canadian Government
5.3.3.3 Can a Weak Carbon Value Impede Carbon Capture & Storage Growth?
5.3.3.4 Cheap Gas and Long Projects: An Imbalance of Economics
5.4 The Brazilian CCS Market Forecast 2018-2028
5.4.1 The Brazilian CCS Market Analysis
5.4.2 Brazilian Carbon Capture & Storage Projects
5.4.3 Background of CO2 EOR in Brazil and the Lula Project
5.4.4 The Drivers and Restraints in the Brazilian Carbon Capture & Storage Market
5.4.4.1 Brazilian Climate Change Legislation and Carbon Capture & Storage Regulatory Frameworks
5.4.4.2 Brazil’s Lack of Coal but Opportunity for Biomass?
5.4.4.3 CO2 EOR as a Driver of CCS in Brazil
5.5 Other American Carbon Capture & Storage Markets
5.5.1 The Mexican Carbon Capture & Storage Market
6. The European Carbon Capture and Storage Market Forecasts 2018-2028
6.1 Regional Market Forecasts 2018-2028
6.2 The UK CCS Market Forecasts 2018-2028
6.2.1 The UK CCS Market Analysis
6.2.2 UK Carbon Capture & Storage Projects
6.2.3 Drivers and Restraints in the UK Carbon Capture & Storage Market
6.2.3.1 Ambitious Emissions Reductions vs. Lack of Public Financial Support
6.2.3.2 Shared Infrastructure and Storage in the UK
6.3 The Norwegian CCS Market Forecast 2018-2028
6.3.1 Norwegian CCS Market Analysis
6.3.2 Norwegian Carbon Capture & Storage Projects
6.3.3 Drivers and Restraints in the Norwegian Carbon Capture & Storage Market
6.3.3.1 Will the Norwegian Carbon Tax be Enough to Support Carbon Capture & Storage in the Long Term?
6.3.3.2 Storage Capacity, Environmental Targets and Research Partnerships – Should Norway Be Leading the Way on Carbon Capture & Storage?
6.3.3.3 High Costs and Increasing Uncertainties
6.4 Rest of Europe CCS Market Forecast 2018-2028
6.4.1 Rest of Europe CCS Market Analysis
6.4.2 Large Numbers of Cancelled Carbon Capture & Storage Projects in the Rest of Europe
6.4.3 Drivers and Restraints in the Rest of Europe Carbon Capture & Storage Market
6.4.3.1 Europe has Ambitious Environmental Targets and Public Funds – So Why Is CCS not Picking Up?
6.4.3.2 Positive Long-Term Outlook as Fundamentals are Strong
7. The Africa & Middle East Carbon Capture and Storage Market Forecasts 2018-2028
7.1 Regional Market Forecasts 2018-2028
7.2 The UAE CCS Market Forecast 2018-2028
7.2.1 The UAE CCS Market Analysis
7.2.2 UAE Carbon Capture & Storage Projects
7.2.3 Drivers and Restraints in the UAE Carbon Capture & Storage Market
7.3 The Rest of Africa & Middle East CCS Market Forecast 2018-2028
7.3.1 The Rest of Africa CCS Market Analysis
7.3.2 The Rest of Africa & Middle East Carbon Capture & Storage Projects
7.3.3 Algerian Carbon Capture & Storage Market Analysis
7.3.4 Saudi Arabia Carbon Capture & Storage Market Analysis
7.3.5 Qatar Carbon Capture & Storage Market Analysis
7.3.6 Bahrain Carbon Capture & Storage Market Analysis
7.3.7 Kuwaiti Carbon Capture & Storage Market Analysis
7.3.8 The South African Carbon Capture & Storage Market Analysis
8. The Asia & Oceania Carbon Capture and Storage Market Forecasts 2018-2028
8.1 Regional Market Forecasts 2018-2028
8.2 The Chinese CCS Market Forecast 2018-2028
8.2.1 The Chinese CCS Market Analysis
8.2.2 China Carbon Capture & Storage Projects
8.2.3 Drivers and Restraints in the Chinese Carbon Capture & Storage Market
8.2.3.1 Does a Future of Coal Require Carbon Capture & Storage?
8.2.3.2 China’s Environmental Legislation
8.2.3.3 China’s Experience in Capture Technology
8.2.3.4 Joint Ventures and International Partnerships May Support Carbon Capture & Storage in China
8.2.3.5 The Cost of Carbon Capture & Storage is Still High
8.3 The Australian CCS Market Forecast 2018-2028
8.3.1 The Australian CCS Market Analysis
8.3.2 Australian Carbon Capture & Storage Projects
8.3.3 Drivers and Restraints in the Australian Carbon Capture & Storage Market
8.3.4 Navigating Between Ambitious GHG Emissions Reduction Targets and Unstable Environmental Legislation
8.4 The Rest of Asia & Oceania CCS Market Forecast 2018-2028
8.4.1 The Rest of Asia CCS Market Analysis
8.4.2 The Rest of Asia and Oceania Carbon Capture & Storage Projects
8.4.3 The South Korean Carbon Capture & Storage Market Analysis
8.4.4 The Indian Carbon Capture & Storage Market Analysis
8.4.5 The Vietnamese Carbon Capture & Storage Market Analysis
8.4.6 The Japanese Carbon Capture & Storage Market Analysis
8.4.7 The Malaysian Carbon Capture & Storage Market Analysis
8.4.8 The New Zealand Carbon Capture & Storage Market Analysis
9. PEST Analysis of the Carbon Capture & Storage Market
9.1 Political
9.2 Economic
9.3 Social
9.4 Technological
10. Expert Opinion
10.1 SaskPower
10.2 The Landscape of the Carbon Capture and Storage Market, Now and in 10 years and the Factors Affecting the Dynamics
10.3 Challenges and Opportunities in the CCS Market in the Next 10 Years
10.4 The Major Drivers in the CCS Market Over the Next 10 Years
10.5 The Restraining Factors in play in the Market Over the Next 10 Years
10.6 Regions with Significant Market Growth or Decline in the Next 10 Years
10.7 Technological Advancements that Could Change the Future of the CCS Market
10.8 The Effect of the Trump Administration on the CCS Market
10.9 The Value of the EOR Market to the CCS Market
10.10 Carbon Capture and Meeting Emissions Targets
10.11 The Key Challengers in Operating the Boundary Dam Power Station
10.12 The Future Developments for SaskPower
11. Leading Companies in the Carbon Capture & Storage Market
11.1 Companies Providing Carbon Capture & Storage Technologies
11.1.1 Air Products & Chemicals Inc. Overview
11.1.1.1 Air Products & Chemicals Inc. Analysis
11.1.1.2 Air Products & Chemicals Inc. Regional Emphasis / Focus
11.1.1.3 Air Products & Chemicals Inc. Future Outlook
11.1.2 Air Liquide Company Overview
11.1.2.1 Air Liquide Analysis
11.1.2.2 Air Liquide Regional Emphasis / Focus
11.1.2.3 Air Liquide Future Outlook
11.1.3 Babcock & Wilcox Company Overview
11.1.1.3 Babcock & Wilcox Analysis
11.1.3.2 Babcock & Wilcox Future Outlook
11.1.4 Fluor Corporation Overview
11.1.4.1 Fluor Corporation Analysis
11.1.4.2 Fluor Corporation Regional Emphasis / Focus
11.1.4.3 Fluor Corporation Future Outlook
11.1.5 General Electric (GE) Company Overview
11.1.5.1 General Electric (GE) Analysis
11.1.5.2 General Electric (GE) Regional Emphasis / Focus
11.1.5.3 General Electric (GE) Future Outlook
11.1.6 HTC Purenergy Inc. Company Overview
11.1.6.1 HTC Purenergy Inc. Analysis
11.1.6.2 HTC Purenergy Inc. Regional Emphasis / Focus
11.1.6.3 HTC Purenergy Inc. Future Outlook
11.1.7 Linde AG Company Overview
11.1.7.1 Linde AG Analysis
11.1.7.2 Linde AG Regional Emphasis / Focus
11.1.7.3 Linde AG Future Outlook
11.1.8 Mitsubishi Heavy Industries Ltd. Overview
11.1.8.1 Mitsubishi Heavy Industries Ltd. Analysis
11.1.8.2 Mitsubishi Heavy Industries Ltd. Future Outlook
11.1.9 Praxair Inc. Company Overview
11.1.9.1 Praxair Inc. Analysis
11.1.9.2 Praxair Inc. Regional Emphasis / Focus
11.1.9.3 Praxair Inc. Future Outlook
11.2 Utility Companies Involved in the Carbon Capture & Storage Market
11.2.1 E.ON SE Overview
11.2.1.1 E.ON SE Analysis
11.2.1.2 E.ON SE Competitors
11.2.2 Enel S.p.A. Company Overview
11.2.2.1 Enel S.p.A. Analysis
11.2.2.2 Enel S.p.A. Competitors
11.2.2.3 Enel S.p.A. Regional Emphasis / Focus
11.2.3 RWE AG Company Overview
11.2.3.1 RWE AG Analysis
11.2.3.2 RWE AG Competitors
11.2.4 Saskatchewan Power Corporation
11.2.4.1 Saskatchewan Power Corporation Analysis
11.2.4.2 Saskatchewan Power Corporation Regional Emphasis / Focus
11.2.4.3 Saskatchewan Power Corporation Competitors
11.2.5 Scottish & Southern Energy Plc. Overview
11.2.5.1 Scottish & Southern Energy Plc. Analysis
11.2.5.2 Scottish & Southern Energy Plc. Competitors
11.2.6 Southern Company Overview
11.2.6.1 Southern Company Analysis
11.2.6.2 Southern Company Future Outlook
11.3 Companies Involved in the CO2 Storage Market
11.3.1 Baker Hughes Company Overview
11.3.1.1 Baker Hughes Analysis
11.3.1.2 Baker Hughes Regional Emphasis / Focus
11.3.2 Halliburton Company Overview
11.3.2.1 Halliburton Analysis
11.3.2.2 Halliburton Regional Emphasis / Focus
11.3.2.3 Halliburton Future Outlook
11.3.3 Petrofac Company Overview
11.3.3.1 Petrofac Analysis
11.3.3.2 Petrofac Regional Focus
11.3.4 Schlumberger Company Overview
11.3.4.1 Schlumberger Analysi
11.3.4.2 Schlumberger Regional Emphasis / Focus
11.4 Companies Involved in CO2 Transmission by Pipeline
11.4.1 Kinder Morgan Company Overview
11.4.1.1 Kinder Morgan Analysis
11.4.1.2 Kinder Morgan Regional Focus
11.4.2 National Grid Plc. Company Overview
11.4.2.1 National Grid Plc. Analysis
11.4.2.2 National Grid Plc. Regional Emphasis / Focus
11.5 Top 15 Companies in the Carbon Capture & Storage Market by Capture Capacity
12. Conclusions
12.1 Key Findings
12.2 Recommendations
13. Glossary
List of Tables
Table 1.1 Sample Global Carbon Capture & Storage Market Forecast 2018-2028 ($m, AGR %)
Table 3.1 Global Carbon Capture & Storage Market Forecast 2018-2028 (CAPEX $m, OPEX $m, AGR %, CAGR %, Cumulative)
Table 3.2 Regional Carbon Capture & Storage Market Forecasts 2018-2028 ($m, AGR %, Cumulative)
Table 3.3 Regional Carbon Capture Capacity Forecast 2018-2028 (Cumulative MMtpa of CO2, AGR %)
Table 3.4 Drivers and Restraints to the Global Carbon Capture & Storage Market 2018-2028
Table 3.5 National GHG Emissions Reduction Targets for Leading National Markets
Table 4.1 Carbon Capture & Storage Submarket Forecast 2018-2028 (CAPEX $m, OPEX $m, AGR %, Cumulative)
Table 4.2 CO2 Capture Submarket Forecast 2018-2028 (CAPEX $m, OPEX $m, AGR %, CAGR %, Cumulative)
Table 4.3 Drivers & Restraints in the CO2 Capture Submarket 2018-2028
Table 4.4 CO2 Transmission Submarket Forecast 2018-2028 (CAPEX $m, OPEX $m, AGR %, CAGR %, Cumulative)
Table 4.5 Drivers & Restraints in the CO2 Transmission Submarket 2018-2028
Table 4.6 CO2 Storage Submarket Forecast 2018-2028 (CAPEX $m, OPEX $m, AGR %, CAGR %, Cumulative)
Table 4.7 Drivers and Restraints of the CO2 Storage Submarket
Table 5.1 The Americas Carbon Capture & Storage Market Forecast 2018-2028 (CAPEX $m, OPEX $m, AGR %, CAGR %, Cumulative)
Table 5.2 The Americas National Carbon Capture & Storage Market Spending Forecasts 2018-2028 ($m, AGR %, Cumulative
Table 5.3 The Americas Carbon Capture Capacity Forecast 2018-2028 (Yearly Operating MMtpa of CO2, AGR %)
Table 5.4 The US Carbon Capture & Storage Market Forecast 2018-2028 (CAPEX $m, OPEX $m, AGR %, CAGR %, Cumulative)
Table 5.5 The US Carbon Capture Capacity Forecast 2018-2028 (Yearly MMtpa of CO2, AGR %)
Table 5.6 US Carbon Capture & Storage Projects (Name, Location, Companies, Capacity MMtpa, Operation Date, Capture Type, CO2 Storage)
Table 5.7 Drivers and Restraints in the US Carbon Capture & Storage Market 2018-2028
Table 5.8 The Canadian Carbon Capture & Storage Market Forecast 2018-2028 (CAPEX $m, OPEX $m, AGR %, CAGR %, Cumulative
Table 5.9 The Canadian Carbon Capture Capacity Forecast 2018-2028 (Yearly Operating MMtpa of CO2, AGR %)
Table 5.10 Canadian Carbon Capture & Storage Projects (Name, Location, Companies, Capacity MMtpa, Operation Date, Capture Type, CO2 Storage)
Table 5.11 Driver and Restraints in the Canada Carbon Capture & Storage Market 2018-2028
Table 5.12 The Brazilian Carbon Capture & Storage Market Forecast 2018-2028 (CAPEX $m, OPEX $m, AGR %, CAGR %, Cumulative)
Table 5.13 The Brazilian Carbon Capture Capacity Forecast 2018-2028 (Yearly Operating MMtpa of CO2, AGR %)
Table 5.14 Brazilian Carbon Capture & Storage Projects (Name, Location, Companies, Capacity MMtpa, Operation Date, Capture Type, CO2 Storage)
Table 5.15 Drivers and Restraints in the Brazilian Carbon Capture & Storage Market 2018-2028
Table 6.1 The European Carbon Capture & Storage Market Forecast 2018-2028 (CAPEX $m, OPEX $m, AGR %, CAGR %, Cumulative)
Table 6.2 European National Carbon Capture & Storage Market Spending Forecasts 2018-2028 ($m, AGR %, Cumulative)
Table 6.3 European Carbon Capture Capacity Forecast 2018-2028 (Yearly Operating MMtpa of CO2, AGR %)
Table 6.4 The UK Carbon Capture & Storage Market Forecast 2018-2028 (CAPEX $m, OPEX $m, AGR %, CAGR %, Cumulative)
Table 6.5 The UK Carbon Capture Capacity Forecast 2018-2028 (Yearly Operating MMtpa of CO2, AGR %)
Table 6.6 UK Carbon Capture & Storage Projects (Name, Location, Companies, Capacity MMtpa, Operation Date, Capture Type, CO2 Storage)
Table 6.7 Drivers and Restraints in the UK Carbon Capture and Storage Market 2018-2028
Table 6.8 The Norwegian Carbon Capture & Storage Market Forecast 2018-2028 (CAPEX $m, OPEX $m, AGR %, CAGR %, Cumulative)
Table 6.9 The Norwegian Carbon Capture Capacity Forecast 2018-2028 (Yearly Operating MMtpa of CO2, AGR %)
Table 6.10 Norwegian Carbon Capture & Storage Projects (Name, Location, Companies, Capacity MMtpa, Operation Date, Capture Type, CO2 Storage)
Table 6.11 Drivers and Restraints in the Norwegian Carbon Capture & Storage Market 2018-2028
Table 6.12 The Rest of Europe Carbon Capture & Storage Market Forecast 2018-2028 (CAPEX $m, OPEX $m, AGR %, CAGR %, Cumulative)
Table 6.13 The Rest of Europe Carbon Capture Capacity Forecast 2018-2028 (Yearly Operating MMtpa of CO2, AGR %)
Table 6.14 Other Dormant Carbon & Storage Projects in the Rest of Europe (Name, Location, Companies, Capacity MMtpa, Operation Date, Capture Type, CO2 Storage)
Table 6.15 Drivers and Restraints in the Rest of Europe Carbon Capture & Storage (CCS) Market 2018-2028
Table 7.1 The Africa & Middle East Carbon Capture & Storage Market Forecast 2018-2028 (CAPEX $m, OPEX $m, AGR %, CAGR %, Cumulative)
Table 7.2 The Africa & Middle East National Carbon Capture & Storage Market Spending Forecasts 2018-2028 ($m, AGR %, Cumulative)
Table 7.3 The Africa & Middle East Carbon Capture Capacity Forecast 2018-2028 (Yearly Operating MMtpa of CO2, AGR %)
Table 7.4 The UAE Carbon Capture & Storage Market Forecast 2018-2028 (CAPEX $m, OPEX $m, AGR %, CAGR %, Cumulative)
Table 7.5 The UAE Carbon Capture Capacity Forecast 2018-2028 (Yearly Operating MMtpa of CO2, AGR %)
Table 7.6 The UAE Carbon Capture & Storage Projects (Name, Location, Companies, Capacity MMtpa, Operation Date, Capture Type, CO2 Storage)
Table 7.7 Drivers and Restraints in the UAE Carbon Capture and Storage Market 2018-2028
Table 7.8 The Rest of Africa & Middle East Carbon Capture & Storage Market Forecast 2018-2028 (CAPEX $m, OPEX $m, AGR %, CAGR %, Cumulative)
Table 7.9 The Rest of Africa & Middle East Carbon Capture Capacity Forecast 2018-2028 (Yearly Operating MMtpa of CO2, AGR %)
Table 7.10 The Rest of Africa & Middle East Carbon Capture & Storage Projects (Name, Location, Companies, Capacity MMtpa, Operation Date, Capture Type, CO2 Storage)
Table 8.1 The Asia & Oceania Carbon Capture & Storage Market Forecast 2018-2028 (CAPEX $m, OPEX $m, AGR %, CAGR %, Cumulative)
Table 8.2 Asia & Oceania National Carbon Capture & Storage Market Spending Forecasts 2018-2028 ($m, AGR %, Cumulative)
Table 8.3 The Asia & Oceania Carbon Capture Capacity Forecast 2018-2018 (Yearly Operating MMtpa of CO2, AGR %)
Table 8.4 The Chinese Carbon Capture & Storage Market Forecast 2018-2028 (CAPEX $m, OPEX $m, AGR %, CAGR %, Cumulative)
Table 8.5 The Chinese Carbon Capture Capacity Forecast 2018-2028 (Yearly Operating MMtpa of CO2, AGR %)
Table 8.6 Chinese Carbon Capture & Storage Projects (Name, Location, Companies, Capacity MMtpa, Operation Date, Capture Type, CO2 Storage)
Table 8.7 Drivers and Restraints in the Chinese Carbon Capture and Storage Market 2018-2028
Table 8.8 The Australian Carbon Capture & Storage Market Forecast 2018-2028 (CAPEX $m, OPEX $m, AGR %, CAGR %, Cumulative)
Table 8.9 The Australian Carbon Capture Capacity Forecast 2018-2028 (Yearly Operating MMtpa of CO2, AGR %)
Table 8.10 Australian Carbon Capture & Storage Projects (Name, Location, Companies, Capacity MMtpa, Operation Date, Capture Type, CO2 Storage)
Table 8.11 Drivers and Restraints in the Australian Carbon Capture & Storage Market 2018-2028
Table 8.12 The Rest of Asia & Oceania Carbon Capture & Storage Market Forecast 2018-2028 (CAPEX $m, OPEX $m, AGR %, CAGR %, Cumulative)
Table 8.13 The Rest of Asia & Oceania Carbon Capture Capacity Forecast 2018-2028 (Yearly Operating MMtpa of CO2, AGR %)
Table 8.14 The Rest of Asia & Oceania Carbon Capture & Storage Projects (Name, Location, Companies, Capacity MMtpa, Operation Date, Capture Type, CO2 Storage)
Table 11.1 Air Products & Chemicals Inc. Overview 2016 ($bn Revenue, Number of Employees, HQ, Ticker, Website)
Table 11.2 Air Products & Chemicals Inc. Carbon Capture Projects (Companies, Country, $m Value, Details)
Table 11.3 Air Products & Chemicals Inc. Company Divisions (% of Revenues)
Table 11.4 Air Liquide Overview 2016 ($bn Revenue, Number of Employees, HQ, Ticker, Website)
Table 11.5 Air Liquide Carbon Capture & Storage Projects
Table 11.6 Air Liquide Company Divisions (% of Revenues, Products & Services)
Table 11.7 Babcock & Wilcox Overview 2016 ($bn Revenue, Number of Employees, HQ, Ticker, Website)
Table 11.8 Babcock & Wilcox Carbon Capture & Storage Projects (Companies, Country, Value, Details)
Table 11.9 Babcock & Wilcox Company Division (Products &
Table 11.10 Fluor Corporation Overview 2016 ($bn Revenue, Number of Employees, HQ, Ticker, Website)
Table 11.11 Fluor Corporation Carbon Capture & Storage Projects (Companies, Country, Details)
Table 11.12 Fluor Corporation Regional Focus by New Orders & Backlog of Work (2016)
Table 11.13 General Electric (GE) Company Overview 2016 ($bn Revenue, Number of Employees, HQ, Ticker, Website)
Table 11.14 General Electric (GE) Carbon Capture & Storage Projects (Companies, Country, $m Value, Details)
Table 11.15 General Electric (GE) Company Division ($bn Revenues, % of Margins)
Table 11.16 HTC Purenergy Inc. Company Overview 2016 ($bn Revenue, HQ, Ticker, Website)
Table 11.17 HTC Purenergy Inc. Carbon Capture & Storage Projects (Companies, Country, $bn Value, Details)
Table 11.18 Linde AG Overview 2016 ($bn Revenue, Number of Employees, HQ, Ticker, Website)
Table 11.19 Linde AG Carbon Capture & Storage Projects (Companies, Country, Details, Model/Type)
Table 11.20 Linde AG Company Divisions (% of Total Revenue, Operating Margins, Products & Services)
Table 11.21 Mitsubishi Heavy Industries Ltd. Overview ($bn Revenue, Number of Employees, HQ, Ticker, Website)
Table 11.22 Mitsubishi Heavy Industries Ltd. Carbon Capture & Storage Projects (Companies, Country, $m Value, Details)
Table 11.23 Mitsubishi Heavy Industries (MHI) Company Divisions ($bn Sales, % of Total Sales)
Table 11.24 Praxair Inc. Overview 2016 ($bn Revenue, Number of Employees, HQ, Ticker, Website)
Table 11.25 Praxair Inc. Carbon Capture & Storage Projects
Table 11.26 Praxair Inc. Company Divisions by End Market Sales 2016 (Percentage of Sales)
Table 11.27 E.ON SE Overview 2016 ($bn Revenue, Number of Employees, HQ, Ticker, Website)
Table 11.28 E.ON SE Carbon Capture & Storage Projects
Table 11.29 Enel S.p.A. Overview 2016 ($bn Revenue, Number of Employees, HQ, Ticker, Website)
Table 11.30 Enel S.p.A. Carbon Capture & Storage Projects (Companies, Country, Details, Model/Type)
Table 11.31 RWE AG Overview 2016 ($bn Revenue, Number of Employees, HQ, Ticker, Website)
Table 11.32 RWE AG Carbon Capture & Storage Projects
Table 11.33 Saskatchewan Power Corporation Overview 2016 ($bn Revenue, Number of Employees, HQ, Ticker, Website)
Table 11.34 Saskatchewan Power Corporation Carbon Capture & Storage Projects (Companies, Country, $m Value, Details)
Table 11.35 Saskatchewan Power Corporation Available Generating Capacity by Fuel Type 2016 (%, MW)
Table 11.36 Scottish & Southern Energy Plc. Overview 2016 ($bn Revenue, Number of Employees, HQ, Ticker, Website)
Table 11.37 Scottish & Southern Energy Plc. Carbon Capture & Storage Projects (Companies, Country, Details)
Table 11.38 Scottish & Southern Energy Sources of Power Capacity Breakdown 2016 (% of Total, MW)
Table 11.39 Southern Company Overview 2016 ($bn Revenue, Number of Employees, HQ, Ticker, Website)
Table 11.40 Southern Company Carbon Capture Projects
Table 11.44 Baker Hughes Overview 2016 ($bn Revenue, Number of Employees, HQ, Ticker, Website)
Table 11.45 Halliburton Overview 2016 ($bn Revenue, Number of Employees, HQ, Ticker, Website)
Table 11.46 Petrofac Overview 2016 ($bn Revenue, Number of Employees, HQ, Ticker, Website)
Table 11.47 Petrofac Carbon Capture & Storage Projects
Table 11.48 Schlumberger Overview 2016 ($bn Revenue, Number of Employees, HQ, Ticker, Website)
Table 11.49 Schlumberger Carbon Capture & Storage Projects (Companies, Country, Details)
Table 11.50 Schlumberger Company Divisions (% of Fourth Quarter 2016 Revenues, Products & Services)
Table 11.51 Kinder Morgan Overview 2016 ($bn Revenue, Number of Employees, HQ, Ticker, Website)
Table 11.53 National Grid Plc. Overview 2016 ($bn Revenue, Number of Employees, HQ, Ticker, Website)
Table 11.54 National Grid Plc. CO2 Transmission Projects (Companies, Country, Details)
Table 11.55 National Grid Plc. Company Divisions (% of Operating Profits)
Table 11.56 Leading 15 Companies in the Carbon Capture & Storage Market by Carbon Capture Capacity 2018-2028 (Market Ranking, Capture Capacity of New Projects, Market Share %)
Table 12.1 Global Carbon Capture & Storage Market Forecast 2018-2028 (CAPEX $m, OPEX $m, AGR %, CAGR %, Cumulative)
Table 12.2 Regional Carbon Capture & Storage Market Forecasts 2018-2028 (CAPEX $m, OPEX $m, AGR %, Cumulative)
Table 12.3 Carbon Capture & Storage Submarket Forecasts 2018-2028 ($m, AGR %, Cumulative)
List of Figures
Figure 1.1 Global Carbon & Capture Market Structure Overview
Figure 2.1 Global Carbon Capture & Storage Market Segmentation Overview
Figure 2.2 Global Carbon Capture & Storage Market Structure Overview
Figure 2.3 CO2 Source, Capture, Transport, Injection and Storage Technologies
Figure 2.4 CO2 Emissions by Region in 2016 (Million Tonnes)
Figure 2.5 Global Coal Production and Consumption in 2016 (Million Tons of Oil Equivalent)
Figure 3.1 Global Carbon Capture & Storage Market Forecast 2018-2028 (CAPEX $m, OPEX $m, AGR %)
Figure 3.2 Regional Carbon Capture & Storage Market Forecasts 2018-2028 ($m)
Figure 3.3 Regional Carbon Capture & Storage Markets Share Forecast 2018 (%)
Figure 3.4 Regional Carbon Capture & Storage Markets Share Forecast 2023 (%)
Figure 3.5 Regional Carbon Capture & Storage Markets Share Forecast 2028 (%)
Figure 3.6 Regional Carbon Capture & Storage Spending Forecasts 2018-2028 ($m)
Figure 3.7 Cumulative Regional Carbon Capture & Storage Spending Forecast 2018-2028 ($m)
Figure 3.8 Regional Carbon Capture & Storage Markets Share Change 2018-2028 (%)
Figure 3.9 CAGR % (x) vs. Barriers to Entry (y) vs. National Market Size (z) 2018-2028 ($m, CAGR %)
Figure 3.10 Regional Carbon Capture Capacity Forecast 2018-2028 (Cumulative MMtpa of CO2)
Figure 4.1 Carbon Capture & Storage Submarket Forecasts 2018-2028 (CAPEX $m, OPEX $m)
Figure 4.2 Carbon Capture & Storage Submarkets Share Forecast 2018 (%)
Figure 4.3 Carbon Capture & Storage Submarkets Share Forecast 2023 (%)
Figure 4.4 Carbon Capture & Storage Submarkets Share Forecast 2028 (%)
Figure 4.5 CO2 Capture Submarket Forecast 2018-2028 (CAPEX $m, OPEX $m, AGR %)
Figure 4.6 CO2 Capture Submarket Share Forecast 2018, 2023 and 2028 (%)
Figure 4.7 CO2 Transmission Submarket Forecast 2018-2028 (CAPEX $m, OPEX $m, AGR %)
Figure 4.8 CO2 Transmission Submarket Share Forecast 2018, 2023 and 2028 (%)
Figure 4.9 CO2 Storage Submarket Forecast 2018-2028 (CAPEX $m, OPEX $m, AGR %)
Figure 4.10 CO2 Storage Submarket Share Forecast 2018, 2023 and 2028 (%)
Figure 5.1 The Americas Carbon Capture & Storage Market Forecast 2018-2028 (CAPEX $m, OPEX $m, AGR %)
Figure 5.2 The Americas Carbon Capture & Storage Market Share Forecast 2018, 2023 and 2028 (% Share)
Figure 5.3 The Americas National Carbon Capture & Storage Market Spending Forecasts 2018-2028 ($m)
Figure 5.4 The Americas Carbon Capture Capacity Forecast 2018-2028 (Yearly Operating MMtpa of CO2)
Figure 5.5 The US Carbon Capture & Storage Market Forecast 2018-2028 (CAPEX $m, OPEX $m, AGR %)
Figure 5.6 The US Carbon Capture & Storage Market Share Forecast 2018, 2023 and 2028 (% Share)
Figure 5.7 The US Carbon Capture Capacity Forecast 2018-2028 (Yearly Operating MMtpa of CO2)
Figure 5.8 The Canadian Carbon Capture & Storage Market Forecast 2018-2028 (CAPEX $m, OPEX $m, AGR %)
Figure 5.9 The Canadian Carbon Capture & Storage Market Share Forecast 2018, 2023 and 2028 (% Share)
Figure 5.10 The Canadian Carbon Capture Capacity Forecast 2018-2028 (Yearly Operating MMtpa of CO2)
Figure 5.11 Canadian Total Oil Production (MMtpa) 1990-2016
Figure 5.12 The Brazilian Carbon Capture & Storage Market Forecast 2018-2028 (CAPEX $m, OPEX $m, AGR %)
Figure 5.13 The Brazilian Carbon Capture & Storage Market Share Forecast 2018, 2023 and 2028 (% Share)
Figure 5.14 The Brazilian Carbon Capture Capacity Forecast 2018-2028 (Yearly Operating MMtpa of CO2)
Figure 6.1 The European Carbon Capture & Storage Market Forecast 2018-2028 (CAPEX $m, OPEX $m, AGR %)
Figure 6.2 European Carbon Capture & Storage Market Share Forecast 2018, 2023 and 2028 (% Share)
Figure 6.3 European National Carbon Capture & Storage Market Spending Forecasts 2018-2028 ($m)
Figure 6.4 European Carbon Capture Capacity Forecast 2018-2028 (Yearly Operating MMtpa of CO2)
Figure 6.5 The UK Carbon Capture & Storage Market Forecast 2018-2028 (CAPEX $m, OPEX $m, AGR %)
Figure 6.6 The UK Carbon Capture & Storage Market Share Forecast 2018, 2023 and 2028 (% Share)
Figure 6.7 The UK Carbon Capture Capacity Forecast 2018-2028 (Yearly Operating MMtpa of CO2)
Figure 6.8 The Norwegian Carbon Capture & Storage Market Forecast 2018-2028 (CAPEX $m, OPEX $m, AGR %)
Figure 6.9 The Norwegian Carbon Capture & Storage Market Share Forecast 2018, 2023 and 2028 (% Share)
Figure 6.10 The Norwegian Carbon Capture Capacity Forecast 2018-2028 (Yearly Operating MMtpa of CO2)
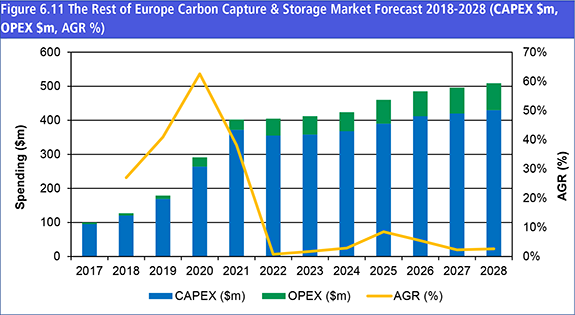
Figure 6.11 The Rest of Europe Carbon Capture & Storage Market Forecast 2018-2028 (CAPEX $m, OPEX $m, AGR %)
Figure 6.12 The Rest of Europe Carbon Capture & Storage Market Share Forecast 2018, 2023 and 2028 (% Share)
Figure 6.13 The Rest of Europe Carbon Capture Capacity Forecast 2018-2028 (Yearly Operating MMtpa of CO2)
Figure 7.1 The Africa & Middle East Carbon Capture & Storage Market Forecast 2018-2028 (CAPEX $m, OPEX $m, AGR %)
Figure 7.2 Africa & Middle East Carbon Capture & Storage Market Share Forecast 2018, 2023 and 2028 (% Share)
Figure 7.3 The Africa & Middle East National Carbon Capture & Storage Market Spending Forecasts 2018-2028 ($m)
Figure 7.4 The Africa & Middle East Carbon Capture Capacity Forecast 2018-2028 (Yearly Operating MMtpa of CO2)
Figure 7.5 The UAE Carbon Capture & Storage Market Forecast 2018-2028 (CAPEX $m, OPEX $m, AGR %)
Figure 7.6 The UAE Carbon Capture & Storage Market Share Forecast 2018, 2023 and 2028 (% Share)
Figure 7.7 The UAE Carbon Capture Capacity Forecast 2018-2028 (Yearly Operating MMtpa of CO2)
Figure 7.8 The Rest of Africa & Middle East Carbon Capture & Storage Market Forecast 2018-2028 (CAPEX $m, OPEX $m, AGR %)
Figure 7.9 The Rest of Africa & Middle East Carbon Capture & Storage Market Share Forecast 2018, 2023 and 2028 (% Share)
Figure 7.10 The Rest of Africa & Middle East Carbon Capture Capacity Forecast 2018-2028 (Yearly Operating MMtpa of CO2)
Figure 8.1 The Asia & Oceania Carbon Capture & Storage Market Forecast 2018-2028 (CAPEX $m, OPEX $m, AGR %)
Figure 8.2 Asia & Oceania Carbon Capture & Storage Market Share Forecast 2018, 2023 and 2028 (% Share)
Figure 8.3 Asia & Oceania National Carbon Capture & Storage Market Spending Forecasts 2018-2028 ($m)
Figure 8.4 The Asia & Oceania Carbon Capture Capacity Forecast 2018-2028 (Yearly Operating MMtpa of CO2)
Figure 8.5 The Chinese Carbon Capture & Storage Market Forecast 2018-2028 (CAPEX $m, OPEX $m, AGR %)
Figure 8.6 The Chinese Carbon Capture & Storage Market Share Forecast 2018, 2023 and 2028 (% Share)
Figure 8.7 The Chinese Capture Capacity Forecast 2018-2028 (Yearly Operating MMtpa of CO2)
Figure 8.8 Carbon Capture & Storage Projects in China (Year, Cumulative Capacity, CO2 Storage) 2018-2023
Figure 8.9 Chinese Coal Consumption and Production 1990-2016 (Million Short Tonnes)
Figure 8.10 The Australian Carbon Capture & Storage Market Forecast 2018-2028 (CAPEX $m, OPEX $m, AGR %)
Figure 8.11 The Australian Carbon Capture & Storage Market Share Forecast 2018, 2023 and 2028 (% Share)
Figure 8.12 The Australian Carbon Capture Capacity Forecast 2018-2028 (Yearly Operating MMtpa of CO2)
Figure 8.13 Australian Total CO2 Emissions, Coal Consumption, Natural Gas Consumption and Oil Consumption (2005-2016)
Figure 8.14 The Rest of Asia & Oceania Carbon Capture & Storage Market Forecast 2018-2028 (CAPEX $m, OPEX $m, AGR %)
Figure 8.15 The Rest of Asia & Oceania Carbon Capture & Storage Market Share Forecast 2018, 2023 and 2028 (% Share)
Figure 8.16 Rest of Asia & Oceania Carbon Capture Capacity Forecast 2018-2028 (Yearly Operating MMtpa of CO2)
Figure 11.1 Major Companies Owning and Operating CCS Projects
Figure 11.2 Major Companies Involved in Carbon Capture Projects
Figure 11.3 Breakdown of Enel Net Electricity Generation by Resource 2016 (%)
Figure 11.4 Scottish & Southern Energy Capital Expenditure 2016 (% of Total)
Figure 11.5 Key Companies Involved in Carbon Dioxide Transportation & Storage Projects
Figure 11.6 Baker Hughes Company Revenue 2016 by Geographical Area (%)
Figure 11.7 Petrofac Revenue 2016 by country (%)
Figure 11.8 Schlumberger Revenues by Region in 2016 (%)
Figure 11.9 Leading 15 Companies in the Carbon Capture & Storage Market Share by Capturing Capacity of New Projects 2018-2028 (% share)
2Co Energy
8 Rivers Capital
Abu Dhabi National Oil Company (ADNOC)
AGL Energy Limited (AGL)
Agrium
Airgas
Air Liquide
Air Products & Chemicals Inc.
Alabama Power
Alstom
AltaGas Canada
Ameren Energy Resources Company, LLC (AER)
American Electric Power (AEP)
Anadarko Petroleum Corporation
Anglo American
Apache Corporation
Apache Corporation Canada
ArcelorMittal
Archer Daniels Midland (ADM)
Babcock & Wilcox
Babcock & Wilcox Canada
Babcock & Wilcox Power Generation Group
Baker Hughes
BASF SE
BHP Billiton
Blue Source
Bow City Power Ltd
BP
C.Gen NV
C12 Energy
Cansolv Technologies Inc.
CCSD
Cenovus Energy
Centrica Plc.
CF Fertilisers
Chaparral Energy
Chevron
Chevron Canada
Chevron Phillips
Chicago Bridge & Iron
China Datang Corporation
China Huaneng Group
China National Petroleum Company (CNPC)
China Resources Power
Chubu Electric Power
Chugai Technos
CNOOC
CO2 CRC
CO2DeepStore Limited
Coca Cola
ConocoPhillips
Consol Energy
Core Energy
CS Energy
CVR Energy Inc
Dakota Gas
Decatur
DeepStore
Denbury Onshore LLC
Denbury Resources
Dongguan Power Fuel Co. Ltd.
Dongguan Taiyangzhou Power
Doosan Power Systems
Dow Chemicals
Drax Power
Dresser Rand Company
Dresser-Rand Group
E.ON Kraftwerke
E.ON SE
EDF Energy.
Electric Power Development CO., Ltd. (J-Power)
Emirate Steel Industries
Emirates Aluminium (EMAL)
EnBW AG
Endesa
Enel Green Power
Enel S.p.A
Energen Resources Corporation
Enhance Energy
Enhanced Hydrocarbon Recovery (EHR)
Eni
Enmax
Essent (RWE Group)
Exelon Generation
Export-Import Bank of China
ExxonMobil
Fluor Corporation
FuelCell Energy Inc
Gassnova
GDF Suez
GDF Suez E&P Norge AS
General Electric (GE) Energy
General Electric (GE)
GeoGreen
Gorgon Joint Venture
GPC Quimica
GreenGen
GreenGen Tianjin IGCC Co. Ltd
Haliburton
Hess Corporation
Hess Norge
Hilcorp Energy Company
Hitachi Ltd.
HTC CO2 Systems
HTC Purenergy Inc.
Hydrogen Power Abu Dhabi (HPAD)
IESA
IHI Corporation
Inventys Thermal Technologies
Japan CCS (JCCS)
Japan Oil, Gas and Metals National Corporation (JOGMEC)
Japan Vietnam Petroleum Co., Ltd (JVPC)
JCOA
J-POWER
JX Nippon Oil & Gas Exploration Corp.
KBR
Kinder Morgan
Kinder Morgan CO2 Company, L.P.
Koch Fertilizers
Koch Nitrogen Company
Korea Electric Power Corporation (KEPCO)
Kraftwerke GmbH
Kuwait Petroleum Corporation
Leucadia Energy LLC
Linde AG
Lotte Chemical UK
Lurgi GmbH
Luscar
Maersk Tankers
Maicor Wind
Marathon Oil
Masdar
Merit Energy Company
Messer ASCO
Mississippi Power
Mitsubishi Heavy Industries Ltd. (MHI)
Mott MacDonald
National Grid Plc
National Thermal Power Corporation (NTPC)
Neill and Gunter Ltd
NET Power
Norsk Hydro
NRG Energy
Occidental Petroleum
Osaka Gas
Osaki CoolGen Corporation
PCOR
Peabody Energy
Pemex
Petoro AS
Petrobras
Petrofac
Petronas
Petrovietnam
PLT Energia.
Praxair Inc.
Progressive Energy
PricewaterhouseCoopers
Qatar Fuel Additives Company (QAFAC).
Qatar National Bank Group
Qatar Petroleum
Ramgen
Rio Tinto
Royal Dutch Shell
RWE AG
RWE npower
SABIC UK Ltd
Sandridge Energy
Sargas Power
Sargent and Lundy LLC
Saskatchewan Power Corporation (SaskPower)
Saskatoon Light & Power
Saudi Aramco
Schlumberger
Scottish & Southern Energy Plc. (SSE)
ScottishPower
SCS Energy LLC
SECARB (US DOE's Southeast Regional Carbon Sequestration Partnership)
Sembcorp Utilities UK
Shaanxi Yanchang Petroleum Group
Shanxi Coal International Energy Group
Shanxi International Energy Group
Shell
Shell Canada
Shell Cansolv
Shell United Kingdom
Shenhua Group
Siemens
Sinopec
Sinopec Engineering Group
Sitra Petrochemicals
SNC Lavalin
SNC Lavalin-Cansolv
Solid Energy
Sonatrach
Southern Company
Southern Energy
Spectra Energy Inc.
Statoil
Summit Power Group
Summit Texas Clean Energy
Tampa Electric
Taweelah Asia Power Company (TAPCO)
The BOC Group (BOC)
The Chugoku Electric Power CO., Inc.
Tohoku Hokuriku Electric Power
Tokyo Gas
Toshiba
Total E&P Norge AS
Total SA
Trinity Pipelines
Turceni Energy
ULCOS Consortium of companies
Union Engineering
Uniper
Valero Energy Corporation
Vattenfall
Whitecap Resources Inc.
Whiting Petroleum Corporation
Woodside
Xstrata
Xstrata Coal
Organisations Mentioned
Alberta CCS Fund
Australian Coal Association
Australian Department of Mines & Petroleum
Australian Department of Primary Industries
Brazil’s Energy and Carbon Storage Research Centre
BurUAE of Geological and Mining Research (BRGM)
California Energy Commission
CCS Flagship Program
Centre of Excellence in Research and Innovation in Petroleum, Mineral Resources and CARBON Storage (CEPAC)
Clean Energy Fund
Clean Fossil Fuel Energy Development Institute (CFEDI)
Construction Owners Association of Alberta (COAA)
DCC-NDRC.
Doha Carbon and Energy Forum
Electric Power Research Institute
Energy Information Administration (EIA)
Environmental Protection Agency (EPA)
French Petroleum Institute (IFP)
Global CCS Institute
Guangdong Low-Carbon Technology and Industry Research Centre (GDLRC)
Imperial College London
International Energy Agency (IEA)
International Energy Forum
Japanese Ministry of Economy, Trade and Industry (METI)
Low Emissions Technology Demonstration Fund
National Academy of Sciences
National Carbon Capture Centre
Office of Carbon Capture and Storage (UK)
Plains CO2 Reduction (PCOR) Partnership
Pontifical Catholic University of Rio Grade do Sul
Qatar Carbonates and Carbon Storage Research Centre
Qatar Science and Technology Park
Scottish Carbon Capture and Storage (SCCS)
South African Centre for Carbon Capture and Storage (SACCCS)
Stanford University
Texas BurUAE of Economic Geology
UK Carbon Capture and Storage Research Centre (UKCCSRC)
United Nations (UN)
University of Southampton
University of Texas
University of Waikato Centre for Environmental, Resources and Energy Law
US Department of Energy (DOE)
US Department of Energy’s National Energy Technology Laboratories (NETL)
US Environmental Protection Agency (EPA)
US Office of Fossil Energy
World Trade Organisation (WTO)
Download sample pages
Complete the form below to download your free sample pages for Carbon Capture & Storage (CCS) Market Report 2018-2028
Related reports
-

Oil Country Tubular Goods (OCTG) Market Forecast 2019-2029
Oil Country Tubular Goods market to generate $5.9 billion in 2019....Full DetailsPublished: 05 February 2019 -

The Microgrid Market Forecast 2019-2029
Visiongain has calculated that the Microgrid Market will see a capital expenditure (CAPEX) of $12.6bn in 2019. Read on to...Full DetailsPublished: 25 February 2019 -

Chemical Enhanced Oil Recovery (EOR) Market 2019-2029
This latest report by business intelligence provider visiongain assesses that Chemical EOR spending will reach $2.89bn in 2019. ...Full DetailsPublished: 03 June 2019 -

Ultra-Thin Solar Cells Market Report 2019-2029
The USD 3.34 billion Ultra-Thin Solar Cells Market is expected to flourish in the next few years. ...Full DetailsPublished: 22 February 2019 -

Carbon Dioxide (CO2) Enhanced Oil Recovery (EOR) Market 2019-2029
The latest report from business intelligence provider visiongain offers in depth analysis of the global carbon dioxide (CO2) enhanced oil...Full DetailsPublished: 13 December 2018 -

Land Seismic Equipment & Acquisition Market Forecast 2018-2028
Visiongain has calculated that the global Land Seismic Equipment & Acquisition Market will see a capital expenditure (CAPEX) of $2,168.2mn...
Full DetailsPublished: 26 January 2018 -

Top 20 Companies in Carbon Capture and Storage 2019
This report you will keep your knowledge base up to speed. Don’t get left behind....Full DetailsPublished: 04 April 2019 -

Marine Seismic Equipment & Acquisition Market Forecast 2018-2028
This latest report by business intelligence provider Visiongain assesses that marine seismic equipment and acquisition market will reach $5.01bn in...
Full DetailsPublished: 26 June 2018 -

Marine Seismic Equipment & Acquisition Market Forecast 2019-2029
Visiongain assesses that marine seismic equipment and acquisition market will reach $5.39bn in 2019. ...Full DetailsPublished: 21 June 2019 -

Clean Coal Technologies (CCT) Market 2019-2029
Visiongain has calculated that the clean coal market will see a total expenditure of $3.68bn in 2019, from capital expenditure...Full DetailsPublished: 18 July 2019
Download sample pages
Complete the form below to download your free sample pages for Carbon Capture & Storage (CCS) Market Report 2018-2028
Do you have any custom requirements we can help you with?
Any specific country, geo region, market segment or specific company information?
Email us today, we can discuss your needs and see how we can help: jamie.roberts@visiongain.com
Would you like a free report overview of the report of your choice?
If so, please drop an email to Jamie Roberts stating your chosen report title to jamie.roberts@visiongain.com
Visiongain energy reports are compiled using a broad and rich mixture of both primary and secondary information to produce an overall industry outlook. In order to provide our clients with the best product possible product, we do not rely on any one single source of information. Visiongain analysts reach out to market-leading vendors and industry experts where possible but also review a wealth of financial data and product information from a vast range of sources. To find out more about our reports methodology, please email jamie.roberts@visiongain.com
Would you like to get the latest Visiongain energy reports catalogue?
What are the dynamic growth sectors? where are the regional business opportunities?
Which technologies will prevail and who are the leading companies succeeding in these sectors and why?
If you want definitive answers to business critical questions, discover Visiongain’s full range of business intelligence reports.
If so, please email Jamie Roberts on jamie.roberts@visiongain.com or call her today on +44 207 336 6100
“The Visiongain report was extremely insightful and helped us construct our basic go-to market strategy for our solution.”
H.
“F.B has used Visiongain to prepare two separate market studies on the ceramic proppants market over the last 12 months. These reports have been professionally researched and written and have assisted FBX greatly in developing its business strategy and investment plans.”
F.B
“We just received your very interesting report on the Energy Storage Technologies (EST) Market and this is a very impressive and useful document on that subject.”
I.E.N
“Visiongain does an outstanding job on putting the reports together and provides valuable insight at the right informative level for our needs. The EOR Visiongain report provided confirmation and market outlook data for EOR in MENA with the leading countries being Oman, Kuwait and eventually Saudi Arabia.”
E.S
“Visiongain produced a comprehensive, well-structured GTL Market report striking a good balance between scope and detail, global and local perspective, large and small industry segments. It is an informative forecast, useful for practitioners as a trusted and upto-date reference.”
Y.N Ltd
Association of Dutch Suppliers in the Oil & Gas Industry
Society of Naval Architects & Marine Engineers
Association of Diving Contractors
Association of Diving Contractors International
Associazione Imprese Subacquee Italiane
Australian Petroleum Production & Exploration Association
Brazilian Association of Offshore Support Companies
Brazilian Petroleum Institute
Canadian Energy Pipeline
Diving Medical Advisory Committee
European Diving Technology Committee
French Oil and Gas Industry Council
IMarEST – Institute of Marine Engineering, Science & Technology
International Association of Drilling Contractors
International Association of Geophysical Contractors
International Association of Oil & Gas Producers
International Chamber of Shipping
International Shipping Federation
International Marine Contractors Association
International Tanker Owners Pollution Federation
Leading Oil & Gas Industry Competitiveness
Maritime Energy Association
National Ocean Industries Association
Netherlands Oil and Gas Exploration and Production Association
NOF Energy
Norsk olje og gass Norwegian Oil and Gas Association
Offshore Contractors’ Association
Offshore Mechanical Handling Equipment Committee
Oil & Gas UK
Oil Companies International Marine Forum
Ontario Petroleum Institute
Organisation of the Petroleum Exporting Countries
Regional Association of Oil and Natural Gas Companies in Latin America and the Caribbean
Society for Underwater Technology
Society of Maritime Industries
Society of Petroleum Engineers
Society of Petroleum Enginners – Calgary
Step Change in Safety
Subsea UK
The East of England Energy Group
UK Petroleum Industry Association
All the events postponed due to COVID-19.
Don’t Miss Out!
Subscribe to receive the latest Industry news, trending insight and analysis straight to your inbox.Choose your preferences:
Latest Energy news
Energy as a Service (EaaS) Market
The global Energy as a Service (EaaS) market is projected to grow at a CAGR of 12.6% by 2034
25 July 2024
Synthetic Fuels Market
The global Synthetic Fuels market is projected to grow at a CAGR of 23% by 2034
18 July 2024
Power-to-X (P2X) Market
The global Power-to-X (P2X) market is projected to grow at a CAGR of 10.6% by 2034
09 July 2024
Airborne Wind Energy Market
The global Airborne Wind Energy market is projected to grow at a CAGR of 9.7% by 2034
05 June 2024
