Industries > Energy > Clean Coal Technologies (CCT) Market 2019-2029
Clean Coal Technologies (CCT) Market 2019-2029
Revenue Forecasts ($m) by Technology (Supercritical (SC), Ultras Super Critical (USC), Combined Heat & Power (CHP) and Others) and Geography (US, Canada, Mexico, Germany, Poland, Russia, Czech Republic, China, Japan, India, South Korea, South Africa, Brazil and the Rest of the World); Including Analysis of Leading Clean Coal Technology Companies
Clean coal technologies (CCTs) are used in power generation worldwide. The electricity generation from coal is one of the major sources of energy in the global market. Various plants are using subcritical pulverized coal technology, but there is increased use of clean coal technology, such as supercritical and ultra supercritical technology in the global market. Increased focus of the major countries to reduce carbon emissions is expected to drive the demand of clean coal technology. The clean coal technologies include supercritical (SC), ultra supercritical (USC), combined heat and power (CHP), etc, visiongain has identified a series of market trends that will impact the coal market over the coming decade.
Visiongain has calculated that the clean coal market will see a total expenditure of $3.68bn in 2019, from capital expenditure alone.
The report will answer questions such as
• What are the prospects for clean coal markets in different regions across the world?
• Where are clean coal facilities currently located?
• How is coal use changing and what are the main drivers and restraints for this change?
• What impact does government regulation have on the growth of national coal markets?
• What are the typical capital expenditures necessary for bringing a clean coal facility online,
• Who are the different companies operating across the world in the clean coal markets?
How will you benefit from this report?
• 147 pages of analysis, including 100+ tables, figures and maps, which provide the perfect accompaniment to high-end business presentations.
• Details on CAPEX and project type spending by end use application across 14 regional and national markets
• Leading company profiles on the largest clean coal companies in the global market.
1. The report provides CAPEX forecasts for all major clean coal technologies (2019-2029) and end use
– Supercritical
– Ultra-Supercritical
– Combined Heat and Power
– Others
2. The report also offers CAPEX forecasts (2019-2029) for the leading national LFGE markets
– US
– Canada
– Mexico
– China
– India
– Japan
– South Korea
– Rest of APAC
– Germany
– Poland
– Czech Republic
– Russia
– Rest of Europe
– South Africa
– Brazil
– Rest of the World
3. Tables, maps and analysis profiling the top LFGE companies in the global LFGE market
– General Electric
– Siemens
– Shanghai Electric
– Mitsubishi Heavy Industries
– Dongfang Electric
– BHEL
– Harbin Electric
– Toshiba
– Babcock & Wilcox
– Doosan
4. The analysis is also underpinned by project tables for each region and country covered in the report
Who should read this report?
– Anyone within the global landfill gas to the energy industry
– CEOs
– COOs
– Business development managers
– Project and site managers
– Suppliers
– Investors
– Contractors
– Government agencies
– Environmental Engineers/Technicians
Don’t miss out
This report is essential reading for you or anyone in the coal and clean coal sector. Purchasing this report today will help you to recognise those important market opportunities and understand the possibilities there.
Visiongain is a trading partner with the US Federal Government
CCR Ref number: KD4R6
Do you have any custom requirements we can help you with? Any need for specific country, geo region, market segment or specific company information? Contact us today, we can discuss your needs and see how we can help: sara.peerun@visiongain.com
1.1 Global Clean Coal Technologies Market Overview
1.2 Market Structure Overview and Market Definition
1.2.1 Supercritical Clean Coal Technology
1.2.2 Ultra-Supercritical Clean Coal Technology
1.2.3 Combined Heat & Power Clean Coal Technology
1.2.4 Others Clean Coal Technology
1.3 Methodology
1.4 Why You Should Read This Report
1.5 How This Report Delivers
1.6 Key Questions Answered by This Analytical Report Include
1.7 Who is This Report For?
1.8 Frequently Asked Questions (FAQ)
1.9 Associated Visiongain Reports
1.10 About Visiongain
2. Introduction to Clean Coal Technology Market
2.1 A Brief History of the Clean Coal Technologies Market
2.2 Advantages and Disadvantages Clean Coal Technologies
2.3 Comparison of Different Clean Coal Technologies
2.4 Competition from Rival Technologies
3. Global Clean Coal Technology Market 2019-2029
3.1 Global Clean Coal Technologies Market Forecast 2019-2029
3.2 Drivers and Restraints in the Clean Coal Technologies Market
3.2.1 Drivers in the Clean Coal Technologies Market
3.2.1.1 Increasing electricity demand
3.2.1.2 Rising demand of clean energy
3.2.1.3 Abundance of raw materials
3.2.2 Restraints in the Clean Coal Technologies Market
3.2.2.1 Increasing adoption of other renewable energy technologies
3.2.2.2 Higher cost than traditional coal technologies
4. Clean Coal Technology Submarket Forecasts 2019-2029
4.1 Which Technology Will Provide the Strongest Growth?
4.1.1 The Supercritical Technology Submarket Forecast 2019-2029
4.1.1.1 Supercritical Technology Submarket Drivers and Restraints
4.1.1.2 Global Supercritical Technology Projects
4.1.2 The Ultra-Supercritical Submarket Forecast 2019-2029
4.1.2.1 Ultra-Supercritical (USC) Submarket Drivers and Restraints
4.1.2.2 Global Ultra-Supercritical Technology Projects
4.1.3 The Combined Heat and Power Submarket Forecast 2019-2029
4.1.3.1 Combined Heat and Power (CHP) Technology Submarket Drivers and Restraints
4.1.3.2 Global Combined Heat and Power (CHP) Technology Projects
4.1.4 Other Technology Submarket Forecast 2019-2029
4.1.4.1 Other Technology Submarket Drivers and Restraints
4.1.4.1 Other Technology Projects
5. The Leading National Clean Coal Technologies Market Forecasts 2019-2029
5.1 North America Clean Coal Technologies Market Forecast 2019-2029
5.1.1 The U.S. Clean Coal Technology Market Forecast 2019-2029
5.1.1.1 A Brief History of Clean Coal Technology in the USA
5.1.1.2 Where are the Clean Coal Projects in the U.S. Located?
5.1.2 Canada Clean Coal Technology Market Forecast 2019-2029
5.1.2.1 A Brief History of Clean Coal Technology in Canada
5.1.2.2 Current Canada Clean Coal Technology Projects
5.1.3 Mexico Clean Coal Technology Market Forecast 2019-2029
5.1.3.1 Overview of Mexican Clean Coal Technology Market
5.2 European Clean Coal Technologies Market Forecast 2019-2029
5.2.1 Germany Clean Coal Technology Market Forecast 2019-2029
5.2.1.1 A Brief History of Clean Coal Technology in Germany
5.2.1.2 Current and Upcoming German Clean Coal Technology Projects
5.2.2 Poland Clean Coal Technology Market Forecast 2019-2029
5.2.2.1 Overview of Poland Clean Coal Technology and Projects Details
5.2.3 Russia Clean Coal Technology Market Forecast 2019-2029
5.2.3.1 Overview of Russia Clean Coal Technology and Projects Details
5.2.4 Czech Republic Clean Coal Technology Market Forecast 2019-2029
5.2.4.1 Overview of Czech Republic Clean Coal Technology and Projects Details
5.2.5 The Rest of Europe Clean Coal Technology Market Forecast 2019-2029
5.3 Asia Pacific Clean Coal Technologies Market Forecast 2019-2029
5.3.1 China Clean Coal Technology Market Forecast 2019-2029
5.3.1.1 A Brief History of Clean Coal Technologies in China
5.3.1.2 Where are the Clean Coal Projects in China Located?
5.3.2 Japan Clean Coal Technology Market Forecast 2019-2029
5.3.2.1 A Brief History of Clean Coal Technologies in Japan
5.3.2.2 Where are the Clean Coal Projects in the Japan Located?
5.3.3 India Clean Coal Technology Market Forecast 2019-2029
5.3.3.1 A Brief History of Clean Coal Technologies in India
5.3.3.2 Where are the Clean Coal Projects in the India Located?
5.3.4 South Korea Clean Coal Technology Market Forecast 2019-2029
5.3.4.1 Where are the Clean Coal Projects in South Korea Located?
5.3.5 Rest of Asia-Pacific Clean Coal Technology Market Forecast 2019-2029
5.4 Rest of the World Clean Coal Technologies Market Forecast 2019-2029
5.4.1 South Africa Clean Coal Technology Market
5.4.2 Brazil Clean Coal Technology Market Forecast 2019-2029
5.4.3 Others Countries Clean Coal Technology Market Forecast 2019-2029
6. SWOT and PEST Analysis of the Clean Coal Technology Market
6.1 SWOT Analysis of the Clean Coal Technologies Market
6.1.1 Strengths
6.1.2 Weaknesses
6.1.3 Opportunities
6.1.4 Threats
6.2. PEST Analysis of the Clean Coal Technologies Market
6.2.1 Political
6.2.2 Economic
6.2.3 Social
6.2.4 Technological
7. Leading Companies in Clean Coal Technologies Market
7.1 General Electric
7.2 Siemens
7.3 Shanghai Electric
7.4 Mitsubishi Heavy Industries
7.5 Dongfang Electric
7.6 BHEL
7.7 Harbin Electric
7.8 Toshiba
7.9 Babcock & Wilcox
7.10 Doosan
8. Conclusions & Recommendations
8.1 Key Findings
8.2 Recommendations
9. Glossary
List of Tables
Table 2.1 Advantages and Disadvantages of Clean Coal Technology
Table 2.2 Comparison of Different Clean Coal Technologies
Table 3.1 Global Clean Coal Technologies Market Forecast 2019-2029 (Spending $m, AGR %, Cumulative)
Table 3.2 Drivers and Restraints in the Clean Coal Technologies Market
Table 4.1 Global Clean Coal Technology, CO2 Intensity Factor, and Efficiency
Table 4.2 Global Clean Coal Technology Submarkets Forecast 2019-2029 ($m, AGR %, Cumulative)
Table 4.3 Global Supercritical Technology Submarkets Forecast 2019-2029 ($m, AGR %, Cumulative)
Table 4.4 Global Supercritical Technology Project, Location, Installed Capacity
Table 4.5 Global Ultra-Supercritical Submarkets Forecast 2019-2029 ($m, AGR %, Cumulative)
Table 4.6 Global Ultra-Supercritical Technology Project, Location, Installed Capacity
Table 4.7 Global Combined Heat and Power Technology Submarkets Forecast 2019-2029 ($m, AGR %, Cumulative)
Table 4.8 Global CHP Technology Project, Location, Installed Capacity
Table 4.9 Global Other Technology Submarkets Forecast 2019-2029 ($m, AGR %, Cumulative)
Table 4.10 Global Other Technology Project, Location, Installed Capacity
Table 5.1 Leading National Clean Coal Technologies Market Forecast 2019-2029 (USmn, AGR %, Cumulative)
Table 5.2 North America Clean Coal Technologies Market Forecast by Technology 2019-2029 (Spending $m, AGR %, CAGR %, Cumulative)
Table 5.3 U.S. Clean Coal Technology Market Forecast 2019-2029 (Spending $m, AGR %, CAGR %, Cumulative)
Table 5.4 Plants Adapting Clean Coal Technology in the U.S. (Name of the Plant, Technology, Location, and Installed Capacity)
Table 5.5 Canada Clean Coal Technology Market Forecast 2019-2029 (Spending $m, AGR %, CAGR %, Cumulative)
Table 5.6 Plants Adapting Clean Coal Technology in the Canada (Name of the Plant, Submarket Name, Location, and Installed Capacity)
Table 5.7 Mexico Clean Coal Technology Market Forecast 2019-2029 (Spending $m, AGR %, CAGR %, Cumulative)
Table 5.8 European Clean Coal Technologies Market Forecast by Technology 2019-2029 (Spending $m, AGR %, CAGR %, Cumulative)
Table 5.9 Germany Clean Coal Technology Market Forecast 2019-2029 (Spending $m, AGR %, CAGR %, Cumulative)
Table 5.10 Plants Adapting Clean Coal Technology in Germany (Name of the Plant, Submarket Name, Location, and Installed Capacity)
Table 5.11 Poland Clean Coal Technology Market Forecast 2019-2029 (Spending $m, AGR %, CAGR %, Cumulative)
Table 5.12 Plants Adapting Clean Coal Technology in Poland (Name of the Plant, Submarket Name, Location, and Installed Capacity)
Table 5.13 Russia Clean Coal Technology Market Forecast 2019-2029 (Spending $m, AGR %, CAGR %, Cumulative)
Table 5.14 Czech Republic Clean Coal Technology Market Forecast 2019-2029 (Spending $m, AGR %, CAGR %, Cumulative)
Table 5.15 Rest of Europe Clean Coal Technology Market Forecast 2019-2029 (Spending $m, AGR %, CAGR %, Cumulative)
Table 5.16 Asia-Pacific Clean Coal Technologies Market Forecast by Technology 2019-2029 (Spending $m, AGR %, CAGR %, Cumulative)
Table 5.17 China Clean Coal Technology Market Forecast 2019-2029 (Spending $m, AGR %, CAGR %, Cumulative)
Table 5.18 Plants Adapting Clean Coal Technology in China Plants (Name of the Plant, Technology, Location, and Installed Capacity)
Table 5.19 Japan Clean Coal Technology Market Forecast 2019-2029 (Spending $m, AGR %, CAGR %, Cumulative)
Table 5.20 Plants Adapting Clean Coal Technology in Japan Plants (Name of the Plant, Technology, Location, and Installed Capacity)
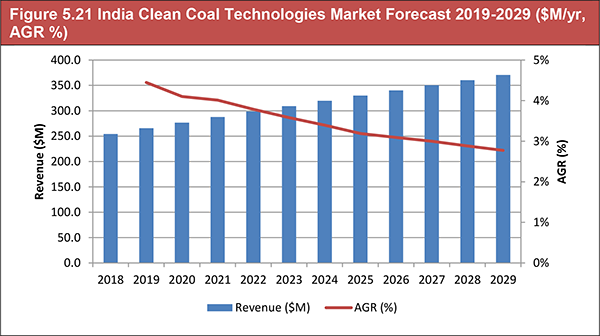
Table 5.21 India Clean Coal Technology Market Forecast 2019-2029 (Spending $m, AGR %, CAGR %, Cumulative)
Table 5.22Plants Adapting Clean Coal Technology in Indian Plants (Name of the Plant, Technology, Location, and Installed Capacity)
Table 5.23 South Korea Clean Coal Technology Market Forecast 2019-2029 (Spending $m, AGR %, CAGR %, Cumulative)
Table 5.25 Plants Adapting Clean Coal Technology in South Korean Plants (Name of the Plant, Technology, Location, and Installed Capacity)
Table 5.26 Rest of Asia-Pacific Clean Coal Technology Market Forecast 2019-2029 (Spending $m, AGR %, CAGR %, Cumulative)
Table 5.27 Rest of the World Clean Coal Technologies Market Forecast by Technology 2019-2029 (Spending $m, AGR %, CAGR %, Cumulative)
Table 5.28 South Africa Clean Coal Technology Market Forecast 2019-2029 (Spending $m, AGR %, CAGR %, Cumulative)
Table 5.29 Brazilian Clean Coal Technology Market Forecast 2019-2029 (Spending $m, AGR %, CAGR %, Cumulative)
Table 5.30 Other Countries Clean Coal Technology Market Forecast 2019-2029 (Spending $m, AGR %, CAGR %, Cumulative)
Table 6.1 Global Clean Coal Technologies Market SWOT Analysis
Table 6.2 Global Clean Coal Technologies Market PEST Analysis
Table 7.1 General Electric 2018 (CEO, Strongest Business Region, Total Revenue $m, HQ, Founded, No. of Employees, IR Contact, Ticker, Website)
Table 7.2 Recent GE Projects (Name of Projects, Country, Technology, Description)
Table 7.3 Siemens 2018 (CEO, Strongest Business Region, Total Revenue $m, HQ, Founded, No. of Employees, IR Contact, Ticker, Website)
Table 7.4 Recent Siemens Projects (Name of Projects, Country, Technology, Description)
Table 7.5 Shanghai Electric Company 2018 (EO, Strongest Business Region, Total Revenue $m, HQ, Founded, No. of Employees, IR Contact, Ticker, Website)
Table 7.6 Recent Shanghai Electric Projects (Name of Projects, Country, Technology, Capacity (MW)
Table 7.7 Mitsubishi Heavy Industries 2018 (CEO, Strongest Business Region, Total Revenue $m, HQ, Founded, No. of Employees, IR Contact, Ticker, Website)
Table 7.8 Recent MHI Projects (Name of Projects, Country, Technology, Description)
Table 7.9 Dongfang Electric 2018 (CEO, Strongest Business Region, Total Revenue $m, HQ, Founded, No. of Employees, IR Contact, Ticker, Website)
Table 7.10 Recent DEC Projects (Name of Projects, Country, Technology, Description)
Table 7.11 BHEL 2018 (CEO, Strongest Business Region, HQ, Founded, No. of Employees, IR Contact, Ticker, Website)
Table 7.12 Recent BHEL Projects (Name of Projects, Country, Technology, Description)
Table 7.13 Harbin Electric International Company Limited 2018 (CEO, Strongest Business Region, HQ, Founded, Total Revenue $m 2018, No. of Employees, IR Contact, Ticker, Website)
Table 7.14 Recent Harbin Electric Projects (Name of Projects, Country, Technology, Description)
Table 7.15 Toshiba.2017 (CEO, Strongest Business Region, HQ, Founded, No. of Employees, IR Contact, Ticker, Website)
Table 7.16 Recent Toshiba Projects (Name of Projects, Country, Technology, Description)
Table 7.17 Babcock & Wilcox 2018 (CEO, Strongest Business Region, HQ, Founded, Total Company Revenue $m 2018, Business Segments, No. of Employees, IR Contact, Ticker, Website)
Table 7.18 Recent B & W Projects (Name of Projects, Country, Technology, Description)
Table 7.19 Doosan 2017 (CEO, Strongest Business Region, HQ, Oil & Gas Production Revenues $m 2017, Founded, No. of Employees, IR Contact, Ticker, Website)
Table 7.20 Recent Doosan Projects (Name of Projects, Country, Technology, Description)
Table 8.1 Global Clean Coal Technologies Market Forecast 2019-2029 (Spending $m, AGR %, Cumulative)
Table 8.2 Leading National Clean Coal Technologies Market Forecast 2019-2029 (Spending $mn, AGR %, Cumulative)
List of Figures
Figure 1.1 Global Clean Coal Technologies Market Segmentation Overview
Figure 3.1 Global Clean Coal Technologies Market Forecast 2019-2029 ($mn/yr, AGR %)
Figure 4.1 Clean Coal Technology Market Share Forecast 2019 (%)
Figure 4.2 Clean Coal Technology Market Share Forecast 2024 (%)
Figure 4.3 Clean Coal Technology Market Share Forecast 2029 (%)
Figure 4.4 Clean Coal Technology Submarkets Forecast 2019-2029 ($m)
Figure 4.5 Clean Coal Technology Submarkets Cumulative Spending Forecast 2019-2029 ($m)
Figure 4.6 Supercritical Technology Submarkets Forecast 2019-2029 ($m)
Figure 4.7 Ultra-supercritical Submarkets Markets Forecast 2019-2029 ($m)
Figure 4.8 Combined Heat and Power Markets Forecast 2019-2029 ($m)
Figure 4.9 Other Technology Markets Forecast 2019-2029 ($m)
Figure 5.1 Global Clean Coal Technologies Market Forecast 2019-2029 ($m, AGR %)
Figure 5.2 Leading National Clean Coal Technologies and Market Share Forecast 2019 (%)
Figure 5.3 Leading National Clean Coal Technologies and Market Share Forecast 2024 (%)
Figure 5.4 Leading National Clean Coal Technologies and Market Share Forecast 2029 (%)
Figure 5.5 North America Clean Coal Technologies Market Forecast 2019-2029 ($m/yr)
Figure 5.6 North America Clean Coal Technologies Market Share by Technology Forecast, 2019, 2024 and 2029 (% Share)
Figure 5.7 The U.S. Clean Coal Technologies Market Forecast 2019-2029 ($m/yr, AGR %)
Figure 5.8 Canada Clean Coal Technology Market Forecast 2019-2029 ($M, AGR %)
Figure 5.9 Mexico Clean Coal technology Market Forecast 2019-2029 ($mnl/yr, AGR %)
Figure 5.10 European Clean Coal Technologies Market Forecast 2019-2029 ($m/yr)
Figure 5.11 European Clean Coal Technologies Market Share by Technology Forecast, 2019, 2024 and 2029 (% Share)
Figure 5.12 Germany Clean Coal Technologies Market Forecast 2019-2029 ($m/yr, AGR %)
Figure 5.13 Poland Clean Coal Technology Market Forecast 2019-2029 (Mn/yr, AGR %)
Figure 5.15 Czech Republic Clean Coal Technology Market Forecast 2019-2029 (Mn/yr, AGR %)
Figure 5.16 Rest of Europe Clean Coal Technology Market Forecast 2019-2029 (Mn/yr, AGR %)
Figure 5.17 Asia Pacific Clean Coal Technologies Market Forecast 2019-2029 ($m/yr)
Figure 5.18 Asia-Pacific Clean Coal Technologies Market Share by Technology Forecast, 2019, 2024 and 2029 (% Share)
Figure 5.19 China Clean Coal Technologies Market Forecast 2019-2029 ($m/yr, AGR %)
Figure 5.20 Japan Clean Coal Technologies Market Forecast 2019-2029 ($M/yr, AGR %)
Figure 5.21 India Clean Coal Technologies Market Forecast 2019-2029 ($M/yr, AGR %)
Figure 5.21 South Korea Clean Coal Technologies Market Forecast 2019-2029 ($M/yr, AGR %)
Figure 5.22 Rest of Asia–Pacific Clean Coal Technologies Market Forecast 2019-2029 ($M/yr, AGR %)
Figure 5.23 Rest of the World Clean Coal Technologies Market Forecast 2019-2029 ($m/yr)
Figure 5.24 Rest of the World Clean Coal Technologies Market Share by Technology Forecast, 2019, 2024 and 2029 (% Share)
Figure 5.24 South Africa Clean Coal Technologies Market Forecast 2019-2029 ($m/yr, AGR %)
Figure 5.25 Brazil Clean Coal Technologies Market Forecast 2019-2029 ($M/yr, AGR %)
Figure 5.26 Other Countries Clean Coal Technologies Market Forecast 2019-2029 ($M/yr, AGR %)
Alstom Power
American Electric Power
Amu Power
Athena Chhattisgarh Power Private Limited (ACPPL)
Babcock & Wilcox Enterprises, Inc. (B&W)
Bharat Heavy Electricals Limited (BHEL)
CFE
China Huadian Corporation
Clean Energy Finance Corporation
Coal Power Generation Company Bangladesh Limited
DEC Ltd.
Dongfang Boiler Group Co., Ltd. (DBC)
Dongfang Electric
Dongfang Electric (Guangzhou) Heavy Duty Machinery Co., Ltd.
Dongfang Electric Machinery Co., Ltd. (DFEM)
Dongfang Turbine Co., Ltd. (DTC)
Doosan
Doosan Heavy Industries & Construction
Doosan Heavy Industries (DHI)
ElektrowniaOstroleka
Enea Group
EPCOR
General Electric
GMR Chhattisgarh Energy
Harbin Electric Company Limited
Hassyan Energy
Hyundai Engineering & Construction Co., Ltd.
IHI Corporation
Jamshoro Power Company Limited
Kansai Electric Power Co., Inc.
LancoInfratech Limited
Mitsubishi Corporation (MC)
Mitsubishi Heavy Industries, Ltd. (MHI)
Mitsubishi Hitachi Power Systems, Ltd. (MHPS)
Nippon Ekitan Corporation
NTPC Limited
Potomac Electric Power Company (PEPCO)
PT Indo Raya Tenaga (IRT)
PT. Cirebon EnergiPrasarana (CEPR)
Raichur Power Corporation Limited (RPCL)
SEPCOII
Shanghai Electric Power Co. Ltd.
Siemens
Siemens Gamesa Renewable Energy (SGRE).
Siemens Healthineers
South-Western Electric Power Company
State Power Investment Corporation (SPIC)
Sumitomo Corporation
Summit Texas Clean Energy LLC
Tokyo Electric Power Company, Incorporated (TEPCO)
Toshiba Corporation
Uttar Pradesh Rajya Vidyut Utpadan Nigam Ltd.
Xinjiang Nongliushi Coal & Electricity Company Limited
ZeroGen Pty. Ltd
Organisations mentioned
BNEF
Canadian Electricity Association (CEA)
Canadian Government
Central Electricity Authority
Central Mining Institute (GIG)
Chinese Government
Clean Coal Technology Centre (CCTW)
DEWI-OCC
EIA
European Commission
IEA Clean Coal Center
Indian Government
Indira Gandhi Centre for Atomic Research (IGCAR)
Institute of Chemical Processing of Coal (IChPW)
International Energy Agency (IEA)
Ministry of Energy
OECD
Ontario Power Authority (OPA)
US Environmental Protection Agency (EPA)
US Government
WCA
Download sample pages
Complete the form below to download your free sample pages for Clean Coal Technologies (CCT) Market 2019-2029
Related reports
-
Coal Tar Market Report 2020-2030
Supply gap due to production halt brought about by COVID-19 pandemic is expected restrict sales growth. However, the rising demand...
Full DetailsPublished: 01 January 1970 -

Steam Coal Market Report 2020-2030
Forecasts by Calorific Value (>5,500 kcal/kg, 5,500 kcal/kg - 6,100 kcal/kg, <6,100 kcal/kg), by Volatility (High Volatile, Medium Volatile, Low...
Full DetailsPublished: 01 January 1970 -

Carbon Capture & Storage (CCS) Market Report 2018-2028
The Paris Climate Summit had 187 countries in attendance and certain measures were put in place to combat climate change...
Full DetailsPublished: 16 March 2018 -

Coal to Liquid (CTL) Market Report 2020-2030
Forecasts by Technology (Direct Liquefaction, Indirect Liquefaction), by Product (Diesel, Gasoline), By Application (Transportation Fuel, Cooking Fuel, Lubricants, Synthetic Waxes,...
Full DetailsPublished: 01 January 1970 -

Marine Seismic Equipment & Acquisition Market Forecast 2019-2029
Visiongain assesses that marine seismic equipment and acquisition market will reach $5.39bn in 2019. ...Full DetailsPublished: 21 June 2019 -

EOR Yearbook 2019: The Ultimate Guide to Enhanced Oil Recovery (EOR)
Visiongain’s latest EOR yearbook provides you with unprecedented in-depth analysis of the global EOR market. Visiongain assesses that the global...
Full DetailsPublished: 13 November 2018 -

Chemical Enhanced Oil Recovery (EOR) Market 2019-2029
This latest report by business intelligence provider visiongain assesses that Chemical EOR spending will reach $2.89bn in 2019. ...Full DetailsPublished: 03 June 2019 -

Charcoal Market Report to 2031
What are the key factors to reshaping the growth of the Charcoal market? To find out, you must read this...Full DetailsPublished: 01 January 1970 -

Land Seismic Equipment & Acquisition Market Forecast 2019-2029
Visiongain has calculated that the global Land Seismic Equipment & Acquisition Market will see a capital expenditure (CAPEX) of $2,405mn...
Full DetailsPublished: 27 March 2019 -
Coal Power Decommissioning Market Report 2022-2032
The global coal power decommissioning market was valued at US$7,087 million in 2021 and is projected to grow at a...Full DetailsPublished: 26 May 2022
Download sample pages
Complete the form below to download your free sample pages for Clean Coal Technologies (CCT) Market 2019-2029
Do you have any custom requirements we can help you with?
Any specific country, geo region, market segment or specific company information?
Email us today, we can discuss your needs and see how we can help: jamie.roberts@visiongain.com
Would you like a free report overview of the report of your choice?
If so, please drop an email to Jamie Roberts stating your chosen report title to jamie.roberts@visiongain.com
Visiongain energy reports are compiled using a broad and rich mixture of both primary and secondary information to produce an overall industry outlook. In order to provide our clients with the best product possible product, we do not rely on any one single source of information. Visiongain analysts reach out to market-leading vendors and industry experts where possible but also review a wealth of financial data and product information from a vast range of sources. To find out more about our reports methodology, please email jamie.roberts@visiongain.com
Would you like to get the latest Visiongain energy reports catalogue?
What are the dynamic growth sectors? where are the regional business opportunities?
Which technologies will prevail and who are the leading companies succeeding in these sectors and why?
If you want definitive answers to business critical questions, discover Visiongain’s full range of business intelligence reports.
If so, please email Jamie Roberts on jamie.roberts@visiongain.com or call her today on +44 207 336 6100
“The Visiongain report was extremely insightful and helped us construct our basic go-to market strategy for our solution.”
H.
“F.B has used Visiongain to prepare two separate market studies on the ceramic proppants market over the last 12 months. These reports have been professionally researched and written and have assisted FBX greatly in developing its business strategy and investment plans.”
F.B
“We just received your very interesting report on the Energy Storage Technologies (EST) Market and this is a very impressive and useful document on that subject.”
I.E.N
“Visiongain does an outstanding job on putting the reports together and provides valuable insight at the right informative level for our needs. The EOR Visiongain report provided confirmation and market outlook data for EOR in MENA with the leading countries being Oman, Kuwait and eventually Saudi Arabia.”
E.S
“Visiongain produced a comprehensive, well-structured GTL Market report striking a good balance between scope and detail, global and local perspective, large and small industry segments. It is an informative forecast, useful for practitioners as a trusted and upto-date reference.”
Y.N Ltd
Association of Dutch Suppliers in the Oil & Gas Industry
Society of Naval Architects & Marine Engineers
Association of Diving Contractors
Association of Diving Contractors International
Associazione Imprese Subacquee Italiane
Australian Petroleum Production & Exploration Association
Brazilian Association of Offshore Support Companies
Brazilian Petroleum Institute
Canadian Energy Pipeline
Diving Medical Advisory Committee
European Diving Technology Committee
French Oil and Gas Industry Council
IMarEST – Institute of Marine Engineering, Science & Technology
International Association of Drilling Contractors
International Association of Geophysical Contractors
International Association of Oil & Gas Producers
International Chamber of Shipping
International Shipping Federation
International Marine Contractors Association
International Tanker Owners Pollution Federation
Leading Oil & Gas Industry Competitiveness
Maritime Energy Association
National Ocean Industries Association
Netherlands Oil and Gas Exploration and Production Association
NOF Energy
Norsk olje og gass Norwegian Oil and Gas Association
Offshore Contractors’ Association
Offshore Mechanical Handling Equipment Committee
Oil & Gas UK
Oil Companies International Marine Forum
Ontario Petroleum Institute
Organisation of the Petroleum Exporting Countries
Regional Association of Oil and Natural Gas Companies in Latin America and the Caribbean
Society for Underwater Technology
Society of Maritime Industries
Society of Petroleum Engineers
Society of Petroleum Enginners – Calgary
Step Change in Safety
Subsea UK
The East of England Energy Group
UK Petroleum Industry Association
All the events postponed due to COVID-19.
Don’t Miss Out!
Subscribe to receive the latest Industry news, trending insight and analysis straight to your inbox.Choose your preferences:
Latest Energy news
Energy as a Service (EaaS) Market
The global Energy as a Service (EaaS) market is projected to grow at a CAGR of 12.6% by 2034
25 July 2024
Synthetic Fuels Market
The global Synthetic Fuels market is projected to grow at a CAGR of 23% by 2034
18 July 2024
Power-to-X (P2X) Market
The global Power-to-X (P2X) market is projected to grow at a CAGR of 10.6% by 2034
09 July 2024
Airborne Wind Energy Market
The global Airborne Wind Energy market is projected to grow at a CAGR of 9.7% by 2034
05 June 2024
