The Report Will Answer Questions Such as:
• Who are the leading companies in the carbon capture and storage industry?
– What is their strategy?
– What is their existing capacity and number of projects?
– What are the companies’ recent developments?
• What is driving and restraining the carbon capture and storage market?
• What are the Political, Economic, Social and Technological issues facing the carbon capture and storage market?
How will you benefit from this report?
• This report you will keep your knowledge base up to speed. Don’t get left behind
• This report will allow you to reinforce strategic decision-making based upon definitive and reliable market data
• You will learn how to exploit new technological trends
• You will be able to realise your company’s full potential within the market
• You will better understand the competitive landscape and identify potential new business opportunities and partnerships
Three reasons why you must order and read this report today:
1) The study reveals where and how leading companies are investing in the carbon capture and storage market. We show you the prospects for companies operating in:
• North America
• Asia-Pacific
• Europe
2) The report provides a detailed individual profile for each of the top 20 companies in carbon capture and storage market in 2019, providing data for Revenue and market share, along with recent activities for these companies
• General Electric
• Mitsubishi Heavy Industrial Ltd.
• Occidental Petroleum
• Air Liquide
• Air Products & Chemicals Inc.
• Praxair Technology, Inc.
• Linde Group
• Dakota Gas
• Enhance Energy Inc.
• Aker Solutions
• Petronas
• Schlumberger Limited
• Royal Dutch Shell plc
• NRG Energy
• ADNOC
• Climeworks
• Global Thermostat
• Carbon Engineering Ltd.
• CO2 Solutions
• Exxon Mobil
3) It also provides a PEST analysis of the key factors affecting the overall carbon capture and storage market:
• Political
• Economic
• Social
• Technical
Competitive advantage
This independent, 124-page report guarantees you will remain better informed than your competitors. With 99 tables and figures examining the companies within the carbon capture and storage market space, the report gives you an immediate, one-stop breakdown of the leading CCS companies plus analysis and future outlooks, keeping your knowledge one step ahead of your rivals.
Who should read this report?
• Anyone within the carbon capture, carbon reduction value chain
• CEOs
• COOs
• CIOs
• Business development managers
• Marketing managers
• Technologists
• Suppliers
• Investors
• Banks
• Government agencies
• Contractors
Don’t miss out
This report is essential reading for you or anyone in the oil or other industries with an interest in carbon reduction. Purchasing this report today will help you to recognise those important market opportunities and understand the possibilities there. Order our Top 20 Companies in Carbon Capture and Storage 2019: Profiles of Leading Companies Operating Within the Carbon Capture and Storage Market Including Financial and Market Share Analysis (No. of Projects, $Million) Plus Project Tables.
Visiongain is a trading partner with the US Federal Government
CCR Ref number: KD4R6
1. Report Overview
1.1 Carbon Capture and Storage Market Overview
1.2 Market Structure Overview and Market Definition
1.3 Why You Should Read This Report
1.4 How This Report Delivers
1.5 Key Questions Answered by This Analytical Report Include:
1.6 Who is This Report For?
1.7 Methodology
1.7.1 Primary Research
1.7.2 Secondary Research
1.8 Frequently Asked Questions (FAQ)
1.9 Associated Visiongain Reports
1.10 About Visiongain
2. Introduction to the Waste-to-Energy Market
2.1 Carbon Capture
2.2 Carbon Transportation
2.3 Carbon Storage
2.3.1 Storage in Depleted Oil and Gas Fields
2.3.2 Storage in Deep Saline Aquifers
2.3.3 Storage in Un-minable Coal Seams
2.4 Carbon Dioxide Enhanced Oil Recovery
2.5 Sources of Carbon Dioxide
2.6 Policy Incentives for the Increased Uptake of Carbon Capture & Storage
2.7 Why Are Carbon Tax Policies & Emission Trading Schemes Necessary?
2.8 Market Definition
3. Leading Companies in Carbon Capture and Storage
3.1 General Electric
3.1.1 General Electric Business Overview
3.1.2 General Electric Recent Developments
3.1.3 General Electric Business Strategy
3.2 Mitsubishi Heavy Industries Inc.
3.2.1 Mitsubishi Heavy Industries Business Overview
3.2.2 Mitsubishi Heavy Industries Recent Developments
3.2.3 Mitsubishi Heavy Industries Business Strategy
3.3 Occidental Petroleum Corporation
3.3.1 Occidental Business Overview
3.3.2 Occidental Recent Developments
3.3.3 Occidental Business Strategy
3.4 Air Liquide
3.4.1 Air Liquide Business Overview
3.4.2 Air Liquide Recent Developments
3.4.3 Air Liquide Business Strategy
3.5 Air Products & Chemicals, Inc.
3.5.1 Air Products & Chemicals Business Overview
3.5.2 Air Products & Chemicals Recent Developments
3.5.3 Air Products & Chemicals Business Strategy
3.6 Praxair Technology, Inc.
3.6.1 Praxair Technology Business Overview
3.6.2 Praxair Technology Recent Developments
3.6.3 Praxair Technology Business Strategy
3.7 Linde Group
3.7.1 Linde Group Business Overview
3.7.2 Linde Group Recent Developments
3.7.3 Linde Group Business Strategy
3.8 Dakota Gas
3.8.1 Business Overview
3.8.2 Business Strategy
3.9 Enhance Energy Inc.
3.9.1 Business Overview
3.9.2 Recent Developments
3.10 Aker Solutions
3.10.1 Aker Solutions Business Overview
3.10.2 Aker Solutions Recent Developments
3.10.3 Aker Solutions Business Strategy
3.11 Petronas
3.11.1 Petronas Business Overview
3.11.2 Petronas Recent Development
3.11.3 Petronas Business Strategy
3.12 Schlumberger Limited
3.12.1 Schlumberger Business Overview
3.13.2 Schlumberger Business Strategy
3.13 Royal Dutch Shell plc
3.13.1 Royal Dutch Shell Business Overview
3.13.2 Royal Dutch Shell Recent Development
3.13.3 Royal Dutch Shell Business Strategy
3.14 NRG Energy
3.14.1 NRG Energy Business Overview
3.14.2 NRG Energy Recent Developments
3.14.3 NRG Energy Business Strategy
3.15 Abu Dhabi National Oil Company (ADNOC)
3.15.1 Company Analysis
3.15.2 Recent Development
3.16 Climeworks
3.16.1 Climeworks Company Analysis
3.16.2 Climeworks Recent Development
3.17 Global Thermostat
3.17.1 Global Thermostat Company Analysis
3.17.2 Global Thermostat Recent Development
3.18 Carbon Engineering Ltd.
3.18.1 Carbon Engineering Company Analysis
3.18.2 Carbon Engineering Recent Development
3.19 CO2 Solutions
3.19.1 CO2 Solutions Company Analysis
3.19.2 CO2 Solutions Recent Development
3.20 ExxonMobil
3.20.1 Exxon Mobil Company Analysis
3.20.2 Exxon Mobil Recent Developments
3.20.3 ExxonMobil Business Strategy
3.21 List of Operational, Planned and Upcoming Carbon Capture and Storage Projects
4. Conclusion & Recommendations
4.1 Recommendations
5. Glossary
Associated Visiongain Reports
Visiongain Report Sales Order Form
Appendix A
Appendix B
List of Tables
Table 3.1 The Leading 22 Companies in CO2 Scrubbing/Removal Technologies Market- Capture & Storage Capacity (Million Tons), Number of CCS Projects Executed (Including Upcoming Projects), 2018
Table 3.2 General Electric Profile 2017 (Market Entry, Public/Private, Headquarters, No. of Employees, Revenue 2017 $bn, Change in Revenue, Number of Carbon Capture Projects, Geography, Key Markets, listed on, Products/ Services)
Table 3.3 General Electric Total Company Revenue 2013-2017 ($bn, AGR %)
Table 3.4 Mitsubishi Heavy Industries Ltd Profile 2018 (Market Entry, Public/Private, Headquarters, No. of Employees, Company Revenue $bn, Change in Revenue, Total Installed Carbon Capture Facilities, Geography, Key Markets, Listed on, Products/ Services)
Table 3.5 Mitsubishi Heavy Industries Ltd, Total Company Sales 2014-2018 ($bn, AGR %)
Table 3.6 Mitsubishi Heavy Industries Ltd. Carbon Capture & Storage Projects (Companies, Country, $m Value, Details)
Table 3.7 Occidental Petroleum Corporation Profile 2017 (Market Entry, Public/Private, Headquarters, No. of Employees, Revenue 2017 $bn, Change in Revenue, Geography, Key Market, Listed on, Products/Services)
Table 3.8 Occidental Petroleum Corporation, Total Company Sales 2013-2017 ($bn, AGR %)
Table 3.9 Air Liquide Profile 2017 (Market Entry, Public/Private, Headquarters, No. of Employees, Revenue $bn, Change in Revenue, Geography, Key Markets, Listed on, Products/Services)
Table 3.10 Air Liquide Total Company Sales 2013-2017 ($ bn, AGR %)
Table 3.11 Air Liquide Revenue Carbon Capture/Scrubbing Technology & Storage Projects (Companies, Country, Details)
Table 3.12 Air Products & Chemicals, Inc. Profile 2018 (Market Entry, Public/Private, Headquarters, No. of Employees, Revenue $bn, Change in Revenue, Geography, Key Markets, Listed on, Products/Services)
Table 3.13 Air Products & Chemicals Total Company Sales 2014-2018 ($ bn, AGR %)
Table 3.14 Air Products & Chemicals Inc. Carbon Capture Projects (Companies, Country, $m Value, Details)
Table 3.15 Praxair Technology, Inc. Profile 2017 (Market Entry, Public/Private, Headquarters, No. of Employees, Revenue $bn, Change in Revenue, Geography, Key Markets, Listed on, Products/Services)
Table 3.16 Praxair Technology, Inc. Total Company Sales 2013-2017 ($ bn, AGR %)
Table 3.17 Linde Group Profile 2017 (Market Entry, Public/Private, Headquarters, No. of Employees, Revenue $bn, Change in Revenue, Geography, Key Markets, Listed on, Products/Services)
Table 3.18 Linde AG, Inc. Total Company Sales 2013-2017 ($ bn, AGR %)
Table 3.19 Linde AG Carbon Capture & Storage Projects (Companies, Country, Details, Model/Type)
Table 3.20 Dakota Gas Profile 2017 (Market Entry, Public/Private, Headquarters, No. of Employees, Revenue US $mn, Change in Revenue, Geography, Key Markets, Products/Services)
Table 3.21 Basin Electric Power Cooperative (Parent Company) Total Company Sales 2013-2017 ($ bn, AGR %)
Table 3.22 Basin Electric Power Cooperative Facilities Running on Coal, Wind, Natural Gas, Hydro, Nuclear or Oil
Table 3.23 Enhance Energy Inc. Profile 2017 (Market Entry, Public/Private, Headquarters, Geography, Key Market, Products/Services)
Table 3.24 Aker Solutions Profile 2017 (Market Entry, Public/Private, Headquarters, No. of Employees, Revenue $bn, Change in Revenue, Geography, Key Markets, Listed on, Products/Services)
Table 3.25 Aker Solutions Total Company Sales 2013-2017 ($ bn, AGR %)
Table 3.26 Petronas Profile 2017 (Market Entry, Public/Private, Headquarters, No. of Employees, Revenue $bn, Change in Revenue, Geography, Key Markets, Listed on, Products/Services)
Table 3.27 Petronas Total Company Revenue 2013-2017 ($bn, AGR %)
Table 3.28 Schlumberger Limited Profile 2017 (Market Entry, Public/Private, Headquarters, No. of Employees, Revenue US$bn, Change in Revenue, Number of Carbon Capture Projects, Geography, Key Markets, Listed on, Products/Services)
Table 3.29 Schlumberger Limited Total Company Sales 2013-2017 ($bn, AGR %)
Table 3.30 Schlumberger List of Key Carbon Capture & Storage Projects (Companies, Country, Details)
Table 3.31 Royal Dutch Shell plc Profile 2017 (Market Entry, Public/Private, Headquarters, No. of Employees, Revenue $bn, Change in Revenue, Number of carbon Capture Projects, Geography, Key Markets, Listed on, Products/Services)
Table 3.32 Royal Dutch Shell plc Total Company Sales 2013-2017 (US$mn, AGR %)
Table 3.33 Royal Dutch Shell, List of Executed Carbon capture and storage Projects
Table 3.34 NRG Energy Profile 2017 (Market Entry, Public/Private, Headquarters, No. of Employees, Revenue $bn, Change in Revenue, Number of carbon Capture Projects, Geography, Key Markets, Listed on, Products/Services)
Table 3.35 NRG Energy Total Company Sales 2013-2017 ($ bn, AGR %)
Table 3.36 Abu Dhabi National Oil Company Profile 2017 (Market Entry, Public/Private, Headquarters, No. of Employees, Revenue US$bn, Change in Revenue, Geography, Key Market, Products/Services)
Table 3.37 Abu Dhabi National Oil Total Company Sales 2016-2018 ($bn, AGR %)
Table 3.38 Climeworks Profile 2018 (Market Entry, Public/Private, Headquarters, No. of Employees, Revenue $bn, Change in Revenue, Geography, Key Markets, Products/ Services)
Table 3.39 Global Thermostat Profile 2018 (Market Entry, Public/Private, Headquarters, Geography, Key Markets, Products/ Services)
Table 3.40 Carbon Engineering Ltd. Profile 2018 (Market Entry, Public/Private, Headquarters, Geography, Key Markets, Products/ Services)
Table 3.41 CO2 Solutions Profile 2018 (Market Entry, Public/Private, Headquarters, Geography, Number of Employees, Revenue $, Key Markets, Products/ Services)
Table 3.42 ExxonMobil Profile 2017 (Market Entry, Public/Private, Headquarters, No. of Employees, Revenue $bn, Change in Revenue, Number of CCS Projects, Geography, Key Markets, Products/Services)
Table 3.43 ExxonMobil, Total Company Sales 2013-2017 ($bn, AGR %)
Table 3.46 List of Operational, Planned and Upcoming Carbon Capture and Storage Projects
List of Figures
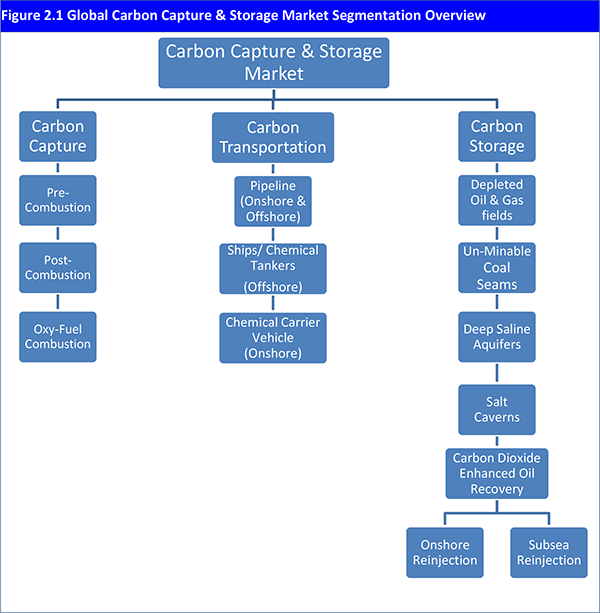
Figure 2.1 Global Carbon Capture & Storage Market Segmentation Overview
Figure 2.2 Global Carbon Capture & Storage Market Structure Overview
Figure 2.3 CO2 Source, Capture, Transport, Injection and Storage Technologies
Figure 2.4 CO2 Injected by Key Nation in 2018 (Million Tonnes)-Cumulative
Figure 3.1 The Leading Companies in CO2 Scrubbing/Removal Technologies Market Share 2018 (%)
Figure 3.2 General Electric Total Company Revenue, ($bn& AGR %), 2013-2017
Figure 3.3 General Electric % Revenue Share, by Regional Segment, 2017
Figure 3.4 General Electric % Revenue Share, by Business Segment, 2017
Figure 3.5 Mitsubishi Heavy Industries Ltd Company Revenue, ($bn& AGR %), 2014-2018
Figure 3.6 Mitsubishi Heavy Industries Ltd., % Revenue Share, by Business Segment, 2018
Figure 3.7 Mitsubishi Heavy Industries Ltd., % Revenue Share, by Regional Segment, 2018
Figure 3.8 Occidental Petroleum Corporation Company Revenue, ($bn& AGR %), 2013-2017
Figure 3.9 Occidental Petroleum Corporation % Revenue Share, by Business Segment, 2017
Figure 3.10 Air Liquide, % Revenue Share, by Business Segment, 2017
Figure 3.11 Air Liquide, % Revenue Share, by Gas & Services Revenue by World Business Line, 2017
Figure 3.12 Air Liquide, % Revenue Share, by Geographic Segment (Gas & Services), 2017
Figure 3.13 Air Liquide Revenue, ($bn & AGR %), Y-o-Y Revenue Growth, 2013-2017
Figure 3.14 Air Products & Chemicals, % Revenue Share, by Geographical Segment, 2018
Figure 3.15 Air Products & Chemicals, % Revenue Share, by Business Segment, 2018
Figure 3.16 Air Products & Chemicals Revenue, ($bn & AGR %), Y-o-Y Revenue Growth, 2014-2018
Figure 3.17 Praxair Technology, Inc., % Revenue Share, by Business Segment, 2017
Figure 3.18 Praxair Technology, Inc., % Sales Share, by End-Markets, 2017
Figure 3.19 Praxair Technology, Inc., % Revenue Share, by Geographic Segment, 2017
Figure 3.20 Praxair Technology, Inc Revenue, ($bn & AGR %), Y-o-Y Revenue Growth, 2013-2017
Figure 3.21 Linde AG, % Revenue Share, by Geographical Segment, 2016
Figure 3.22 Linde AG, % Revenue Share, by Business Segment, 2017
Figure 3.23 Linde AG Revenue, ($bn & AGR %), Y-o-Y Revenue Growth, 2013-2017
Figure 3.24 Basin Electric Power Cooperative (Parent Company) Revenue, ($bn& AGR %), Y-o-Y Revenue Growth, 2013-2017
Figure 3.25 Dakota Gas % Revenue Share, by Business Segment, 2017
Figure 3.26 Dakota Gas % Revenue Share, by Product Segment, 2017
Figure 3.27 Aker Solutions, % Revenue Share, by Business Segment, 2017
Figure 3.28 Aker Solutions, % Revenue Share, by Geographic Segment, 2017
Figure 3.29 Aker Solutions Revenue, ($bn & AGR %), Y-o-Y Revenue Growth, 2013-2017
Figure 3.30 Petronas Total Company Revenue, ($bn & AGR %), 2013-2017
Figure 3.31 Petronas Revenue % Share, by Product Segment, 2017
Figure 3.32 Petronas Revenue % Share, by Geographical Trade, 2017
Figure 3.33 Petronas Revenue % Share, by Business Segment, 2017
Figure 3.34 Petronas Revenue % Share, by Geographic Segment, 2017
Figure 3.35 Schlumberger Limited, Revenue, ($bn& AGR %), 2013-2017
Figure 3.36 Schlumberger Limited Revenue %Share, by Business Segment, 2017
Figure 3.37 Schlumberger Limited Revenue %Share, by Regional Segment, 2017
Figure 3.38 Royal Dutch Shell plc Total Company Sales 2013-2017 (US$mn, AGR %)
Figure 3.39 Royal Dutch Shell Revenue % Share, by Business Segment, 2017
Figure 3.40 Royal Dutch Shell Revenue % Share, by Regional Segment, 2017
Figure 3.41 NRG Energy, % Revenue Share, by Business Segment, 2017
Figure 3.42 NRG Energy, % Revenue Share, by Fuel Type (GW), 2017
Figure 3.43 NRG Energy, % Revenue Share, by Markets (GW), 2017
Figure 3.44 NRG Energy Revenue, ($bn & AGR %), Y-o-Y Revenue Growth, 2013-2017
Figure 3.45 Abu Dhabi National Oil, Revenue, ($bn& AGR %), 2016-2018
Figure 3.46 Abu Dhabi National Oil Revenue %Share, by Business Segment, 2017
Figure 3.47 Abu Dhabi National Oil, by Capital Expenditure ($ mn), 2017-2018
Figure 3.48 ExxonMobil, Revenue, ($bn& AGR %), 2013-2017
Figure 3.49 ExxonMobil, % Revenue Share, by Business Segment, 2017
ADNOC
Air Liquide
Air Products & Chemicals Inc.
Aker Solutions
Algenol
Alstom Power
BASF
Basin Electric Power
British Columbia Innovative Clean Energy Fund
CarbFix2
Carbon Engineering Ltd.
Chevron Corporation
Climeworks
CO2 Solutions
Dakota Gas
Department of Energy
Emirate Steel Industries
Enhance Energy Inc.
Exxon Mobil
General Electric
Georgia Tech
Global Thermostat
Hydro-Québec
JX Nippon Oil & Gas
Linde Group
Masdar
Mitsubishi Heavy Industrial Ltd.
Mizuho Bank
Natural Resources Canada
NRG Energy
Occidental Petroleum
OGCI
Oxy Low Carbon Ventures
Petra Nova
Petronas
Praxair Technology, Inc.
Reliant
Royal Dutch Shell plc
RWE
Sargas
Schlumberger Limited
Statoil
Total
Vattenfall
Wolf Carbon Solutions Inc
Organisations Mentioned
Climate Change and Emissions Management Corporation
Government of Quebec
Industrial Research Assistantship Program
International Energy Agency (IEA)
Japan Bank for International Cooperation
Oil and Gas Climate Initiative (OGCI)
World Alliance

