Visiongain has calculated that the global Land Seismic Equipment & Acquisition Market will see a capital expenditure (CAPEX) of $2,168.2mn in 2018. Read on to discover the potential business opportunities available.
For E&P and mining industries, land seismic surveys are carried out to generate subsea bottom profiles. This type of surveying is conducted by generating mechanical sound waves that are sent into the earth. The energy reflected back from the earth is measured by recording sensors which are installed in mounted trucks which consist of tapes to record any activity. The land seismic operations require various equipment such as geophones, seismic sensors, streamers, hydrophones, air or water gun, streamers, and sub-bottom profilers.
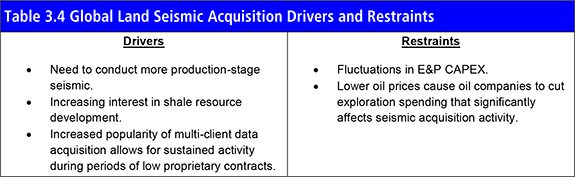
Declining prices of oil & gas have resulted in cutting investments in the E&P oil & gas sector. This, in turn, has resulted in land seismic acquisition companies making major cuts with regards to spending in order to remain profitable during this market downturn. Thus, the land or onshore seismic equipment & acquisition is highly dependent on the price of oil & gas prevailing in the market.
Due to volatility in crude oil and natural gas prices, several upstream companies are cutting E&P budgets and even spending on land seismic equipment. However, technological advancements coupled with increased energy requirement in developing nations and exploitation of shale gas reserves are key drivers for the growth in demand for land seismic equipment over the forecast period.
The land seismic equipment market experienced a shock after the oil price fall in late 2014 with the industry becoming cautious and cutting exploration expenses to retain profitability. Oil price recovery and the need for oil companies to continue to add value to their resources will drive a new wave of investment in seismic equipment from 2019 but constrained from lower oil price levels. For years before 2019, the limited exploration activity will be mostly met by current equipment.
Visiongain’s global Land Seismic Equipment & Acquisition Market report can keep you informed and up to date with the developments in the market, across seven different regions: North America, Europe, Middle East, Africa, Asia Pacific, Russia/CIS and South America.
With reference to this report, it details the key investments trend in the global market, subdivided by regions, capital expenditure and equipment. Through extensive secondary research and interviews with industry experts, visiongain has identified a series of market trends that will impact the Land Seismic Equipment & Acquisition Market over the forecast timeframe.
The report will answer questions such as:
– How is the land seismic equipment & acquisition market evolving?
– What is driving and restraining the land seismic equipment & acquisition market dynamics?
– How will each technology in equipment & acquisition market submarket segment grow over the forecast period and how much sales will these submarkets account for in 2028?
– How will market shares of each the land seismic equipment & acquisition submarket develop from 2018-2028?
– Which individual technologies will prevail and how will these shifts be responded to?
– Which land seismic equipment & acquisition submarket will be the main driver of the overall market from 2018-2028?
– How will political and regulatory factors influence regional the land seismic equipment & acquisition market and submarkets?
– Will leading national the land seismic equipment & acquisition market broadly follow macroeconomic dynamics, or will individual country sectors outperform the rest of the economy?
– How will market shares of the national markets change by 2028 and which nation will lead the market in 2028?
– Who are the leading players and what are their prospects over the forecast period?
– How will the sector evolve as alliances form during the period between 2018 and 2028?
Five Reasons Why You Must Order and Read This Report Today:
1) The report provides forecasts for the Land Seismic Equipment & Acquisition market by Equipment, for the period 2018-2028
– Sensors submarket 2018-2028
– Sources submarket 2018-2028
– Cable Based Acquisition Systems submarket 2018-2028
– Wireless Acquisition Systems submarket 2018-2028
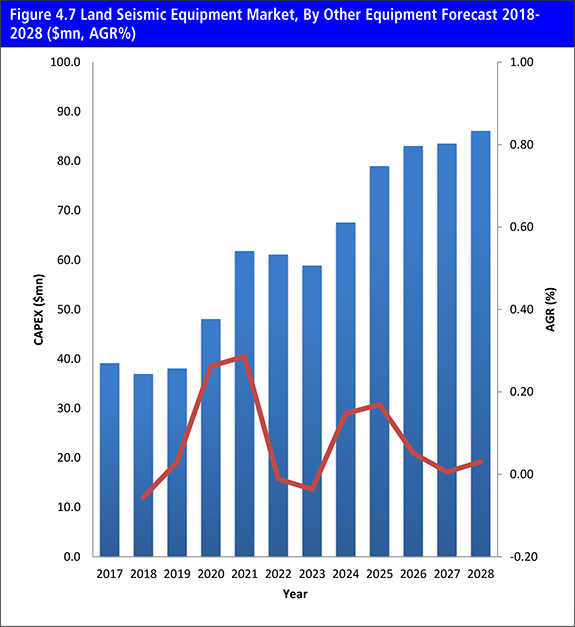
– Other Equipment submarket 2018-2028
2) The report also forecasts and analyses the Land Seismic Equipment & Acquisition market by Region from 2018-2028
North America
– United States CAPEX 2018-2028
– Canada CAPEX 2018-2028
Asia Pacific
– China CAPEX 2018-2028
– Japan CAPEX 2018-2028
– India CAPEX 2018-2028
– ASEAN CAPEX 2018-2028
– Rest of Asia Pacific CAPEX 2018-2028
Europe
– UK CAPEX 2018-2028
– Italy CAPEX 2018-2028
– Spain CAPEX 2018-2028
– Germany CAPEX 2018-2028
– Rest of Europe CAPEX 2018-2028
Middle East
– GCC CAPEX 2018-2028
– Rest of the Middle East and Africa CAPEX 2018-2028
Africa
– South Africa CAPEX 2018-2028
– Nigeria CAPEX 2018-2028
– Rest of the Africa CAPEX 2018-2028
Russia/CIS CAPEX 2018-2028
South America
– Brazil CAPEX 2018-2028
– Venezuela CAPEX 2018-2028
– Rest of Latin America CAPEX 2018-2028
3) The report reveals the Drivers and Restraints in the Land Seismic Equipment & Acquisition market
4) The report includes PEST Analysis affecting the Land Seismic Equipment & Acquisition market
5) The report provides detailed profiles of the leading companies operating within the Land Seismic Equipment & Acquisition market:
– Tesla Exploration Ltd.
– SAExploration
– Terraseis
– Sercel
– Terrex Seismic
– WesternGeco
– Mitcham Industries
– International Seismic Co. (iSeis)
– ION Geophysical Corporation
– Geometrics
– Geospace Technologies
– INOVA Technologies
– PASI srl Technologies
– ARGAS
– BGP Inc.
– Baoding Longet Equipment Co., Ltd.
– CGG
– Geokinetics
This independent 237-page report guarantees you will remain better informed than your competitors. With 132 tables and figures examining the Land Seismic Equipment & Acquisition market space, the report gives you a direct, detailed breakdown of the market. PLUS, Capital expenditure by equipment and region, as well as in-Depth analysis of leading companies in the Land Seismic Equipment & Acquisition market from 2018-2028 that will keep your knowledge that one step ahead of your rivals.
This report is essential reading for you or anyone in the Energy sector. Purchasing this report today will help you to recognise those important market opportunities and understand the possibilities there. I look forward to receiving your order.
Visiongain is a trading partner with the US Federal Government
CCR Ref number: KD4R6
1. Report Overview
1.1 Land Seismic Equipment & Acquisition Market Overview
1.2 Market Structure Overview and Market Definition
1.3 Why You Should Read This Report
1.4 How This Report Delivers
1.5 Key Questions Answered by This Analytical Report Include:
1.6 Who is This Report For?
1.7 Methodology
1.7.1 Primary Research
1.7.2 Secondary Research
1.7.3 Market Evaluation & Forecasting Methodology
1.8 Frequently Asked Questions (FAQ)
1.9 Associated Visiongain Reports
1.10 About Visiongain
2. Introduction to The Land Seismic Equipment & Acquisition Market
2.1 The Land Seismic Equipment Market Structure
2.2 The Land Seismic Acquisition Market Structure
2.3 Land Seismic Industry Outlook
2.4 Types of Land Seismic Equipment and Acquisition
2.5 Land Seismic Market Seasonality
2.6 Marine Seismic
2.7 Shallow Water Transition Zone (SWTZ) Seismic
2.8 Exploration Phase Seismic versus Production Phase Seismic
2.9 Multi-Client Seismic Services (MCS)
2.10 Shale Resource Development and Land Seismic Acquisition
2.11 Enhanced Oil Recovery and Production Stage Seismic
2.12 Liquefying Natural Gas to Monetise Onshore Gas Reserves
3. Global Overview of Land Seismic Equipment & Acquisition Market 2018-2028
3.1 Global Overview of Land Seismic Equipment Market 2018-2028
3.1.1 Land Seismic and Equipment Driver and Restraints
3.2 Global Overview of Land Seismic Acquisition Market 2018-2028
3.3.1 Land Seismic Acquisition Driver and Restraints
3.3.2 Potential Planned Projects
4. Land Seismic Equipment Submarkets Forecast 2018-2028
4.1 Global Land Seismic Equipment Submarkets Forecasts, by Type 2018-2028
4.1.1 Global Sensors Forecast 2018-2028
4.1.1.1 Global Sensors Drivers and Restraints
4.1.2 Global Sources Forecast 2018-2028
4.1.2.1 Global Sources Drivers and Restraints
4.1.3 Global Cable Based Acquisition Systems Forecast 2018-2028
4.1.3.1 Global Cable Based Acquisition Systems Drivers and Restraints
4.1.4 Global Wireless Acquisition Systems Forecasts 2018-2028
4.1.5 Global Other Equipment Forecast 2018-2028
5. Leading National Land Seismic Equipment & Acquisition Forecasts 2018-2028
5.1 Land Seismic Acquisition, Market Attractiveness Analysis, 2018
5.2 North America Land Seismic Acquisition Market Forecast 2018-2028
5.3 Asia Pacific Land Seismic Acquisition Market Forecast 2018-2028
5.4 Middle East Land Seismic Acquisition Market Forecast 2018-2028
5.5 Russia/CIA Land Seismic Acquisition Market Forecast 2018-2028
5.6 Africa Land Seismic Acquisition Market Forecast 2018-2028
5.7 South America Land Seismic Acquisition Market Forecast 2018-2028
5.8 Europe Land Seismic Acquisition Market Forecast 2018-2028
6. PESTEL Analysis of the Land Seismic Equipment & Acquisition Market 2018-2028
7. Expert Opinion
7.1 Primary Correspondents
7.2 Land Seismic Equipment & Acquisition Outlook
7.4 Driver & Restraints
7.3 Dominant Region/Country
7.4 Land Seismic Equipment Scenario
7.5 Overall Growth Rate, Globally
8. The Leading Companies in the Land Seismic Equipment & Acquisition Market
8.1 Tesla Exploration Ltd.
8.1.1 Tesla Exploration Ltd Company Analysis
8.2 SAExploration
8.2.1 SAExploration Company Analysis
8.3 Terraseis
8.3.1 Terraseis Company Analysis
8.4 Sercel
8.4.1 Sercel Company Analysis
8.5 Terrex Seismic
8.5.1 Terrex Seismic Company Analysis
8.6 WesternGeco
8.6.1 WesternGeco Company Analysis
8.7 Mitcham Industries
8.7.1 Mitcham Industries Company Analysis
8.8 International Seismic Co. (iSeis)
8.8.1 International Seismic Co. (iSeis) Company Analysis
8.9 ION Geophysical Corporation
8.9.1 ION Geophysical Corporation Company Analysis
8.10 Geometrics
8.10.1 Geometrics Company Analysis
8.11 Geospace Technologies
8.11.1 Geospace Technologies Company Analysis
8.12 INOVA Technologies
8.12.1 INOVA Company Analysis
8.13 PASI srl Technologies
8.13.1 PASI srl Company Analysis
8.14 ARGAS
8.14.1 ARGAS Company Analysis
8.15 BGP Inc.
8.15.1 BGP Inc. Company Analysis
8.16 Baoding Longet Equipment Co., Ltd.
8.16.1 Baoding Longet Equipment Co., Ltd Company Analysis
8.17 CGG
8.17.1 CGG Company Analysis
8.18 Geokinetics
8.18.1 Geokinetics Company Analysis
8.19 Other Land Seismic Companies
9. Conclusions and Recommendations
10. Glossary
Appendix
Associated Visiongain Reports
Visiongain Report Sales Order Form
Appendix A
Appendix B
Visiongain Report Evaluation Form
List of Tables
Table 1.1 Global Land Seismic Acquisition Market, by Country Forecast 2018-2028 ($mn, AGR %, Cumulative)
Table 2.1 Land Seismic Source Type Advantages / Disadvantages, (Explosives, Vibroseis)
Table 3.1 Global Land Seismic Equipment Market Forecast 2018-2028 ($ mn, AGR %, CAGR %, Cumulative)
Table 3.2 Global Land Seismic Equipment Drivers and Restraints
Table 3.3 Global Land Seismic Acquisition Market Forecast 2018-2028 ($ mn, AGR %, CAGR %, Cumulative)
Table 3.4 Global Land Seismic Acquisition Drivers and Restraints
Table 4.1 Global Land Seismic Equipment Market Forecast 2018-2028($mn, AGR %, Cumulative)
Table 4.2 Global Sensors Forecast 2018-2028($mn, AGR %, CAGR %, Cumulative)
Table 4.3 Global Sensors Drivers and Restraints
Table 4.4 Global Sources Forecast 2018-2028($mn, AGR %, CAGR %, Cumulative)
Table 4.5 Global Small-Scale Liquefaction Drivers and Restraints
Table 4.6 Global Cable Based Acquisition Systems Forecast 2018-2028($mn, AGR %, CAGR %, Cumulative)
Table 4.7 Global Cable Based Acquisition Systems Drivers and Restraints
Table 4.8 Global Wireless Acquisition Systems Forecast 2018-2028($mn, AGR %, CAGR %, Cumulative)
Table 4.9 Global Other Equipment Forecast 2018-2028($mn, AGR %, CAGR %, Cumulative)
Table 5.1 Global Land Seismic Acquisition Market, by Country Forecast 2018-2028 ($mn, AGR %, Cumulative)
Table 5.2 North America Land Seismic Acquisition Market Forecast, 2018-2028 ($ mn, AGR %, CAGR%, Cumulative)
Table 5.3 North America Land Seismic Acquisition Market Forecast, by Country, 2018-2028 ($ mn, AGR %, Cumulative)
Table 5.4 Asia Pacific Land Seismic Acquisition Market Forecast, 2018-2028 ($ mn, AGR %, CAGR%, Cumulative)
Table 5.5 Asia Pacific Land Seismic Acquisition Market Forecast, by Country, 2018-2028 ($ mn, AGR %, Cumulative)
Table 5.6 Middle East Land Seismic Acquisition Market Forecast, 2018-2028 ($ mn, AGR %, CAGR%, Cumulative)
Table 5.7 Middle East Land Seismic Acquisition Market Forecast, by Country, 2018-2028 ($ mn, AGR %, Cumulative)
Table 5.8 Russia/CIA Land Seismic Acquisition Market Forecast, 2018-2028 ($ mn, AGR %, CAGR%, Cumulative)
Table 5.9 Africa Land Seismic Acquisition Market Forecast, 2018-2028 ($ mn, AGR %, CAGR%, Cumulative)
Table 5.10 Africa Land Seismic Acquisition Market Forecast, by Country, 2018-2028 ($ mn, AGR %, Cumulative)
Table 5.11 South America Land Seismic Acquisition Market Forecast, 2018-2028 ($ mn, AGR %, CAGR%, Cumulative)
Table 5.12 South America Land Seismic Acquisition Market Forecast, by Country, 2018-2028 ($ mn, AGR %, Cumulative)
Table 5.13 Europe Land Seismic Acquisition Market Forecast, 2018-2028 ($ mn, AGR %, CAGR%, Cumulative)
Table 5.14 Asia Pacific Land Seismic Acquisition Market Forecast, by Country, 2018-2028 ($ mn, AGR %, Cumulative)
Table 6.1 PESTEL Analysis, Land Seismic Equipment & Acquisition Market
Table 8.1 Tesla Exploration Ltd. Profile (Market Entry, Public/Private, Headquarter, No. of Employees, Revenue in $mn, 2015, Change in Revenue from 2014, Geography, Key Markets, Listed on, Products/Services)
Table 8.2 Tesla Exploration Ltd., Exploration Service & Equipment Details
Table 8.3 SAExploration Profile (Market Entry, Public/Private, Headquarter, No. of Employees, Revenue in $mn, 2016, Change in Revenue from 2015, Geography, Key Markets, Listed on, Products/Services)
Table 8.4 SAExploration Services (Category, Type, & Description)
Table 8.5 Terraseis Profile (Market Entry, Public/Private, Headquarter, No. of Employees, Revenue in $mn, 2015, Change in Revenue from 2015, Geography, Key Markets, Listed on, Products/Services)
Table 8.6 Terraseis Seismic Acquisition Equipment
Table 8.7 Terraseis Seismic Acquisition Survey Details (Year, Location, Terrain, Source Type, Size, and 2D/3D)
Table 8.8 Sercel Profile (Market Entry, Public/Private, Headquarter, No. of Employees, Revenue in $mn, 2016, Change in Revenue from 2015, Geography, Key Markets, Listed on, Products/Services)
Table 8.9 Sercel Seismic Acquisition Equipment
Table 8.10 Terrex Seismic Profile (Market Entry, Public/Private, Headquarter, No. of Employees, Revenue in $mn, 2015, Change in Revenue from 2014, Geography, Key Markets, Listed on, Products/Services)
Table 8.11 Terrex Seismic Details
Table 8.12 Terrex Seismic Equipment Details (Type and Model)
Table 8.13 WesternGeco Profile (Market Entry, Public/Private, Headquarter, No. of Employees, Revenue in $mn, 2016, Change in Revenue from 2016, Geography, Key Markets, Listed on, Products/Services)
Table 8.14 WesternGeco Marine Seismic Fleet (Vessel Name, Year Built or Last Upgraded, Metres Length, Metres Width, No of Streamers, Capability)
Table 8.15 WesternGeco Major Seismic Acquisition Contracts (Client Company, Area, Region, Contract Start, Contract End, Type, Average km/km2, Multi-Client)
Table 8.16 WesternGeco Total Company Sales 2011-2015 ($bn, AGR %)
Table 8.17 Mitcham Industries Profile (Market Entry, Public/Private, Headquarter, No. of Employees, Revenue in $mn, 2014, Change in Revenue from 2014, Geography, Key Markets, Listed on, Products/Services)
Table 8.18 Mitchan Industries Total Company Sales 2010-2014 ($mn, AGR %)
Table 8.19 Mitchan Industries Land Seismic Leasing Details (Category, Type, & Model)
Table 8.20 International Seismic Co. Profile (Market Entry, Public/Private, Headquarter, No. of Employees, Revenue in $mn, 2015, Change in Revenue from 2015, Geography, Key Markets, Listed on, Products/Services)
Table 8.21 iSeis-Seismic Source Co. Seismic Acquisition Details
Table 8.22 ION Geophysical Corporation Profile (Market Entry, Public/Private, Headquarter, No. of Employees, Revenue in $mn, 2016, Change in Revenue from 2015, Geography, Key Markets, Listed on, Products/Services)
Table 8.23 ION Geophysical Corporation Total Company Sales 2010-2014 ($mn, AGR %)
Table 8.24 ION Geophysical Corporation Seismic Acquisition Details, (Type, Model, & Description)
Table 8.25 Geometrics Profile (Market Entry, Public/Private, Headquarter, No. of Employees, Revenue in $mn, 2016, Change in Revenue from 2015, Geography, Key Markets, Listed on, Products/Services)
Table 8.26 Geometrics Seismic Acquisition Equipment Details
Table 8.27 Geospace Technologies Profile (Market Entry, Public/Private, Headquarter, No. of Employees, Revenue in $mn, 2016, Change in Revenue from 2016, Geography, Key Markets, Listed on, Products/Services)
Table 8.28 Geospace Technologies Total Company Sales 2012-2016 ($mn, AGR %)
Table 8.29 Geospace Technologies Seismic Acquisition Details
Table 8.30 INOVA Technologies Profile (Market Entry, Public/Private, Headquarter, No. of Employees, Revenue in $mn, 2016, Change in Revenue from 2015, Geography, Key Markets, Listed on, Products/Services)
Table 8.31 INOVA Geophysical Land Seismic Acquisition Details
Table 8.32 PASI srl Technologies Profile (Market Entry, Public/Private, Headquarter, No. of Employees, Revenue in $mn, 2016, Change in Revenue from 2015, Geography, Key Markets, Listed on, Products/Services)
Table 8.33 PASI srl Geophysical Land Seismic Acquisition Details
Table 8.34 ARGAS Profile (Market Entry, Public/Private, Headquarter, No. of Employees, Revenue in $mn, 2015, Change in Revenue from 2014, Geography, Key Markets, Listed on, Products/Services)
Table 8.35 ARGAS Land Seismic Projects
Table 8.36 BGP Inc. Profile (Market Entry, Public/Private, Headquarter, No. of Employees, Revenue in $mn, 2015, Change in Revenue from 2014, Geography, Key Markets, Listed on, Products/Services)
Table 8.37 BGP Inc. Seismic Services (Service, Model, Description)
Table 8.38 BGP Inc. Manufactured Equipment (Model, Description, Features)
Table 8.39 Baoding Longet Equipment Co., Ltd. (Market Entry, Public/Private, Headquarter, No. of Employees, Revenue in $mn, 2015, Change in Revenue from 2014, Geography, Key Markets, Listed on, Products/Services)
Table 8.40 Boading Longet Seismic Acquisition Equipment
Table 8.41 CGG Profile (Market Entry, Public/Private, Headquarter, No. of Employees, Revenue in $mn, 2015, Change in Revenue from 2014, Geography, Key Markets, Listed on, Products/Services)
Table 8.42 Geokinetics Profile (Market Entry, Public/Private, Headquarter, No. of Employees, Revenue in $mn, 2015, Change in Revenue from 2014, Geography, Key Markets, Listed on, Products/Services)
Table 8.43 Geokinetics Services (Service, Type, & Description)
Table 8.44 List of Other Land Seismic Companies
List of Figures
Figure 1.1 The Land Seismic Acquisition Market by Country Market Share Forecast 2018, 2023, 2028 (% Share)
Figure 2.1 Global Land Seismic Equipment Market Segmentation Overview
Figure 2.2 Global Land Seismic Acquisition Market Segmentation Overview
Figure 3.1 Global Land Seismic Equipment Forecast 2018-2028 ($ mn, AGR %)
Figure 3.2 Global Land Seismic Acquisition Forecast 2018-2028 ($ mn, AGR %)
Figure 3.3 Land Seismic Equipment vs Acquisition Market Share Forecast 2018, 2023, 2028 (% Share)
Figure 4.1 Global Land Seismic Equipment Submarket Forecast 2018-2028 ($mn, AGR%)
Figure 4.2 Global Land Seismic Equipment Market by Type Share Forecast 2018, 2023, 2028 (% Share)
Figure 4.3 Land Seismic Equipment Market, By Sensors Forecast 2018-2028 ($mn, AGR%)
Figure 4.4 Land Seismic Equipment Market, By Sources Forecast 2018-2028 ($mn, AGR%)
Figure 4.5 Land Seismic Equipment Market, By Cable Based Acquisition Systems Forecast 2018-2028 ($mn, AGR%)
Figure 4.6 Land Seismic Equipment Market, By Wireless Acquisition System Forecast 2018-2028 ($mn, AGR%)
Figure 4.7 Land Seismic Equipment Market, By Other Equipment Forecast 2018-2028 ($mn, AGR%)
Figure 5.1 Regional Land Seismic Acquisition Market
Figure 5.2 Leading Nations Land Seismic Acquisition Market Share, 2018
Figure 5.3 Leading Nations Land Seismic Acquisition Market Share, 2023
Figure 5.4 Leading Nations Land Seismic Acquisition Market Share, 2028
Figure 5.5 Global Land Seismic Acquisition Market, Market Attractiveness, 2018, By Region
Figure 5.6 North America Land Seismic Acquisition Market Forecast 2018-2028 ($mn, AGR %)
Figure 5.7 North America Land Seismic Acquisition Market Share Forecast 2018, 2023, 2028 (% Share)
Figure 5.8 North America Land Seismic Acquisition Market Forecast, by Country, 2018-2028 ($mn)
Figure 5.9 Asia Pacific Land Seismic Acquisition Market Forecast 2018-2028 ($mn, AGR %)
Figure 5.10 Asia Pacific Land Seismic Acquisition Market Share Forecast 2018, 2023, 2028 (% Share)
Figure 5.11 Asia Pacific Land Seismic Acquisition Market Forecast, by Country, 2018-2028 ($mn)
Figure 5.12 Middle East Land Seismic Acquisition Market Forecast 2018-2028 ($mn, AGR %)
Figure 5.13 Middle East Land Seismic Acquisition Market Share Forecast 2018, 2023, 2028 (% Share)
Figure 5.14 Middle East Land Seismic Acquisition Market Forecast, by Country, 2018-2028 ($mn)
Figure 5.15 Russia/CIA Land Seismic Acquisition Market Forecast 2018-2028 ($mn, AGR %)
Figure 5.16 Russia/CIA Land Seismic Acquisition Market Share Forecast 2018, 2023, 2028 (% Share)
Figure 5.17 Africa Land Seismic Acquisition Market Forecast 2018-2028 ($mn, AGR %)
Figure 5.18 Africa Land Seismic Acquisition Market Share Forecast 2018, 2023, 2028 (% Share)
Figure 5.19 Africa Land Seismic Acquisition Market Forecast, by Country, 2018-2028 ($mn)
Figure 5.20 South America Land Seismic Acquisition Market Forecast 2018-2028 ($mn, AGR %)
Figure 5.21 South America Land Seismic Acquisition Market Share Forecast 2018, 2023, 2028 (% Share)
Figure 5.22 South America Land Seismic Acquisition Market Forecast, by Country, 2018-2028 ($mn)
Figure 5.23 Europe Land Seismic Acquisition Market Forecast 2018-2028 ($mn, AGR %)
Figure 5.24 Europe Land Seismic Acquisition Market Share Forecast 2018, 2023, 2028 (% Share)
Figure 5.25 Europe Land Seismic Acquisition Market Forecast, by Country, 2018-2028 ($mn)
Figure 8.1 Tesla Exploration Ltd., % Revenue Share, by Business Segment, 2015
Figure 8.2 Tesla Exploration Ltd., % Revenue Share, by Geographic Segment, 2015
Figure 8.3 SAExploration, % Revenue Share, by Regional Segment, 2016
Figure 8.4 SAExploration, % Revenue Share, by Country Segment, 2016
Figure 8.5 WesternGeco, Revenue, ($bn& AGR %), 2011-2015
Figure 8.6 WesternGeco Revenue %Share, by Business Segment, 2015
Figure 8.7 WesternGeco Revenue %Share, by Regional Segment, 2015
Figure 8.8 Mitchan Industries Revenue %Share, by Regional Segment, 2014
Figure 8.9 Mitchan Industries Revenue %Share, by Business Segment, 2014
Figure 8.10 Mitchan Industries Revenue, ($mn & AGR %), 2010-2015
Figure 8.11 ION Geophysical Corporation Revenue %Share, by Sales Type Segment, 2016
Figure 8.12 ION Geophysical Corporation Revenue %Share, by Business Segment, 2016
Figure 8.13 ION Geophysical Corporation Revenue %Share, by Regional Segment, 2016
Figure 8.14 ION Geophysical Corporation Revenue, ($mn & AGR %), 2014-2016
Figure 8.15 Geospace Technologies Revenue %Share, by Business Segment, 2016
Figure 8.16 Geospace Technologies Revenue %Share, Seismic vs Non-Seismic, 2016
Figure 8.17 Geospace Technologies Revenue %Share, by Regional Segment, 2016
Figure 8.18 Geospace Technologies Revenue, ($mn & AGR %), 2012-2016
Figure 9.1 Global Land Seismic Acquisition Market Forecast 2018-2028 ($ mn, AGR %)
Figure 9.2 Global Marine Seismic Equipment Submarket Forecast 2018-2028 ($mn, AGR%)