This latest report by business intelligence provider Visiongain assesses that marine seismic equipment and acquisition market will reach $5.01bn in 2018. This report will be of value to anyone who wants to better understand the sector and its dynamics. It will be useful for stakeholders already involved in the marine seismic sector, or for those wishing to understand and appreciate the trajectory and state-of-play of a sector of growing importance to the global energy industry. It is therefore critical that you have your timescales correct and your forecasting plans ready. This report will ensure that you do. Visiongain’s report will ensure that you keep informed and ahead of your competitors. Gain that competitive advantage.
The Marine Seismic Market Forecast 2018-2028 responds to your need for definitive market data.
Read on to discover how you can exploit the future business opportunities emerging in this sector. Visiongain’s new study tells you and tells you NOW.
In this brand-new report, you find 154 in-depth tables, charts and graphs all unavailable elsewhere.
The 214-page report provides clear detailed insight into the global marine seismic market. Discover the key drivers and challenges affecting the market.
By ordering and reading our brand-new report today you stay better informed and ready to act.
Report Scope
The report delivers considerable added value by revealing:
• 214 tables, charts and graphs analysing and revealing the growth prospects and outlook for the Marine Seismic.
• Marine seismic market forecasts and analysis from 2018-2028.
• Marine seismic equipment market provides forecast from 2018-2028 for:
• 3D Seismic Vessels and Equipment.
• Seismic Streamers and Associated Command and Control Systems.
• 4C Seismic Equipment.
• Seismic Sources and Associated Coordination Systems.
• 2D Seismic Vessels and Equipment.
• Marine seismic acquisition market provides forecast from 2018-2028 for:
• Multi-Client Seismic Acquisition
• Proprietary Seismic Acquisition
• 3D Seismic Acquisition (3D, 4D, WAZ)
• Ocean-Bottom Seismic (OBS) Acquisition (3C, 4C, PRM)
• 2D Seismic Acquisition
• Shallow Water Data Acquisition
• Deep Water Data Acquisition
• Ultra-deep Data Acquisition
• Marine Seismic Equipment and Acquisition Market Forecasts from 2018-2028 for the regions including:
• Asia Pacific
• Europe which also includes a specific focus on Russia
• Africa
• North America
• South America
• Middle East
• Company profiles for the leading 10 Marine Seismic companies
• CGG
• Fugro
• Geo Marine Survey Systems
• Mitcham Industries
• PGS
• Polarcus Ltd
• Seabird Exploration Group
• Seismic Equipment
• TGS
• WesternGeco
• The Company profiles include
• Marine Seismic Fleet Information such as Vessel Name, Year Built or Last Upgraded, Metres Length, Metres Width, No of Streamers, Capability
• Major Seismic Acquisition Contracts Information such as Client Company, Area, Region, Contract Start, Contract End, Type, Average km/km2, Multi Client.
• Conclusions and recommendations which will aid decision-making
How will you benefit from this report?
• Keep your knowledge base up to speed. Don’t get left behind
• Reinforce your strategic decision-making with definitive and reliable market data
• Learn how to exploit new technological trends
• Realise your company’s full potential within the market
• Understand the competitive landscape and identify potential new business opportunities & partnerships
Who should read this report?
• Anyone within the marine seismic value chain
• Seismic vessel operators
• Multi-client survey companies
• Oil and gas companies with upstream operations
• Fund managers for energy practices at banks
• Energy practice legal professionals
• Seismic vessel constructors
• Marine seismic equipment manufacturers
• Seismic data processing companies,
• FPSO providers,
• Mobile offshore drilling unit providers,
• Engineering companies
• Geologists
• Business development managers
• Marketing managers
• Technologists
• Suppliers
• Investors
• Banks
• Government agencies
• Contractors
Visiongain’s study is intended for anyone requiring commercial analyses for the marine seismic market and leading companies. You find data, trends and predictions.
Buy our report today the Marine Seismic Equipment & Acquisition Market Forecast 2018-2028: CAPEX Forecasts for Seismic Equipment (2D, 3D, Seismic Streamers and Associated Command and Control Systems, Seismic Sources and Associated Coordination Systems, 4C) with Revenue Forecasts for Acquisition by Contract (Proprietary & Multi Client Acquisition), Type (2D, 3D & OBS) and by Water Depth (Shallow Water, Deep water & Ultra-deep) Plus Market Share Analysis of Leading Companies and Regional Market Analysis. Avoid missing out by staying informed – get our report now.
Visiongain is a trading partner with the US Federal Government
CCR Ref number: KD4R6
1. Report Overview
1.1 Marine Seismic Equipment & Acquisition Market Overview
1.2 Market Structure Overview and Market Definition
1.3 Why You Should Read This Report
1.4 How This Report Delivers
1.5 Key Questions Answered by This Analytical Report Include:
1.6 Who is This Report For?
1.7 Methodology
1.7.1 Primary Research
1.7.2 Secondary Research
1.7.3 Market Evaluation & Forecasting Methodology
1.8 Frequently Asked Questions (FAQ)
1.9 Associated Visiongain Reports
1.10 About Visiongain
2. Introduction to the Marine Seismic Equipment & Acquisition Market
2.1 The Marine Seismic Equipment Market Structure
2.2 Marine Seismic Equipment & Acquisition Market Definition
2.3 Marine Seismic Industry Outlook
2.4 Different Type of Seismic Equipment & Acquisition
2.4.1 2D Seismic Equipment & Acquisition
2.4.2 3D Seismic Equipment & Acquisition
2.4.3 4D Seismic Acquisition
2.4.4 Wise Azimuth & Rich Azimuth Marine Seismic Acquisition
2.4.5 3C & 4C Marine Seismic Equipment Acquisition
2.4.6 Marine Seismic Sources & Source Vessels
2.4.7 Marine Seismic Sensors, Streamers & Ocean Bottom Methods
2.5 Shallow Water Transition Zone (SWTZ) Marine Seismic
2.6 Deepwater & Ultra Deepwater Marine Seismic
2.7 Marine Seismic Support Vessels
2.8 Exploration Phase Seismic versus Production-Phase Seismic
2.9 Multi-Client Seismic Services (MCS)
3. Global Overview of Marine Seismic Equipment & Acquisition Market
3.1 Global Overview of Marine Seismic Equipment Market
3.1.1 Factors Affecting Supply-Side
3.1.1.1 Tight Oil
3.1.1.2 OPEC
3.1.2 Factors Affecting Demand-Side
3.1.2.1 Chinese and Indian Growth
3.1.2.2 Western Stagnation
3.1.3 Other Impacts Affecting the Marine Seismic Equipment Market Growth
3.1.3.1 North Africa
3.1.3.2 Russia
3.1.3.3 US Shale
3.1.3.4 Iraq
3.1.3.5 Kuwait
3.1.3.6 International Incidents
3.1.3.7 Iran
3.2 Global Overview of Marine Seismic Acquisition Market
3.3 Marine Seismic and Equipment & Acquisition Driver and Restraints
4. Marine Seismic Equipment & Acquisition Submarkets Forecasts 2018-2028
4.1 Global Marine Seismic Equipment Market Forecasts by Type 2018-2028
4.1.1 Global 3D Seismic Vessels and Equipment Forecasts 2018-2028
4.1.1.2 3D Seismic Vessels and Equipment Driver and Restraints
4.1.2 Global Seismic Streamers and Associated Command and Control Systems Forecasts 2018-2028
4.1.2.2 Seismic Streamers and Associated Command and Control Systems Driver and Restraints
4.1.3 Global Seismic Sources and Associated Coordination Systems Forecasts 2018-2028
4.1.3.1 Seismic Streamers and Associated Command and Control Systems Driver and Restraints
4.1.4 Global 4C Seismic Equipment Forecasts 2018-2028
4.1.4.1 4C Seismic Equipment Driver and Restraints
4.1.5 Global 2D Seismic Vessels and Equipment Forecasts 2018-2028
4.1.5.1 2D Seismic Vessels and Equipment Driver and Restraints
4.2 Global Marine Seismic Acquisition Market Forecasts by Contract 2018-2028
4.2.1 Global Multi-Client Seismic Acquisition Marine Seismic Acquisition Forecasts 2018-2028
4.2.2 Global Proprietary Seismic Acquisition Market Forecasts 2018-2028
4.3 Global Marine Seismic Acquisition Market Forecast by Type 2018-2028
4.3.1 Global 3D Seismic Acquisition Forecasts 2018-2028
4.3.2 Global OBS Marine Seismic Acquisition Forecasts 2018-2028
4.3.3 Global 2D Seismic Acquisition Marine Seismic Acquisition Forecasts 2018-2028
4.4 Global Marine Seismic Acquisition Markets by Water Depth Forecasts 2018-2028
4.4.1 Global Shallow Water Seismic Acquisition Forecasts 2018-2028
4.4.2 Global Deep Water Marine Seismic Acquisition Forecasts 2018-2028
4.4.3 Global Ultra-deep Water Seismic Acquisition Marine Seismic Acquisition Forecasts 2018-2028
5. Leading Regional Market Forecasts 2018-2028
5.1 Marine Seismic Acquisition Market Attractiveness Analysis
5.2 Asia Pacific Marine Seismic Acquisition Market Forecast 2018-2028
5.2.1 Asia Pacific Marine Seismic Acquisition Market Forecast
5.3 Europe Marine Seismic Acquisition Market Forecast 2018-2028
5.3.1 Europe Marine Seismic Acquisition Market Forecast
5.3.2 Russia Marine Seismic Acquisition Market Forecast 2018-2028
5.3.2.1 Russia Marine Seismic Acquisition Market Forecast
5.4 Africa Marine Seismic Acquisition Market Forecast 2018-2028
5.4.1 Africa Marine Seismic Acquisition Market Forecast
5.5 North America Marine Seismic Acquisition Market Forecast 2018-2028
5.5.1 North America Marine Seismic Acquisition Market Forecast
5.6 South America Marine Seismic Acquisition Market Forecast 2018-2028
5.6.1 South America Marine Seismic Acquisition Market Forecast
5.7 Middle East Marine Seismic Acquisition Market Forecast 2018-2028
5.7.1 Middle East Marine Seismic Acquisition Market Forecast
6. PEST Analysis of the Marine Seismic Equipment & Acquisition Market
7. Expert Opinion
7.1 Primary Correspondents
7.2 Marine Seismic Equipment & Acquisition Outlook
7.3 Driver & Restraints
7.4 Dominant Region/Country
7.5 Marine Seismic Equipment Sales/Rental Scenario
7.6 Marine Seismic Acquisition Scenario
7.7 Global Overall Growth Rate
8. Leading Companies in the Marine Seismic Equipment & Acquisition Market 2018
8.1 Seabird Exploration Group
8.1.1 Seabird Exploration Group Analysis
8.1.2 Seabird Exploration Group’s Revenue Analysis
8.2 CGG
8.2.1 CGG Company Analysis
8.2.2 CGG Company Outlook
8.2.3 CGG Vessels
8.2.4 CGG’s Revenue Analysis
8.3 PGS
8.3.1 PGS Company Analysis
8.3.2 PGS Revenue Analysis
8.4 Schlumberger (WesternGeco)
8.4.1 Schlumberger Analysis
8.4.2 Schlumberger Revenue Analysis
8.5 Polarcus Limited
8.5.1 Polarcus Outlook
8.5.2 Polarcus Revenue Analysis
8.6 TGS
8.6.1 TGS Analysis
8.6.2 TGS Revenue Analysis
8.7 Fugro
8.7.1 Fugro Analysis
8.7.2 Fugro Vessels
8.7.3 Fugro Revenue Analysis
8.8 Geo Marine Survey Systems
8.8.1 Geo Marine Survey Systems Analysis
8.8.2 Geo Marine Survey Systems Outlook
8.9 Seismic Equipment Solutions
8.9.1 Seismic Equipment Solutions Analysis
8.9.2 Seismic Equipment Solutions Outlook
8.10 Mitcham Industries, Inc.
8.10.1 Mitcham Industries, Inc. Analysis.
8.10.2 Mitcham Industries, Inc. Revenue Analysis
8.11 Global Marine Seismic Equipment & Acquisition Market Company Market Share 2017 (%)
9. Conclusion & Recommendations
9.1 Global Marine Seismic Equipment & Acquisition Market Outlook
9.2 Recommendations
10. Glossary
Associated Visiongain Reports
Visiongain Report Sales Order Form
Appendix A
About Visiongain
Appendix B
Visiongain report evaluation form
List of Figures
Figure 1.1 The Marine Seismic Acquisition Market by Country/Region Market Share Forecast 2018, 2023, 2028 (% Share)
Figure 2.1 Global Marine Seismic Equipment Market Segmentation Overview
Figure 2.2 Global Marine Seismic Acquisition Market Segmentation Overview
Figure 2.3 Marine Seismic Towed Streamer
Figure 3.1 Global Marine Seismic Equipment Forecast 2018-2028 ($ mn, AGR %)
Figure 3.2 Global Marine Seismic Acquisition Forecast 2018-2028 ($ mn, AGR %)
Figure 3.2 Marine Seismic Equipment vs Acquisition Market Share Forecast 2018, 2023, 2028 (% Share)
Figure 4.1 Global Marine Seismic Equipment Market Forecast 2018-2028 ($mn)
Figure 4.2 Global Marine Seismic Equipment Market by Sector Share Forecast 2018, 2023, 2028 (% Share)
Figure 4.3 3D Seismic Vessels and Equipment Forecast 2018-2028 ($mn, AGR%)
Figure 4.4 Seismic Streamers and Associated Command and Control Systems Forecast 2018-2028 ($mn, AGR%)
Figure 4.5 Seismic Sources and Associated Coordination Systems Forecast 2018-2028 ($mn, AGR%)
Figure 4.6 Global 4C Seismic Equipment Forecast 2018-2028 ($mn, AGR%)
Figure 4.7 Global 2D Seismic Vessels and Equipment Market Forecast 2018-2028 ($mn, AGR%)
Figure 4.8 Global Marine Seismic Acquisition Market Forecast 2018-2028 by Contract ($mn)
Figure 4.9 Global Marine Seismic Acquisition Market by Contract Share Forecast 2018, 2023, 2028 (% Share)
Figure 4.10 Multi-Client Seismic Acquisition Forecast 2018-2028 ($mn, AGR%)
Figure 4.11 Proprietary Seismic Acquisition Forecast 2018-2028 ($mn, AGR%)
Figure 4.12 Global Marine Seismic Acquisition Market Forecast 2018-2028 by Type ($mn)
Figure 4.13 Global Marine Seismic Acquisition Market by Type Share Forecast 2018, 2023, 2028 (% Share)
Figure 4.14 Global 3D Seismic Acquisition Market Forecast 2018-2028 ($mn, AGR%)
Figure 4.15 Global OBS Marine Seismic Acquisition Market Forecast 2018-2028 ($mn, AGR%)
Figure 4.16 2D Marine Seismic Acquisition Market Forecast 2018-2028 ($mn, AGR%)
Figure 4.17 Global Marine Seismic Acquisition Market Forecast by Water Depth 2018-2028 ($mn)
Figure 4.18 Global Marine Seismic Acquisition Market by Water Depth Share Forecast 2018, 2023, 2028 (% Share)
Figure 4.19 Shallow Water Marine Seismic Acquisition Market Forecast 2018-2028 ($mn, AGR%)
Figure 4.20 Deep Water Marine Seismic Acquisition Market Forecast 2018-2028 ($mn, AGR%)
Figure 4.21 Ultra-deep Water Marine Seismic Acquisition Market Forecast 2018-2028 ($mn, AGR%)
Figure 5.1 Regional Marine Seismic Acquisition Market Forecast 2018-2028 ($mn)
Figure 5.2 Leading Regional Marine Seismic Acquisition Market Share 2018 (%)
Figure 5.3 Leading Regional Marine Seismic Acquisition Market Share 2023 (%)
Figure 5.4 Leading Regional Marine Seismic Acquisition Market Share 2028 (%)
Figure 5.5 Global Marine Seismic Acquisition Market Attractiveness by Region
Figure 5.6 Asia Pacific Marine Seismic Acquisition Market Forecast 2018-2028 ($mn, AGR %)
Figure 5.7 Asia Pacific Marine Seismic Acquisition Market Share Forecast 2018, 2023, 2028 (% Share)
Figure 5.8 Europe Marine Seismic Acquisition Market Forecast 2018-2028 ($mn, AGR %)
Figure 5.9 Europe Marine Seismic Acquisition Market Share Forecast 2018, 2023, 2028 (% Share)
Figure 5.10 Russia Marine Seismic Acquisition Market Forecast 2018-2028 ($mn, AGR %)
Figure 5.11 Russia Marine Seismic Acquisition Market Share Forecast 2018, 2023, 2028 (% Share)
Figure 5.12 Africa Marine Seismic Acquisition Market Forecast 2018-2028 ($mn, AGR %)
Figure 5.13 Africa Marine Seismic Acquisition Market Share Forecast 2018, 2023, 2028 (% Share)
Figure 5.14 North America Marine Seismic Acquisition Market Forecast 2018-2028 ($mn, AGR %)
Figure 5.15 North America Marine Seismic Acquisition Market Share Forecast 2018, 2023, 2028 (% Share)
Figure 5.16 South America Marine Seismic Acquisition Market Forecast 2018-2028 ($mn, AGR %)
Figure 5.17 South America Marine Seismic Acquisition Market Share Forecast 2018, 2023, 2028 (% Share)
Figure 5.18 Middle East Marine Seismic Acquisition Market Forecast 2018-2028 ($mn, AGR %)
Figure 5.19 Middle East Marine Seismic Acquisition Market Share Forecast 2018, 2023, 2028 (% Share)
Figure 8.1 Seabird Exploration Group Total Company Revenues 2013-2017 ($mn, AGR %)
Figure 8.2 Seabird Exploration Group Revenue by Regions 2017 (% Share)
Figure 8.3 Seabird Exploration Group Revenue by Business Segment 2017 (% Share)
Figure 8.4 CGG Total Company Revenue 2013-2017 ($bn, AGR %)
Figure 8.5 CGG Revenue by Regional Segments 2017 (% Share)
Figure 8.6 CGG Revenue by Business Segment 2017 (% Share)
Figure 8.7 CGG Revenue by Client Type 2017 (% Share)
Figure 8.8 CGG Current Fleet Status 2018
Figure 8.9 PGS Revenue by Business Segment 2017 (% Share)
Figure 8.10 PGS Revenue by Regional Segment 2017 (% Share)
Figure 8.11 PGS Revenue 2013-2017 ($mn, AGR %)
Figure 8.12 Schlumberger Revenue 2013-2017 ($bn, AGR %)
Figure 8.13 Schlumberger Revenue by Business Segment 2017 Excluding Eliminations & Others (%Share)
Figure 8.14 Schlumberger Revenue by Regional Segment 2017 (%Share)
Figure 8.15 Polarcus Total Company Revenue 2013-2017 ($mn, AGR %)
Figure 8.16 Polarcus Limited Revenue by Regional Segment 2017
(% Share)
Figure 8.17 Polarcus Limited Revenue by Business Segment 2017 (% Share)
Figure 8.18 TGS Revenue by Regional Segment 2017 (%Share)
Figure 8.19 TGS Revenue by Seismic Survey 2017 (% Share)
Figure 8.20 TGS Revenue by Acquisition 2017 (% Share)
Figure 8.21 TGS Revenue 2013-2017 ($m, AGR %)
Figure 8.22 Fugro Revenue by Business Segment 2017 (% Share)
Figure 8.23 Fugro Revenue by Regional Segment 2017 (% Share)
Figure 8.24 Fugro Revenue by Market Segment 2017 (% Share)
Figure 8.25 Fugro Revenue by Client Type 2017 (% Share)
Figure 8.21 Fugro Revenue 2013-2017 ($mn, AGR %)
Figure 8.26 Mitcham Industries, Inc. Revenue by Business Segment 2017 (% Share)
Figure 8.27 Mitcham Industries, Inc. Revenue by Regional Segment 2017 (% Share)
Figure 8.28 Mitcham Industries, Inc. Revenue 2013-2017 ($mn, AGR %)
Figure 8.29 Leading Companies Market Share 2017 for Marine Seismic Equipment & Acquisition Market
Figure 9.1 Global Marine Seismic Acquisition Market Forecast 2018-2028 ($mn, AGR %)
Figure 9.2 Global Marine Seismic Equipment Market Forecast 2018-2028 ($mn, AGR%)
List of Tables
Table 1.1 The Marine Seismic Acquisition Market by Regional Market Forecast 2018-2028 ($bn, AGR %, Cumulative)
Table 3.1 Global Marine Seismic Equipment Market Forecast 2018-2028 ($ mn, AGR %, CAGR %, Cumulative)
Table 3.2 Global Marine Seismic Acquisition Market Forecast 2018-2028
($ mn, AGR %, CAGR %, Cumulative)
Table 3.3 Global Marine Seismic Equipment & Acquisition Drivers and Restraints
Table 4.1 Global Marine Seismic Equipment Market Forecast 2018-2028 ($mn, AGR %, Cumulative)
Table 4.2 Global 3D Seismic Vessels and Equipment Forecast 2018-2028 ($mn, AGR %, CAGR %, Cumulative)
Table 4.3 3D Seismic Vessels and Equipment Drivers and Restraints
Table 4.4 Global Seismic Streamers and Associated Command and Control Systems Forecast 2018-2028 ($mn, AGR %, CAGR %, Cumulative)
Table 4.5 Seismic Streamers and Associated Command and Control Systems Drivers and Restraints
Table 4.6 Global Seismic Sources and Associated Coordination Systems Forecast 2018-2028 ($mn, AGR %, CAGR %, Cumulative)
Table 4.7 Seismic Streamers and Associated Command and Control Systems Type Submarket Drivers and Restraints
Table 4.8 Global 4C Seismic Equipment Forecast 2018-2028 ($mn, AGR %, CAGR %, Cumulative)
Table 4.9 4C Seismic Equipment Drivers and Restraints
Table 4.10 Global 2D Seismic Vessels and Equipment Market Forecast 2018-2028 ($mn, AGR %, CAGR %, Cumulative)
Table 4.11 2D Seismic Vessels and Equipment Type Market Drivers and Restraints
Table 4.12 Global Marine Seismic Fleet (Vessel Name, Operator, Year Built or Last Upgraded, Length (meters), Width (meters), No of Streamer, 2D, 3D, 4C/4D)
Table 4.13 Global Marine Seismic Acquisition Market Forecast 2018-2028 by Contract ($mn, AGR %, Cumulative)
Table 4.14 Global Multi-Client Seismic Acquisition Market Forecast 2018-2028 ($mn, AGR %, CAGR %, Cumulative)
Table 4.15 Global Proprietary Seismic Acquisition Market Forecast 2018-2028 ($mn, AGR %, CAGR %, Cumulative)
Table 4.16 Major Seismic Acquisition Contracts (Company Awarded, Client Company, Area, Region, Contract Start, Contract End, Type, Acreage, Multi-Client)
Table 4.17 Global Marine Seismic Acquisition Market Forecast by Type 2018-2028 ($mn, AGR %, Cumulative)
Table 4.18 Global 3D Marine Seismic Acquisition Market Forecast 2018-2028 ($mn, AGR %, CAGR %, Cumulative)
Table 4.19 Global OBS Marine Seismic Acquisition Market Forecast 2018-2028 ($mn, AGR %, CAGR %, Cumulative)
Table 4.20 Global 2D Marine Seismic Acquisition Market by Forecast 2018-2028 ($mn, AGR %, CAGR %, Cumulative)
Table 4.21 Global Marine Seismic Acquisition Market Forecast by Water Depth 2018-2028 ($mn, AGR %, Cumulative)
Table 4.22 Global Shallow Water Marine Seismic Acquisition Market by Forecast 2018-2028 ($mn, AGR %, CAGR %, Cumulative)
Table 4.23 Global Deep Water Marine Seismic Acquisition Market Forecast 2018-2028 ($mn, AGR %, CAGR %, Cumulative)
Table 4.24 Global Ultra-deep Water Marine Seismic Acquisition Market Forecast 2018-2028 ($mn, AGR %, CAGR %, Cumulative)
Table 5.1 Global Marine Seismic Acquisition Market Forecast by Region 2018-2028 ($mn, AGR %, Cumulative)
Table 5.2 Asia Pacific Marine Seismic Acquisition Market Forecast 2018-2028 ($mn, AGR %, CAGR%, Cumulative)
Table 5.3 Asian Pacific Major Seismic Acquisition Contracts (Company Awarded, Client Company, Area, Contract Start, Contract End, Type, Acreage, Multi Client)
Table 5.4 Europe Marine Seismic Acquisition Market Forecast 2018-2028
($ mn, AGR %, CAGR%, Cumulative)
Table 5.5 Europe Major Seismic Acquisition Contracts (Company Awarded, Client Company, Area, Contract Start, Contract End, Type, Acreage, Multi Client)
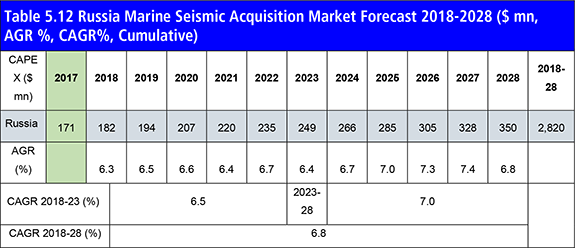
Table 5.6 Russia Marine Seismic Acquisition Market Forecast 2018-2028 ($ mn, AGR %, CAGR%, Cumulative)
Table 5.7 Africa Marine Seismic Acquisition Market Forecast 2018-2028 ($ mn, AGR %, CAGR%, Cumulative)
Table 5.8 Africa Pacific Major Seismic Acquisition Contracts (Company Awarded, Client Company, Area, Contract Start, Contract End, Type, Acreage, Multi Client)
Table 5.9 North America Marine Seismic Acquisition Market Forecast 2018-2028 ($mn, AGR %, CAGR%, Cumulative)
Table 5.10 North America Major Seismic Acquisition Contracts (Company Awarded, Client Company, Area, Contract Start, Contract End, Type, Acreage, Multi Client)
Table 5.11 South America Marine Seismic Acquisition Market Forecast 2018-2028 ($ mn, AGR %, CAGR%, Cumulative)
Table 5.12 South America Major Seismic Acquisition Contracts (Company Awarded, Client Company, Area, Contract Start, Contract End, Type, Acreage, Multi Client)
Table 5.13 Middle East Marine Seismic Acquisition Market Forecast 2018-2028 ($ mn, AGR %, CAGR%, Cumulative)
Table 6.1 PEST Analysis of the Marine Seismic Equipment & Acquisition Market
Table 8.1 Seabird Exploration Group Profile 2017 (Market Entry, Public/Private, Headquarter, Total Company Sales $mn, Change in Revenue, Geography, Key Market, Listed on, Products/Services Strongest Business Region, Business Segment in the Market, Submarket Involvement, No. of Employees)
Table 8.2 Seabird Exploration Group Marine Seismic Fleet (Vessel Name, Year Built or Last Upgraded, Metres Length, Metres Width, No of Streamers, Capability)
Table 8.3 Seabird Exploration Group Major Seismic Acquisition Contracts (Client Company, Area, Region, Contract Start, Contract End, Type, Average km/km2, Multi Client)
Table 8.4 Seabird Exploration Group Total Company Revenue 2013-2017 ($mn, AGR %)
Table 8.5 CGG Profile 2017 (Market Entry, Public/Private, Headquarter, Total Company Sales $mn, Change in Revenue, Geography, Key Market, Listed On, Products/Services Strongest Business Region, Business Segment in the Market, Submarket Involvement, No. of Employees)
Table 8.6 CGG Major Seismic Acquisition Contracts (Client Company, Area, Region, Contract Start, Contract End, Type, Average km/km2, Multi Client)
Table 8.7 CGG Marine Seismic Fleet (Vessel Name, Year Built or Last Upgraded, Metres Length, Metres Width, No of Streamers, Capability)
Table 8.8 CGG Total Company Revenue 2013-2017 ($bn, AGR %)
Table 8.9 PGS 2017 (Market Entry, Public/Private, Headquarter, Total Company Sales $bn, Change in Revenue, Geography, Key Market, Listed on, Products/Services Strongest Business Region, Business Segment in the Market, Submarket Involvement, No. of Employees)
Table 8.10 PGS Marine Seismic Fleet (Vessel Name, Year Built or Last Upgraded, Metres Length, Metres Width, No of Streamers, capability)
Table 8.11 PGS Acquisition Contracts (Client Company, Area, Region, Contract Start, Contract End, Type, Average km/km2, Multi Client)
Table 8.12 PGS Total Company Revenue 2013-2017 ($mn, AGR %)
Table 8.13 Schlumberger Profile 2017 (Market Entry, Public/Private, Headquarter, Total Company Sales US $bn, Change in Revenue, Geography, Key Market, Listed on, Products/Services Strongest Business Region, Business Segment in the Market, Submarket Involvement, No. of Employees)
Table 8.14 Schlumberger Marine Seismic Fleet (Vessel Name, Year Built or Last Upgraded, Metres Length, Metres Width, No of Streamers, Capability)
Table 8.15 Schlumberger Major Seismic Acquisition Contracts (Client Company, Area, Region, Contract Start, Contract End, Type, Average km/km2, Multi Client)
Table 8.16 Schlumberger Total Company Revenue 2013-2017 ($bn, AGR %)
Table 8.17 Polarcus Limited Profile 2017 (Market Entry, Public/Private, Headquarter, Total Company Sales $mn, Change in Revenue, Geography, Key Market, Listed on, Products/Services Strongest Business Region, Business Segment in the Market, Submarket Involvement, No. of Employees)
Table 8.18 Polarcus Marine Seismic Fleet (Vessel Name, Year Built or Last Upgraded, Metres Length, Metres Width, No of Streamers, Capability)
Table 8.19 Polarcus Major Seismic Acquisition Contracts (Client Company, Area, Region, Contract Start, Contract End, Type, Average km/km2, Multi Client)
Table 8.20 Polarcus Total Company Revenue 2013-2017 ($mn, AGR %)
Table 8.21 TGS Company Profile 2017 (Market Entry, Public/Private, Headquarter, Total Company Sales $mn, Change in Revenue, Geography, Key Market, Listed on, Products/Services Strongest Business Region, Business Segment in the Market, Submarket Involvement, No. of Employees)
Table 8.22 TGS Total Company Revenue 2013-2017 ($mn, AGR %)
Table 8.23 TGS Major Seismic Acquisition Contracts (Client Company, Area, Regions, Contract Start, Contract End, Type, Average km/km2, Multi Client)
Table 8.24 Fugro Company Profile 2017 (Market Entry, Public/Private, Headquarter, Total Company Sales $mn, Change in Revenue, Geography, Key Market, Listed on, Products/Services Strongest Business Region, Business Segment in the Market, Submarket Involvement, No. of Employees)
Table 8.25 Fugro Total Company Revenue 2013-2017 ($mn, AGR %)
Table 8.26 Fugro Marine Seismic Fleet (Vessel Name, Year Built or Last Upgraded, Metres length, Metres Width, Weight Tonnes Vessel Type, Metres Beam)
Table 8.27 Geo Marine Survey Systems Profile 2017 (Market Entry, Public/Private, Headquarter, Total Company Sales $mn, Change in Revenue, Geography, Key Market, Listed on, Products/Services Strongest Business Region, Business Segment in the Market, Submarket Involvement, No. of Employees)
Table 8.28 Seismic Equipment Solutions Profile 2017 (Market Entry, Public/Private, Headquarter, Total Company Sales $bn, Change in Revenue, Geography, Key Market, Company Sales from Marine Seismic Equipment & Acquisition Market, Listed on, Products/Services Strongest Business Region, Business Segment in the Market, Submarket Involvement, No. of Employees)
Table 8.29 Mitcham Industries, Inc. Company Profile 2017 (Market Entry, Public/Private, Headquarter, Total Company Sales $mn, Change in Revenue, Geography, Key Market, Listed on, Products/Services Strongest Business Region, Business Segment in the Market, Submarket Involvement, No. of Employees)
Table 8.30 Mitcham Industries, Inc. Total Company Revenue 2012-2016 ($mn, AGR %)