This report provides analysis and evaluation of the current and potential economic burden of Rheumatoid Arthritis (RA) in the major regions of the world comprising North America, Europe (EU5), Asia-Pacific and BRIC markets. The report also outlines the historical and current healthcare status for the selected markets with respect to the expenditures and the health system that govern medical access. With the increased competition in the RA market resulting from the biosimilar race and new biologic entrants such as the JAK inhibitors and IL-6 inhibitors, payers now have the leverage to enact on the cost-containment of the drug category that has been experiencing high unit cost increases year after year. The blockbuster drugs of the anti-TNF category such as, Humira and Enbrel along with Remicade have been the market leaders in RA treatment since their launch however the rising biosimilars especially to Remicade and Enbrel are posing threats to their global market shares.
How this report will benefit you
Read on to discover how you can exploit the future business opportunities emerging in this sector.
In this brand new report you find 333-page report you will receive 53 tables and 88 figures – all unavailable elsewhere.
The 333-page report provides clear detailed insight into the Rheumatoid Arthritis Pricing, Reimbursement & Market Access. Discover the key drivers and challenges affecting the market.
By ordering and reading our brand new report today you stay better informed and ready to act.
Report Scope
• Provides a brief history of rheumatoid arthritis, treatment options, marketed drugs and pipeline products.
• Discusses the global pricing & reimbursement for therapeutic drugs, factors affecting pricing & reimbursement, price negotiations & discounts and reimbursement policies.
• Discusses Health Economics and Outcomes Research (HEOR), Economic Value Planning, Cost-Effectiveness analysis as well as patent expiry and effects on pricing.
• Discusses Health Technology Assessment (HTA) in market access, key benefits of HTA, HTA regulatory agencies.
• Discusses the healthcare system, healthcare expenditure, key formularies, role of pharmacists, regulatory & approval process, pricing & reimbursement process, HTA, cost of rheumatoid arthritis treatment and payer insight, of these national markets:
• The US
• Canada
• United Kingdom
• Germany
• France
• Italy
• Spain
• Japan
• Australia
• Brazil
• Russia
• India
• China
• Discusses parallel import in the US and Europe
Visiongain’s study is intended for anyone requiring commercial analyses for the Rheumatoid Arthritis Pricing, Reimbursement & Market Access. You find data, trends and predictions.
Buy our report today Rheumatoid Arthritis Pricing, Reimbursement & Market Access 2018: US, Canada, UK, Germany, France, Italy, Spain, Japan, Australia, Brazil, Russia, China, India.
Visiongain is a trading partner with the US Federal Government
CCR Ref number: KD4R6
1. Report Overview
1.1 How This Study Delivers
1.2 Method of Research and Analysis
1.3 Frequently Asked Questions (FAQs)
1.4 Associated Visiongain Reports
1.5 About Visiongain
2. Market Overview
2.1. A Brief History of Rheumatoid Arthritis and Treatments
2.2. Rheumatoid Arthritis: Treatment and Prevention
2.3 Marketed RA drugs in Major Countries
2.4 Pipeline Products
3. Global Pricing & Reimbursement of Therapeutic Drugs
3.1 Factors Affecting Pricing & Reimbursement Decision
3.2 Price Negotiations & Discounts
3.3 Pricing of a New Drug
3.4 Reimbursement Policies
4. Economic Evaluations
4.1 Role of HEOR and Economic Value Planning
4.2 Overview of Cost-Effectiveness Analysis
4.3 Drug Patent Expiry & Effects on Pricing
5. Health Technology Assessment (HTA) in Market Access
5.1 Key Benefits of HTA and its Process
5.2 Principle HTA Regulatory Agencies
5.3 Case Study: Brief About United Kingdom’s NICE
6. Global Pharmaceutical Market Dynamics
6.1. United States (U.S.)
6.1.1. U.S. Healthcare System
6.1.1.1 Healthcare Expenditure
6.1.1.2. Key Formularies
6.1.1.3. Role of Pharmacists in U.S. Healthcare System
6.1.1.4. Regulatory and Approval Process
6.1.2. Pricing & Reimbursement Process and HTA
6.1.3. Rheumatoid Arthritis Cost of Treatment in United States
6.1.4. United States’ Payer Insights
6.1.5. Features of RA in United States
6.2 Canada
6.2.1. Canada Healthcare System
6.2.1.1. Healthcare Expenditure:
6.2.1.2. Health Coverage:
6.2.1.3. Key Formularies:
6.2.1.4. Role of Pharmacists in Canada Healthcare System
6.2.2 Pricing of Pharmaceuticals in Canada
6.2.2.1 Drug Pricing Amendment in Canada
6.2.2.2 Reimbursement in Canada
6.2.3 Health Technology Assessment
6.2.4 Rheumatoid Arthritis Cost of Treatment
6.2.5 Canada Payer Insight
6.2.6 Features of Canadian Health care for Rheumatoid Arthritis
6.3 Europe (EU5)
6.3.1 United Kingdom
6.3.1.1 United Kingdom Healthcare System
6.3.1.1.1. Healthcare Expenditure:
6.3.1.1.2. Health Coverage:
6.3.1.1.3. Key Formularies:
6.3.1.1.4. Role of Pharmacists in U.K. Healthcare System
6.3.1.2. Pricing & Reimbursement
6.3.1.2.1. Pricing of Pharmaceuticals in the U.K.
6.3.1.2.2. Reimbursement of Pharmaceuticals in the U.K.
6.3.1.3. Health Technology Assessment
6.3.1.4. Rheumatoid Arthritis Cost of Treatment
6.3.1.5. U.K. Payer Insight
6.3.1.6. Features of Rheumatoid Arthritis in U.K.
6.3.2 Germany
6.3.2.1 Germany Healthcare System
6.3.2.1.1 Key Organizations in German Healthcare System
6.3.2.1.2 Healthcare Expenditure:
6.3.2.1.3 Health Coverage:
6.3.2.1.4. Key Formularies:
6.3.2.1.5. Role of Pharmacists in German Healthcare System
6.3.2.2. Pricing & Reimbursement
6.3.2.3. Health Technology Assessment
6.3.2.3.1 Regulatory & Approval Process
6.3.2.4. Rheumatoid Arthritis Cost of Treatment in Germany
6.3.2.5. Cost of Treatment
6.3.2.6. Germany’s Payer Insights
6.3.2.7. Features of RA in Germany
6.3.3 France
6.3.3.1. France Healthcare System
6.3.3.1.1. Healthcare Expenditure
6.3.3.1.2. Health Coverage
6.3.3.1.3. Key formularies
6.3.3.1.4. Role of Pharmacists in France Healthcare System
6.3.3.2. Pricing & Reimbursement:
6.3.3.2.1. Reimbursement Process
6.3.3.2.2. Pricing of Pharmaceuticals
6.3.3.3. Health Technology Assessment
6.3.3.4. Rheumatoid Arthritis Cost of Treatment in France
6.3.3.5. France Payer’s Insight
6.3.3.6. Features of RA in France
6.3.4. Italy
6.3.4.1. Italy Healthcare System
6.3.4.1.1. Healthcare Expenditure
6.3.4.1.2. Health Coverage
6.3.4.1.3. Key Formularies
6.3.4.1.4. Role of Pharmacists in Italy Healthcare System
6.3.4.2. Pricing & Reimbursement
6.3.4.2.1. Reimbursement Process
6.3.4.2.2. Pricing Approval Process
6.3.4.3. Health Technology Assessment
6.3.4.4. Rheumatoid Arthritis Cost of Treatment in Italy
6.3.4.5. Features of RA in Italy
6.3.5 Spain
6.3.5.1 Spain Healthcare System
6.3.5.1.1. Healthcare Expenditure:
6.3.5.1.2. Health Coverage:
6.3.5.1.3. Key Formularies:
6.3.5.1.4. Role of Pharmacists in Spain Healthcare System
6.3.5.2. Pricing & Reimbursement
6.3.5.2.1. Reimbursement of Pharmaceuticals in Spain
6.3.5.2.2. Pricing of Pharmaceuticals in Spain
6.3.5.3. Health Technology Assessment
6.3.5.4. Rheumatoid Arthritis Cost of Treatment in Spain
6.3.5.5 Cost of Treatment
6.3.5.6 Spain Payer Insight
6.3.5.7. Features of Spanish Health care for Rheumatoid Arthritis
6.4. Asia-Pacific
6.4.1 Japan
6.4.1.1. Japan Healthcare System
6.4.1.1.1 Key Formularies
6.4.1.2. Pricing & Reimbursement
6.4.1.3. Health Technology Assessment:
6.4.1.4. Rheumatoid Arthritis Cost of Treatment in Japan
6.4.1.5. Japan Payer’s Insight
6.4.1.6. Features of RA in Japan
6.4.2 Australia
6.4.2.1 Australia Healthcare System
6.4.2.1.1 Healthcare Expenditure:
6.4.2.1.2 Health Coverage:
6.4.2.1.3 Key Formularies:
6.4.2.1.4 Role of Pharmacists in Australian Healthcare System:
6.4.2.2. Pricing & Reimbursement
6.4.2.3. Health Technology Assessment
6.4.2.3.1. Regulatory and Approval Process
6.4.2.4. Rheumatoid Arthritis Cost of Treatment in Australia
6.4.2.5. Australia’s Payer’s Insight
6.4.2.6. Features of Australian Health care for Rheumatoid Arthritis
6.5. BRIC
6.5.1. Brazil
6.5.1.1. Brazilian Healthcare System
6.5.1.1.1. Role Pharmacists in Brazilian Healthcare System
6.5.1.2. Regulatory Process
6.5.1.2.1. ANVISA’s Regulatory framework for biological products
6.5.1.3. Brazil Pricing and Reimbursement
6.5.1.3.1. Pricing Process
6.5.1.3.2. Reimbursement Process
6.5.1.4. Health Technology Assessment
6.5.1.5. Cost of Rheumatoid arthritis in Brazil
6.5.1.6. Brazil Payer’s Insight
6.5.1.7. Features of RA in Brazil
6.5.2. Russia
6.5.2.1. Russia Healthcare System
6.5.2.1.1. Healthcare Expenditure
6.5.2.2. Pricing & Reimbursement
6.5.2.3. Health Technology Assessment:
6.5.2.4. Russia Payer’s Insight
6.5.2.5. Features of RA in Russia
6.5.3 India
6.5.3.1 India Healthcare System
6.5.3.2 Pricing & Reimbursement
6.5.3.2.1. Pricing of pharmaceuticals in India
6.5.3.2.2. Reimbursement of Pharmaceuticals in India
6.5.3.3 Cost of RA treatment in India
6.5.3.4 India Payer Insight
6.5.3.5 Features of RA in India
6.5.4 China
6.5.4.1 China Healthcare System
6.5.4.1.1. Healthcare Expenditure
6.5.4.1.2. Health Insurance & Coverage in China
6.5.4.2. Pricing & Reimbursement:
6.5.4.2.1. Pricing of Pharmaceuticals in China
6.5.4.2.2. Reimbursement of Pharmaceuticals in China
6.5.4.3. Health Technology Assessment (HTA):
6.5.4.4. Rheumatoid Arthritis Cost of Treatment in China
6.5.4.5. China Payer’s Insight
6.5.4.6. Features of RA in China
7. Parallel Import & Its Impact
7.1. Parallel Import in Europe
7.2. Parallel Import in the U.S.
7.3. Economic aspects in Parallel trade
7.4. Parallel trade and Rheumatoid Arthritis
Associated Visiongain Reports
Visiongain Report Sales Order Form
About Visiongain
Visiongain Report Evaluation Form
List of Tables
Table 2.1 Diagnosis of RA: ACR/EULAR 2012 Criteria
Table 2.2 Biologics used in RA
Table 2.3 Biologics used in RA
Table 2.4 Availability of Key RA Treatments in 13 Major Markets
Table 2.5 Pipeline Treatments for Rheumatoid Arthritis
Table 2.6 Pipeline Biosimilars for Rheumatoid Arthritis
Table 3.1 VBP Value Metrics
Table 5.1: Institutions and Advisory Bodies Responsible for HTA Activities In EU
Table 6.1: U.S.: Average ASP for Biologic DMARDs
Table 6.2: U.S.: Medicare Payment Rate Per Unit, Remicade Vs. Biosimilars, 2016-2017
Table 6.3: Cost of Treatment in the U.S. for Anti-TNF drugs (WAC Prices) (USD)
Table 6.4: U.S.: Rheumatoid Arthritis Drugs Price Trend & Forecast (WAC Price in USD), 2016-2028
Table 6.5: U.S.: Drug Categories for the 2015 ACR recommendations for treatment of Rheumatoid Arthritis
Table 6.6: Canada: Rheumatoid Arthritis Drugs Price Trend & Forecast (CAD$), 2014-2028
Table 6.7: Key Reimbursement Stakeholders’ in Canada
Table 6.8: Canada Competitor Pricing of Rheumatoid Arthritis Drugs – Unit Ex-factory Prices ($CAD) (2014-2017)
Table 6.9: Canada- Rheumatoid Arthritis Cost of Trearment ($CAD)
Table 6.10 Rheumatoid Arthritis: Tests, Diagnostic Value & Disease Activity Monitoring
Table 6.11: U.K.: Rheumatoid Arthritis Drugs Price Trend & Forecast (GBP), 2014-2028
Table 6.12: UK Competitor Pricing of Rheumatoid Arthritis Drugs – Unit Ex-Factory Prices (£) (2014-2017)
Table 6.13 Overall per annum economic burden of RA (UK)
Table 6.14: Rheumatoid Arthritis Cost of Treatment
Table 6.15: Germany: Rheumatoid Arthritis Drugs Price Trend & Forecast (Euro), 2016-2028
Table 6.16 Germany Competitor Pricing of Rheumatoid Arthritis Drugs – Unit Ex-Factory Prices (Euro) (2014-2017)
Table 6.17: Germany: Rheumatoid Arthritis Annual Treatment Cost, 2014-2017
Table 6.18 Reimbursement Rate
Table 6.19: France: Rheumatoid Arthritis Drugs Price Trend & Forecast (Euro) 2014-2028
Table 6.20: France Competitor Pricing of Rheumatoid Arthritis Drugs – Unit Ex-factory Prices (€) (2014-2017)
Table 6.21: France: Rheumatoid Arthritis Cost of Treatment
Table 6.22: Italy: Rheumatoid Arthritis Drugs Price Trend & Forecast (Euro), 2016-2028
Table 6.23: Italy Competitor Pricing of Rheumatoid Arthritis Drugs – Unit Ex-factory Prices (€) (2014-2017)
Table 6.24: Italy: Rheumatoid Arthritis Cost of Treatment
Table 6.25: Spain: Rheumatoid Arthritis Anti-TNF Drugs Price Trend & Forecast (Euro), 2016-2028
Table 6.26: Spain Competitor Pricing of Rheumatoid Arthritis Drugs – Unit Ex-factory Prices (Euro) 2014-2017
Table 6.27: Spain: Rheumatoid Arthritis Annual Treatment Cost, 2014-2017
Table 6.28: Japan: Rheumatoid Arthritis Drugs Price Trend & Forecast (¥), 2016-2028
Table 6.29: Japan: Competitor Pricing of Rheumatoid Arthritis Drugs – Unit Ex-factory Prices (¥) (2014-2017)
Table 6.30: Japan: Rheumatoid Arthritis Cost of Treatment
Table 6.31: Australia: Formulary Allocation for Rheumatoid Arthritis Drugs (F1/F2)
Table 6.32: Australia Competitor Pricing of Rheumatoid Arthritis Drugs – Unit Ex-factory Prices (AUD) (2014-2017)
Table 6.33: Australia: Arthritis Anti-TNF Drugs Price Trend & Forecast (AUD), 2016-2028
Table 6.34: Brazil: Rheumatoid Arthritis Drugs Price Trend & Forecast (BRL), 2016-2028
Table 6.35: Brazil Competitor Pricing of Rheumatoid Arthritis Drugs – Unit Ex-factory Prices (BRL) (2014-2017)
Table 6.36: Brazil: RA Medications available in the Brazilian Public Care System
Table 6.37: Russia: Rheumatoid Arthritis Drugs Price Trend & Forecast (Rubles), 2016-2028
Table 6.38: India: Rheumatoid Arthritis Drugs Price Trend & Forecast (INR), 2016-2028
Table 6.39: India: Cost and Dosage of available biologic DMARDs in India
Table 6.40: India Competitor Pricing of Rheumatoid Arthritis Drugs – Unit Ex-factory Prices (INR) (2014-2017)
Table 6.41 China Healthcare System: Stakeholders and Functions
Table 6.42 Healthcare Coverage and Insurance in China
Table 6.43 Number of Hospitals in China by Economic Classification and Hospital Level
Table 6.44: China Competitor Pricing of Rheumatoid Arthritis Drugs – Unit Ex-factory Prices (CNY) (2014-2017)
Table 6.45: China: Rheumatoid Arthritis Drugs Price Trend & Forecast (CNY), 2016-2028
List of Figures
Figure 5.1: Aspects of HTA for Different Technologies and Interventions
Figure 6.1: U.S.: Key Organizations in US Healthcare System
Figure 6.2: U.S. – Healthcare Expenditure (% of GDP Spending), 2014-2017
Figure 6.3: U.S. – National Expenditures (as of %GDP Spending), 2016
Figure 6.4: U.S.: Market Access Flow in United States
Figure 6.5 U.S.: Federally Funded Health Insurance Plans
Figure 6.6: U.S.: Top Anti-TNF Drugs Price Trend in U.S. (WAC Price in USD) (2014-2017)
Figure 6.7: U.S.: Rheumatoid Arthritis Drugs Price Trend & Forecast (WAC Price in USD), 2016-2028
Figure 6.8: Canada - Healthcare Structure
Figure 6.9: Canada – National Expenditures (as of %GDP Spending), 2016
Figure 6.10: Canada – Healthcare Expenditure (% of GDP Spending), 2014-2017
Figure 6.11: Pricing & Reimbursement in Canada
Figure 6.12: Canada: Rheumatoid Arthritis Drugs Price Trend & Forecast (CAD$), 2016-2028
Figure 6.13: Pathways to Reimbursement in Canada
Figure 6.14: Anti-TNF Drugs Price Trend in Canada
Figure 6.15 U.K. – Healthcare System Structure
Figure 6.16: U.K. – National Expenditures (as of %GDP Spending), 2013-2015
Figure 6.17: U.K. – Rheumatoid Arthritis Expenditure – 2015 ($ billion)
Figure 6.18: Pricing & Reimbursement in the U.K.
Figure 6.19: U.K.: Rheumatoid Arthritis Drugs Price Trend & Forecast (GBP), 2016-2028
Figure 6.20: Health Technology Assessment & Appraisal in the U.K.
Figure 6.21: Biosimilars Uptake: Infliximab & Etanercept
Figure 6.22: U.K.: Rheumatoid Arthritis Drugs Price Trend (GBP), 2014-2017
Figure 6.23: Germany – Healthcare System Structure
Figure 6.24 Key decision-makers in German Healthcare system
Figure 6.25: Germany – Healthcare Expenditure (% of GDP Spending), 2014-2017
Figure 6.26: Germany – Multi-player nature of German healthcare system
Figure 6.27: Pricing & Reimbursement in Germany
Figure 6.28: Germany: Rheumatoid Arthritis Drugs Price Trend & Forecast (Euro), 2016-2028
Figure 6.29: Germany Health Technology Assessment
Figure 6.30: Germany: Rheumatoid Arthritis - Top Anti-TNF Drugs Price Trend – Unit List Price
Figure 6.31: Germany: Rheumatoid Arthritis - Top Anti-TNF Drugs Price Trend – Unit Negotiated Price
Figure 6.32: France Healthcare System Structure
Figure 6.33: France – Healthcare Expenditure (% of GDP Spending), 2013-2016
Figure 6.34 France – National Expenditures (as of %GDP Spending), 2016
Figure 6.35: Pricing & Reimbursement in France
Figure 6.36: France: Rheumatoid Arthritis Drugs Price Trend & Forecast (Euro), 2016-2028
Figure 6.37: Health Technology Assessment in France
Figure 6.38: France: Drug review & Decision process:
Figure 6.39: Anti-TNF Drugs Price Trend
Figure 6.40: Italy Healthcare System Structure
Figure 6.41: Italy – Healthcare Expenditure (% of GDP Spending), 2014-2017
Figure 6.42: Italy – National Expenditures (as of %GDP Spending), 2016
Figure 6.43: Italy – Rheumatoid Arthritis Expenditure – 2017 ($ billion)
Figure 6.44: Pricing & Reimbursement in Italy
Figure 6.45: Italy: Rheumatoid Arthritis Drugs Price Trend & Forecast (Euro), 2016-2028
Figure 6.46: Anti-TNF Drugs Price Trend in Italy
Figure 6.47: Spain – Healthcare System Structure
Figure 6.48: Spain – Healthcare Expenditure (% of GDP Spending), 2014-2017
Figure 6.49: Spain – National Expenditures (% of GDP Spending), 2016
Figure 6.50: Pricing & Reimbursement in Spain
Figure 6.51: Reimbursement of pharmaceuticals in Spain
Figure 6.52: Spain: Rheumatoid Arthritis Drugs Price Trend & Forecast (Euro), 2016-2028
Figure 6.53: Health Technology Assessment in Spain
Figure 6.54: Spain: Rheumatoid Arthritis - Top Anti-TNF Drugs Price Trend
Figure 6.55: Japan – Healthcare Expenditure (% of GDP Spending), 2013-2016
Figure 6.56: Japan – National Expenditures (as of %GDP Spending), 2016
Figure 6.57: Japan Healthcare System Structure
Figure 6.58: Japan: Rheumatoid Arthritis Drugs Price Trend & Forecast (¥), 2016-2028
Figure 6.59: Health Technology Assessment in Japan
Figure 6.60: Anti-TNF Drugs Price Trend in Japan
Figure 6.61: Australia – Healthcare System Structure
Figure 6.62: Australia – Healthcare Expenditure (% of GDP Spending), 2014-2017
Figure 6.63: Health Technology Assessment & Regulatory and Approval Process in Australia
Figure 6.64: Australia: Rheumatoid Arthritis - Top Anti-TNF Drugs Price Trend
Figure 6.65: Australia: Rheumatoid Arthritis Drugs Price Trend & Forecast (Euro), 2016-2028
Figure 6.66: Brazil – Healthcare Expenditure (% of GDP Spending), 2013-2016
Figure 6.67: Key Decision-Makers in Brazilian Healthcare System
Figure 6.68: Brazil Regulatory Process
Figure 6.69: Brazil: ANVISA’s Regulatory approval pathway for biological products
Figure 6.70: Brazil: Rheumatoid Arthritis Drugs Price Trend & Forecast (BRL), 2016-2028
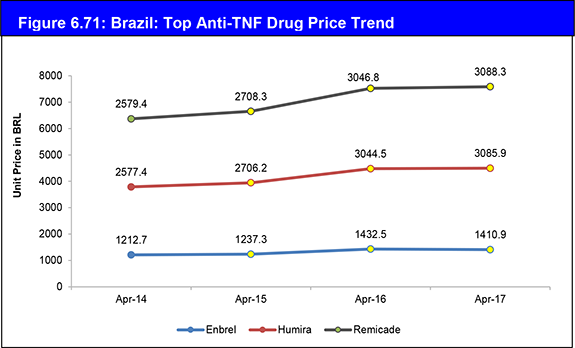
Figure 6.71: Brazil: Top Anti-TNF Drug Price Trend
Figure 6.72: Russia Healthcare System Structure
Figure 6.73: Russia – Healthcare Expenditure (% of GDP Spending), 2013-2016
Figure 6.74: Russia – National Expenditures (as of % GDP Spending), 2016
Figure 6.75: Russia: Rheumatoid Arthritis Drugs Price Trend & Forecast (Rubles), 2016-2028
Figure 6.76: India – Healthcare Expenditure (% of GDP Spending), 2014-2017
Figure 6.77: India Healthcare System Structure
Figure 6.78: Key Decision-Makers in Indian Healthcare System
Figure 6.79: India: Rheumatoid Arthritis Drugs Price Trend & Forecast (Euro), 2016-2028
Figure 6.80: Anti-TNF Drugs Price Trend in India (2014-2017)
Figure 6.81: China: Healthcare System Structure
Figure 6.82: China – Healthcare Expenditure (% of GDP Spending), 2013-2016
Figure 6.83: China – National Expenditures (as of %GDP Spending), 2016
Figure 6.84: Pricing & Reimbursement in China
Figure 6.85: China: Rheumatoid Arthritis Drugs Price Trend & Forecast (CNY), 2016-2028
Figure 6.86: China: Health Technology Assessment
Figure 6.87: Anti-TNF Drugs Price Trend in China
Abbott
AbbVie
Ablynx
Astellas
AstraZeneca
AVIVA Health Insurance
AXA
BMS
BUPA
Can-Fite BioPharma
Celltrion
Cipla
ClaimSecure
CVS Caremark
Eli Lilly
Empire Life
Express Script
Freedom Health Insurance
Galapagos
Gilead
Great West Life (GWL)
Green Shield
Helpucover Health Insurance
Janssen
Johnson & Johnson
Manulife
Medavie Blue Cross
Medicare International
MedImmune
Merck
Momenta Pharmaceuticals
MSD
National Friendly HealthCare
Pfizer
PruHealth
Roche
Saga Health Insurance
Sandoz
Sanford C. Bernstein & Company
Sanofi
Schering-Plough
Shanghai CP Guojian Pharmaceutical Co
Simply Health
TelusHealth
UCB
VitaerisBio
Wyeth
List of Organisations Mentioned in the Report
Academia Nacional de Medicina
Academy of Managed Care (AMCP)
AGENAS (National Agency for Regional Health Services)
Agència d'Avaluació de Tecnologia i Recerca Mèdiques de Catalunya (CAHTA)
Agencia de Evaluación de Tecnologías Sanitarias de Andalucía (AETSA)
Agencia Espanola del Medicamento y Productos Sanitarios (AEMPS)
Agencia Laín Entralgo de Madrid
Agência Nacional de Saúde Suplementar (ANS)
Agência Nacional de Vigilância Sanitária (ANVISA)
Agency for Healthcare Research and Quality (AHRQ)
Agenzia Italiana del Farmaco (AIFA)
All Wales Medicines Strategy Group (AWMSG)
American College of Rheumatology (ACR)
ASLs (Azienda Sanitaria Locale)
Asociación Artritis Reumatoide de la Rioja
Asociación Madrileña de Pacientes con Artritis Reumatoide
Australian Government Department of Health and Ageing (DHA)
Axencia de Avaliación de Tecnoloxías Sanitarias de Galicia
Blue Cross Blue Shield
BMJ Group
Bundesinstitut für Arzneimittel und Medizinische Produkte – BfArM
Caisse Primaire d’Assurance Maladie (CPAM)
Câmara de Regulação do Mercado de Medicamentos (CMED)
Canada’s Common Drug Review
Canadian Agency for Drugs and Technologies in Health (CADTH)
Canadian Drug Expert Committee (CDEC)
Canadian Expert Drug Advisory Committee (CEDAC)
Central Drugs Standard Control Organization (CDSCO)
Centre for Disease Control and Prevention (CDC)
Centre for Drug Evaluation and Research (CDER)
Centres for Markets Authority (CMA)
Comissão de Incorporação de Tecnologias (CITEC)
Comissão Nacional de Incorporac¸ão de Tecnologias no SUS (CONITEC)
Comité scientifique de l'évaluation des médicaments aux fins d'inscription (CSEMI)
Consejo Interterritorial del Servicio Nacional de Salud de España (CISNS)
Conselho Federal de Medicina (CFM)
Conselho Nacional de Saúde (CNS)
Conselho Nacional de Secretarias Municipais de Saúde (CONASEMS)
Conselho Nacional de Secretários de Saúd (CONASS)
Coordinadora nacional de Artritis (CONARTRITIS)
Cruz Vermelha Brasileira
Department of Health (DoH)
European League Against Rheumatism (EULAR)
First Nations and Inuit Health Branch
Food and Drug Administration (FDA)
French National Agency for Accreditation and Evaluation in Health (ANAES)
German Federal Ministry of Health
German Institute of Medical Documentation and Information (DIMDI)
German Medical Association (Bundesärztekammer)
German Ministry of Education and Research
German Rheumatism League (Deutsche Rheuma-Liga)
German Society for Rheumatology (Deutsche Gesellschaft für Rheumatologie)
Haute Autorité de Santé (HAS)
Health and Social Care Information Centre
Health Canada
Institute for Quality and Efficiency in Healthcare (IQWiG)
Instituto Aragonés de Ciencias de la Salud (IACS)
Instituto de Salud Carlos III-ISCIII
Interministerial Committee for Economic Planning (CIPE, Comitato Interministeriale per la Programmazione Economia).
Italian Medicines Agency (AIFA)
IZSs (Experimental Zoo prophylactic Institutes)
Liga de Enfermos Vizcaínos de Artritis Reumatoide
Liga Reumatológica de España
Lund University Malmo
Medicines and Healthcare products Regulatory Agency (MHRA)
Ministerio de Sanidad y Consumo
Ministry of Health (Ministero della Salute)
National Association of Statutory Health Insurance Physicians
National Development and Reform Commission (NDRC)
National Institutes for Scientific Research (IRCCSs)
National Institutes of Health (NIH)
National Pharmaceutical Pricing Authority (NPPA)
NEPI Institute
NHS Trusts
Osasun Teknologien Ebaluazioko Zerbitzua (OSTEBA)
Primary Care Trusts (PCTs)
Royal Pharmaceutical Society
Scottish Medicines Consortium (SMC)
Servicio de Evaluación del Servicio Canario de Salud (SCS)
State Chambers of Physicians (Landesärztekammer)
The Affordable Care Act (ACA)
The British National Formulary (BNF)
The Care Quality Commission (CQC)
The Centre for Medicare and Medicaid Services (CMS)
The China Food and Drug Administration (CFDA)
The Department of Health and Human Services (HHS)
The Department of Health Medicines, Pharmacy and Industry Group (MPIG)
The Directorate of Pharmaceutical and Health Products (DGFPS)
The Federal Joint Committee of Germany (G-BA)
The German Institute for Health Technology Assessment (DAHTA)
The Institut national d'excellence en santé et en services sociaux (INESSS)
The International Network of Agencies for Health Technology Assessment
The Joint Formulary Committee (JFC)
The Medicines Utilization Monitoring Centre (OSMED)
The Ministry of Human Resources and Social Security (MOHRSS)
The National Agency for Medicines and Health Products Safety (ANSM)
The National Development and Reform Commission (NDRC)
The National Institute for Health Research (NIHR)
The National Monitoring Centre for Clinical Trials (OsSC)
The National Monitoring Centre for Pharmacovigilance
The Office of Fair Trading (OFT)
The Patented Medicine Prices Review Board (PMPRB)
The Pharmaceutical and Medical Devices Agency (PMDA)
The Social Insurance Organization (Deutsche Sozialversicherung)
UK’s National Institute for Health and Clinical Excellence
Unidad de Evaluación de Tecnologías Sanitarias, Comunidad de Madrid (UETS)
UnitedHealthcare
University of Bremen
World Health Organization