1. Report Overview
1.1 Global Rheumatoid Arthritis Drugs Market Overview
1.2 Overview of Findings
1.3 Structure of the Report
1.4 Global Rheumatoid Arthritis Drugs Market Segmentation
1.5 Why You Should Read This Report
1.6 How This Report Delivers
1.7 Key Questions Answered by This Analytical Report
1.8. Who is This Report For?
1.9 Methodology
1.10 Associated Visiongain Reports
1.11 About Visiongain
2. Introduction to Rheumatoid Arthritis Drugs
2.1 What is Rheumatoid Arthritis?
2.2 What Causes Rheumatoid Arthritis?
2.3. How Does the Disease Develop?
2.4. How Can It Be Monitored?
2.5. Can RA Be Cured?
2.6. Performance Criteria Used in Clinical Trials
2.6.1. ACR Criteria for Drug Efficacy
2.6.2. HAQ-DI Measures Daily Activities
2.6.3. mSS Assesses Disease on X-Ray
2.6.4. DAS28 For Disease Severity
2.7. How is RA Treated?
2.7.1 Biologic DMARDs Are the Dominant Source of Revenue
2.7.2 Synthetic DMARDs are the Mainstay of Treatment
2.7.3 Others
2.7.3.1 Non-Steroidal Anti-Inflammatory Drugs (NSAIDs)
2.7.3.2 Corticosteroids for Rapid Anti-Inflammatory Effect
2.7.3.3 Analgesics for Rapid Pain Relief
2.8 Comorbid Conditions Associated with RA
2.9 Prevalence and Incidence Rates of Rheumatoid Arthritis
3. Global Rheumatoid Arthritis Drugs Market by Drugs Class 2019-2029
3.1 The Global Rheumatoid Arthritis Drugs Market: Market Overview
3.2 Global Rheumatoid Arthritis Drugs Market: Revenue Forecast 2019-2029
3.3 Global Rheumatoid Arthritis Drugs Market: Market Forecast 2019-2029
3.4 Changing Market Shares by Segment 2019-2029
3.5 Non-Biologics Rheumatoid Arthritis Drugs Market
3.5.1 NSAIDs: Revenue Forecast, 2017-2029
3.5.2 Synthetic DMARDs (sDMARDs): Revenue Forecast, 2017-2029
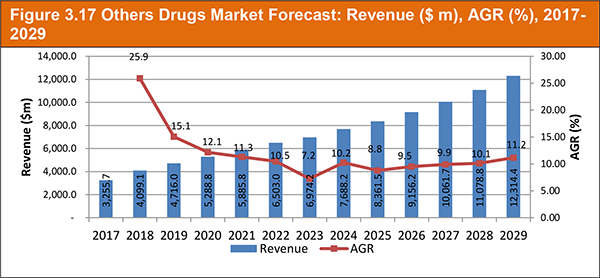
3.5.3 Others: Revenue Forecast, 2017-2029
4. Leading Drugs in the Rheumatoid Arthritis Market 2019-2029
4.1 The Main Drugs in the Rheumatoid Arthritis Market, 2018
4.2 Humira: A Major Source of Revenue for AbbVie
4.2.1 Adalimumab Biosimilars
4.2.2 Humira: Sales Forecast 2019-2029
4.3 Enbrel: Amgen’s Revenue Protected Until 2029
4.3.1 Etanercept Biosimilars
4.3.2 Enbrel: Revenue Forecast 2017-2029
4.4 Remicade: Facing Significant Competition from Biosimilars
4.4.1 Infliximab Biosimilars
4.4.2 Remicade: Revenue Forecast 2017-2029
4.5 Rituxan: Facing Declining Market Share
4.5.1 Rituximab Biosimilars
4.5.2 Rituxan: Revenue Forecast 2017-2029
4.6 Simponi (golimumab): Market Share Remaining Stable
4.6.1 Simponi/Simponi Aria: Revenue Forecast 2017-2029
4.7 Orencia: Additional Indications Being Explored
4.7.1 Abatacept Biosimilars
4.7.2 Orencia: Revenue Forecast 2017-2029
4.8 Actemra/RoActemra: First IL-6R Inhibitor Approved for RA
4.8.1 Tocilizumab Biosimilars
4.8.2 Actemra/RoActemra: Revenue Forecast 2017-2029
4.9 Cimzia: Reliable Source of Income for UCB
4.9.1 Certolizumab Biosimilars
4.9.2 Cimzia: Revenue Forecast 2017-2029
4.10 Celebrex: Facing Generic Competition
4.10.1 Celebrex: Revenue Forecast 2017-2029
4.11 Xeljanz: Good Opportunity for Revenue Growth
4.11.1 Xeljanz: Revenue Forecast 2017-2029
4.12 Arcoxia: Sales Revenue Already Declining
4.12.1 Arcoxia: Revenue Forecast 2017-2029
5. Leading National Markets 2019-2029
5.1. Geographical Breakdown of the World Rheumatoid Arthritis Drugs Market
5.2 World Rheumatoid Arthritis Drugs Market: Regional Forecast 2019-2029
5.2.1 How Will Regional Market Shares Change to 2029?
6. North America Rheumatoid Arthritis Drugs Market 2019-2029
6.1. US Rheumatoid Arthritis Drugs Market: Market Forecast 2019-2029
6.2. Canada Rheumatoid Arthritis Drugs Market: Trends and Developments
7. Europe Rheumatoid Arthritis Drugs Market 2019-2029
7.1 Europe Markets: Changing Market Shares by Country, 2019-2029
7.2 German Rheumatoid Arthritis Drugs Market: Market Forecast 2019-2029
7.3 France Rheumatoid Arthritis Drugs Market Forecast 2019-2029
7.4. U.K. Rheumatoid Arthritis Drugs Market Forecast 2019-2029
7.5 Italy Rheumatoid Arthritis Drugs Market Forecast 2019-2029
7.6. Spain Rheumatoid Arthritis Drugs Market Forecast 2019-2029
7.7. Russia Rheumatoid Arthritis Drugs Market Forecast 2019-2029
7.8. Rest of Europe Rheumatoid Arthritis Drugs Market Forecast 2019-2029
8. Asia-Pacific Rheumatoid Arthritis Drugs Market 2019-2029
8.1 Chinese Rheumatoid Arthritis Drugs Market Forecast 2019-2029
8.2. Japanese Rheumatoid Arthritis Drugs Market Forecast 2019-2029
8.3. Indian Rheumatoid Arthritis Drugs Market Forecast 2019-2029
8.4. Rest of Asia-Pacific Rheumatoid Arthritis Drugs Market: Trends and Developments
9. Latin America Rheumatoid Arthritis Drugs Market 2019-2029
9.1 Brazil Rheumatoid Arthritis Drugs Market Forecast 2019-2029
9.2. Mexico Rheumatoid Arthritis Drugs Market Forecast 2019-2029
9.3. Rest of Latin America Rheumatoid Arthritis Drugs Market Forecast 2019-2029
10. Middle East & Africa Rheumatoid Arthritis Drugs Market 2019-2029
10.1. Saudi Arabia Rheumatoid Arthritis Drugs Market Forecast 2019-2029
10.2. South Africa Rheumatoid Arthritis Drugs Market Forecast 2019-2029
10.3. Rest of Middle East & Africa Rheumatoid Arthritis Drugs Market Forecast 2019-2029
11. Rheumatoid Arthritis R&D Pipeline 2018
11.1 IL-6 Inhibitors Could Rival TNF-Inhibitors
11.1.1 Sarilumab: Already Filed With FDA
11.1.2 Sirukumab: Expected to File in Q3, 2016
11.1.3 Olokizumab: Promising Phase 2 Data
11.1.4 Clazakizumab
11.2 JAK Inhibitors: A Promising Class of Agents
11.2.1 Peficitinib: Selective JAK-3 Inhibitor from Astellas
11.2.2 ABT-494: Selective JAK-1 Inhibitor from AbbVie
11.2.3 Filgotinib: Following AbbVie’s Withdrawal, Galapagos Now Working with Gilead
11.3 BTK Inhibitors
11.3.1 BMS-986142
11.3.2 HM71224
11.4 GM-CSF Inhibitor
11.4.1 GSK 3196165: Potential Role in Early Disease
12. Leading Companies in the Rheumatoid Arthritis Drugs Market, 2017
12.1 Introduction to the Leading Companies
12.2. AbbVie: Secured Multiple Patents for Humira
12.2.1 Overview
12.2.2 Financial Overview
12.2.3. Recent Transactions Summary
12.3. F. Hoffmann-La Roche Ltd (Roche)
12.3.1 Overview
12.3.2 Financial Overview
12.3.3. Recent Transactions Summary
12.4. Johnson & Johnson
12.4.1 Overview
12.4.2 Financial Overview
12.4.3. Recent Transactions Summary
12.5. Amgen, Inc.
12.5.1 Overview
12.5.2 Financial Overview
12.5.3.Recent Transactions Summary
12.6. Pfizer: Actively Developing Biosimilars
12.6.1 Overview
12.6.2 Pfizer, Inc.: Financial Overview
12.6.3 Pfizer, Inc.: Recent Developments
12.7. Merck & Co., Inc.: Remicade Sales in Decline
12.7.1. Overview
12.7.2 Merck & Co., Inc.: Financial Overview
12.7.3 Merck & Co., Inc.: Recent Transactions Summary
12.8. Bristol-Myers Squibb (BMS): Exploring Additional Indications for Orencia
12.8.1. Overview
12.8.2 Bristol-Myers Squibb: Financial Overview
12.8.3 Bristol-Myers Squibb: Recent Developments
12.9 UCB: Reliant on Cimzia Revenue
12.9.1 Overview
12.9.2 UCB: Financial Overview
12.9.3 UCB: Recent Transactions Summary
12.10 Eli Lilly and Company
12.10.1 Eli Lilly and Company: RA Drugs Portfolio
12.10.2 Eli Lilly and Company: Financial Overview
12.10.3 Eli Lilly and Company: Recent Transactions Summary
12.11 Novartis AG
12.11.1 Novartis: Rheumatoid Arthritis Drugs Product Portfolio
12.11.2 Novartis AG: Financial Overview
12.11.3 Novartis AG: Recent Transactions Summary
12.12 Sanofi S.A. (Sanofi)
12.12.1 Sanofi: Rheumatoid Arthritis Drugs Portfolio
12.12.2 Sanofi: Financial Overview
12.12.3 Sanofi: Recent Transactions Summary
13. Qualitative Analysis of the Rheumatoid Arthritis Market, 2019-2029
13.1 Strengths and Weaknesses of the Rheumatoid Arthritis Market, 2017
13.1.1 Strengths
13.1.1.1 Number of Elderly Patients Expected to Rise
13.1.1.2 Biologics Already Recognised as a Valuable Part of Treatment
13.1.1.3 Biologics Used in RA Often Have Multiple Indications
13.1.2 Weaknesses
13.1.2.1 Some Patients Have an Inadequate Treatment Response
13.1.2.2. Efficacy of Drugs Can Diminish Over Time
13.1.3. Opportunities
13.1.3.1 Need for Effective Drugs with Better Safety Profiles
13.1.3.2 Need for Less Invasive Routes of Administration
13.1.4. Threats
13.1.4.1 High Number of Products Will Saturate Market
13.1.4.2 Competition from Biosimilars Will Increase
13.2 Social, Technological, Economic and Political Factors Affecting the Rheumatoid Arthritis Market (STEP Analysis), 2019-2029
13.2.1 Social Factors Influencing the Rheumatoid Arthritis Market
13.2.2 Technological Factors Influencing the Rheumatoid Arthritis Market
13.2.3 Economic Factors Influencing the Rheumatoid Arthritis Market
13.2.4 Political Factors Influencing the Rheumatoid Arthritis Market
13.2.4.1 Government Pressure to Control Costs
13.2.4.2 Inter-country Variability in Biosimilar Approval Process
14. Conclusions
14.1 Overview of Current Market Conditions and Market Forecast, 2019-2029
14.2 Biologics Will Remain the Dominant Drug Class but their Market Share Will Drop By More than 20%
14.3 Enbrel Will Overtake Humira as the Leading Drug
14.4 Leading Regions in the Rheumatoid Arthritis Market in 2017
14.5 Trends in the RA Drugs Market
Appendices
Associated Visiongain Reports
Visiongain Report Sales Order Form
About Visiongain
Visiongain Report Evaluation Form
List of Tables
Table 2.1 Biologic Agents and Mechanism of Action
Table 2.2 Comorbidities Associated with RA in Different Organs
Table 2.3 Prevalence rate of RA in Different Countries
Table 3.1 Rheumatoid Arthritis Drugs Market by Submarket, 2017
Table 3.2 Global Rheumatoid Arthritis Drugs Market Forecast: Revenues ($m), AGR (%), CAGR (%), 2017-2029
Table 3.3 Global Rheumatoid Arthritis Drugs Market Forecast: Revenues ($m), AGR (%), CAGR (%), 2017-2029
Table 3.4 Global Rheumatoid Arthritis Drugs Market by Drugs Class: CAGR (%), 2019-2023, 2023-2029, 2019-2029
Table 3.5 Global Non- Biologics Rheumatoid Arthritis Drugs Market Forecast: Revenues ($m), AGR (%), CAGR (%), 2017-2029
Table 3.6 NSAIDs for Rheumatoid Arthritis Forecasts: Revenue ($m), AGR (%) and CAGR (%), 2017-2029
Table 3.7 sDMARDs for Rheumatoid Arthritis Forecasts: Revenue ($m), AGR (%) and CAGR (%), 2017-2029
Table 3.8 Others for Rheumatoid Arthritis Forecasts: Revenue ($m), AGR (%) and CAGR (%), 2017-2029
Table 4.1 Global Rheumatoid Arthritis Market by Drugs Class: Revenue ($m), and Market Share (%), 2018
Table 4.2 The Main Drugs in the Rheumatoid Arthritis Market Forecasts: Revenue ($m), AGR (%) and CAGR (%), 2017-2029
Table 4.2 The Main Drugs in the Rheumatoid Arthritis Market Forecasts: Revenue ($m), AGR (%) and CAGR (%), 2017-2029 - Cont.
Table 4.3 Humira: Key Facts
Table 4.4 Adalimumab Biosimilars: Current Status, 2018
Table 4.5 Global Humira Market Forecast: Revenues ($m) AGR (%), CAGR (%), 2017-2029
Table 4.6 Enbrel: Key Facts
Table 4.7 Etanercept Biosimilars: Current Status, 2018
Table 4.8 Global Enbrel Market Forecast: Revenues ($m) AGR (%), CAGR (%), 2017-2029
Table 4.9 Remicade: Key Facts
Table 4.10 Infliximab Biosimilars: Current Status, 2018
Table 4.11 Global Remicade Market Forecast: Revenues ($m) AGR (%), CAGR (%), 2017-2029
Table 4.12 Rituxan: Key Facts
Table 4.13 Rituximab Biosimilars: Current Status, 2018
Table 4.14 Global Rituxan Market Forecast: Revenues ($m) AGR (%), CAGR (%), 2017-2029
Table 4.15 Simponi: Key Facts
Table 4.16 Global Simponi/Simponi Aria Market Forecast: Revenues ($m) AGR (%), CAGR (%), 2017-2029
Table 4.17 Orencia: Key Facts
Table 4.18 Global Orencia Market Forecast: Revenues ($m) AGR (%), CAGR (%), 2017-2029
Table 4.19 Actemra/RoActemra: Key Facts
Table 4.20 Global Actemra/RoActemra Market Forecast: Revenues ($m) AGR (%), CAGR (%), 2017-2029
Table 4.21 Cimzia: Key Facts
Table 4.22 Global Cimzia Market Forecast: Revenues ($m) AGR (%), CAGR (%), 2017-2029
Table 4.23 Celebrex: Key Facts
Table 4.24 Global Celebrex Market Forecast: Revenues ($m) AGR (%), CAGR (%), 2017-2029
Table 4.25 Xeljanz: Key Facts
Table 4.26 Global Xeljanz Market Forecast: Revenues ($m) AGR (%), CAGR (%), 2017-2029
Table 4.27 Arcoxia: Key Facts
Table 4.28 Global Arcoxia Market Forecast: Revenues ($m) AGR (%), CAGR (%), 2017-2029
Table 5.1 Global Rheumatoid Arthritis Drugs Market by Region: Revenue ($m), 2017 and 2018
Table 5.2 Global Rheumatoid Arthritis Drugs Market Forecast by Region: Revenues ($m), AGR (%), CAGR (%), 2017-2029
Table 5.3 Global Rheumatoid Arthritis Drugs Market by Region: CAGR (%), 2019-2023, 2023-2029, 2019-2029
Table 5.4 Global Rheumatoid Arthritis Drugs Market by Region: CAGR (%), 2019-2023, 2023-2029, 2019-2029
Table 6.1 North America Rheumatoid Arthritis Drugs Market Forecast by Class: Revenues ($m), AGR (%), CAGR (%), 2017-2029
Table 6.2 North America Rheumatoid Arthritis Drugs (Non-Biologics) Market Forecast by Segment: Revenues ($m), AGR (%), CAGR (%), 2017-2029
Table 6.3 North America Rheumatoid Arthritis Drugs Market Forecast by Country: Revenues ($m), AGR (%), CAGR (%), 2017-2029
Table 6.4 U.S. Rheumatoid Arthritis Drugs Market Forecast: Revenues ($m), AGR (%), CAGR (%), 2017-2029
Table 6.5 Canada Rheumatoid Arthritis Drugs Market Forecast: Revenues ($m), AGR (%), CAGR (%), 2017-2029
Table 7.1 Global Rheumatoid Arthritis Drugs Market by Country/Sub-region: Revenue ($m) and Market Share (%), 2017
Table 7.2 Europe Rheumatoid Arthritis Drugs Market Forecast by Class: Revenues ($m), AGR (%), CAGR (%), 2017-2029
Table 7.3 Europe Rheumatoid Arthritis Drugs (Non-Biologics) Market Forecast by Segment: Revenues ($ m), AGR (%), CAGR (%), 2017-2029
Table 7.4 Europe Rheumatoid Arthritis Drugs Market Forecast by Country: Revenues ($m), AGR (%), CAGR (%), 2017-2029
Table 7.5 Europe Rheumatoid Arthritis Drugs Market by Country/Sub-region: CAGR (%), 2019-2023, 2023-2029, 2019-2029
Table 7.6 Germany Rheumatoid Arthritis Drugs Market Forecast, 2017-2029 ($m, AGR %, CAGR %)
Table 7.7 France Rheumatoid Arthritis Drugs Market Forecast: Revenues ($m), AGR (%), CAGR (%), 2017-2029
Table 7.8 U.K. Rheumatoid Arthritis Drugs Market Forecast, 2017-2029 ($m, AGR %, CAGR %)
Table 7.9 Italy Rheumatoid Arthritis Drugs Market Forecast, 2017-2029 ($m, AGR %, CAGR %)
Table 7.10 Spain Rheumatoid Arthritis Drugs Market Forecast, 2017-2029 ($m, AGR %, CAGR %)
Table 7.11 Russia Rheumatoid Arthritis Drugs Market Forecast, 2017-2029 ($m, AGR %, CAGR %)
Table 7.12 Rest of Europe Rheumatoid Arthritis Drugs Market Forecast, 2017-2029 ($m, AGR %, CAGR %)
Table 8.1 Asia-Pacific Rheumatoid Arthritis Drugs Market Forecast by Class: Revenues ($m), AGR (%), CAGR (%), 2017-2029
Table 8.2 Asia-Pacific Rheumatoid Arthritis Drugs (Non-Biologics) Market Forecast by Segment: Revenues ($m), AGR (%), CAGR (%), 2017-2029
Table 8.3 Asia-Pacific Rheumatoid Arthritis Drugs Market Forecast by Country: Revenues ($m), AGR (%), CAGR (%), 2017-2029
Table 8.4 China Rheumatoid Arthritis Drugs Market Forecast, 2017-2029 ($m, AGR %, CAGR %)
Table 8.5 Japan Rheumatoid Arthritis Drugs Market Forecast, 2017-2029 ($m, AGR %, CAGR %)
Table 8.6 India Rheumatoid Arthritis Drugs Market Forecast, 2017-2029 ($m, AGR %, CAGR %)
Table 8.7 Rest of Asia Pacific Rheumatoid Arthritis Drugs Market Forecast, 2017-2029 ($m, AGR %, CAGR %)
Table 9.1 Latin America Rheumatoid Arthritis Drugs Market Forecast by Class: Revenues ($m), AGR (%), CAGR (%), 2017-2029
Table 9.2 Latin America Rheumatoid Arthritis Drugs (Non-Biologics) Market Forecast by Segment: Revenues ($m), AGR (%), CAGR (%), 2017-2029
Table 9.3 Latin America Rheumatoid Arthritis Drugs Market Forecast by Country: Revenues ($m), AGR (%), CAGR (%), 2017-2029
Table 9.4 Brazil Rheumatoid Arthritis Drugs Market Forecast, 2017-2029 ($ m, AGR %, CAGR %)
Table 9.5 Mexico Rheumatoid Arthritis Drugs Market Forecast, 2017-2029 ($m, AGR %, CAGR %)
Table 9.6 Rest of Latin America Rheumatoid Arthritis Drugs Market Forecast, 2017-2029 ($m, AGR %, CAGR %)
Table 10.1 Middle East and Africa Rheumatoid Arthritis Drugs Market Forecast by Class: Revenues ($m), AGR (%), CAGR (%), 2017-2029
Table 10.2 Middle East and Africa Rheumatoid Arthritis Drugs (Non-Biologics) Market Forecast by Segment: Revenues ($ m), AGR (%), CAGR (%), 2017-2029
Table 10.3 Middle East & Africa (MEA) Rheumatoid Arthritis Drugs Market Forecast by Country: Revenues ($m), AGR (%), CAGR (%), 2017-2029
Table 10.4 Saudi Arabia Rheumatoid Arthritis Drugs Market Forecast: Revenues ($m), AGR (%), CAGR (%), 2017-2029
Table 10.5 South Africa Rheumatoid Arthritis Drugs Market Forecast, 2017-2029 ($m, AGR %, CAGR %)
Table 10.6 Rest of MEA Rheumatoid Arthritis Drugs Market Forecast, 2017-2029 ($m, AGR %, CAGR %)
Table 11.1 Pipeline R&D Products, 2018
Table 12.1 Leading Companies in the RA Drug Market: Revenue ($m) and Market Share (%), 2017
Table 12.2 AbbVie: Breakdown of Revenue ($m,%) by RA Drug, 2016
Table 12.3 AbbVie: Overview, 2018
Table 12.4 AbbVie: Revenue ($m), AGR (%), 2013-2017
Table 12.5 F.Hoffmann-La Roche AG: Breakdown of Revenue ($m,%) by RA Drug, 2017
Table 12.6. Roche: Overview, 2018
Table 12.7 Roche: Revenue ($m), AGR (%), 2013-2017
Table 12.8 Johnson & Johnson: Breakdown of Revenue ($m,%) by RA Drug, 2017
Table 12.9. Johnson & Johnson: Overview, 2018
Table 12.10 Johnson & Johnson: Revenue ($m), AGR (%), 2013-2017
Table 12.11 Amgen: Breakdown of Revenue ($m,%) by RA Drug, 2017
Table 12.12 Amgen, Inc.: Overview, 2018
Table 12.13 Amgen, Inc.: Revenue ($m), AGR (%), 2013-2017
Table 12.14 Pfizer, Inc.: Breakdown of Revenue ($m,%) by RA Drug, 2017
Table 12.15 Pfizer, Inc.: Overview, 2018
Table 12.16 Pfizer, Inc.: Revenue ($m), AGR (%), 2013-2017
Table 12.17 Merck & Co., Inc.: Breakdown of Revenue ($m,%) by RA Drug, 2017
Table 12.18 Merck & Co., Inc.: Overview, 2018
Table 12.19 Merck & Co., Inc.: Revenue ($m), AGR (%), 2013-2017
Table 12.20 Bristol-Myers Squibb: Breakdown of Revenue ($m,%) by RA Drug, 2017
Table 12.21 Bristol-Myers Squibb: Overview, 2017
Table 12.22 Bristol-Myers Squibb: Revenue ($m), AGR (%), 2013-2017
Table 12.23 UCB: Breakdown of Revenue ($m,%) by RA Drug, 2017
Table 12.24 UCB: Overview, 2018
Table 12.25 UCB: Revenue ($m), AGR (%), 2013-2017
Table 12.26 Eli Lilly and Company: Overview, 2018
Table 12.27 Eli Lilly and Company: Revenue ($m), AGR (%), 2013-2017
Table 12.28 Novartis AG: Overview, 2018
Table 12.29 Novartis AG: Revenue ($m), AGR (%), 2013-2017
Table 12.30 Sanofi: Overview, 2018
Table 12.31 Sanofi: Revenue ($m), AGR (%), 2013-2017
Table 13.1 SWOT Analysis of the Global Rheumatoid Arthritis Market, 2019-2029
Table 13.2 Social, Technological, Economic and Political Factors Influencing the RA Market, 2017-2029
Table 14.1 Global Rheumatoid Arthritis Market Forecast: Revenue ($m), and CAGR (%), 2017, 2023 and 2029
Table 14.2 Global Rheumatoid Arthritis Market by Drugs Class: CAGR (%), 2017, 2023, 2029
Table 14.3 Global Rheumatoid Arthritis Market by Region: CAGR (%), 2017, 2023, 2029
Table 14.4 Drivers and Restraints of the RA Drugs Market, 2019-2029
List of Figures
Figure 1.1 Global Rheumatoid Arthritis Drugs Market Segmentation Overview
Figure 3.1 Rheumatoid Arthritis Drugs Market: Market Share (%) by Indication, 2017
Figure 3.2 Rheumatoid Arthritis Drugs Market: Market Share (%) by Class, 2017
Figure 3.3 Global Rheumatoid Arthritis Drugs Market Forecast: Revenue ($m), AGR (%), 2017-2029
Figure 3.4 Global Rheumatoid Arthritis Drugs Market Revenues by Drug Class, 2018
Figure 3.5 Global Rheumatoid Arthritis Drugs Market Revenues by Drugs Class, 2019
Figure 3.6 Global Rheumatoid Arthritis Drugs Market Forecast by Drugs Class: CAGR (%), 2019-2029
Figure 3.7 Rheumatoid Arthritis Drugs Market Segments: Revenue ($m) Forecast, 2017-2029
Figure 3.8 Global Rheumatoid Arthritis Drugs Market by Drugs Class: Market Share (%), 2018
Figure 3.9 Global Rheumatoid Arthritis Drugs Market by Drugs Class: Market Share (%), 2023
Figure 3.10 Global Rheumatoid Arthritis Drugs Market by Drugs Class: Market Share (%), 2029
Figure 3.11 Global Non-Biologics Rheumatoid Arthritis Drugs: Revenue ($m) Forecasts by Segment, 2017-2029
Figure 3.12 Global Non-Biologics Rheumatoid Arthritis Drugs Market by Segment: Share (%), 2018
Figure 3.13 Global Non-Biologics Rheumatoid Arthritis Drugs Market by Segment: Share (%), 2023
Figure 3.14 Global Non-Biologics Rheumatoid Arthritis Drugs Market by Segment: Share (%), 2029
Figure 3.15 NSAIDs for Rheumatoid Arthritis Market Forecast: Revenue ($m), AGR (%), 2017-2029
Figure 3.16 sDMARDs for Rheumatoid Arthritis Forecast: Revenue ($m), AGR (%), 2017-2029
Figure 3.17 Others Drugs Market Forecast: Revenue ($ m), AGR (%), 2017-2029
Figure 4.1 The Main Drugs in the Rheumatoid Arthritis Market: Market Shares (%), 2018
Figure 4.2 Global Humira Market Forecast: Revenue ($m) AGR (%), 2017-2029
Figure 4.3 Global Enbrel Market Forecast: Revenue ($m) AGR (%), 2017-2029
Figure 4.4 Global Remicade Market Forecast: Revenue ($m) AGR (%), 2017-2029
Figure 4.5 Global Rituxan Market Forecast: Revenue ($m) AGR (%), 2017-2029
Figure 4.6 Global Simponi/Simponi Aria Market Forecast: Revenue ($m) AGR (%), 2017-2029
Figure 4.7 Global Orencia Market Forecast: Revenue ($m) AGR (%), 2017-2029
Figure 4.8 Global Actemra/RoActemra Market Forecast: Revenue ($m) AGR (%), 2017-2029
Figure 4.9 Global Cimzia Market Forecast: Revenue ($m) AGR (%), 2017-2029
Figure 4.10 Global Celebrex Market Forecast: Revenue ($m) AGR (%), 2017-2029
Figure 4.11 Global Xeljanz Market Forecast: Revenue ($m) AGR (%), 2017-2029
Figure 4.12 Global Arcoxia Market Forecast: Revenue ($m) AGR (%), 2017-2029
Figure 5.1 World Rheumatoid Arthritis Drugs Market: Revenues ($m) by Region, 2017
Figure 5.2 World Rheumatoid Arthritis Drugs Market: Revenues ($m) by Region, 2018
Figure 5.3 Global Rheumatoid Arthritis Drugs Market Forecast: Revenue ($m), AGR (%), 2017-2029
Figure 5.4 Rheumatoid Arthritis Drugs Market: Market Shares (%) by Regional Market, 2017
Figure 5.5 Rheumatoid Arthritis Drugs Market: Market Shares (%) by Regional Market, 2023
Figure 5.6 Rheumatoid Arthritis Drugs Market: Market Shares (%) by Regional Market, 2029
Figure 6.1 North America Rheumatoid Arthritis Drugs Market Forecast: Revenues ($m), AGR (%), 2017-2029
Figure 6.2 North America Rheumatoid Arthritis Drugs Market: Market Shares (%) by Country, 2017
Figure 6.3 North America Rheumatoid Arthritis Drugs Market: Market Shares (%) by Country, 2023
Figure 6.4 North America Rheumatoid Arthritis Drugs Market: Market Shares (%) by Country, 2029
Figure 6.5 U.S. Rheumatoid Arthritis Drugs Market Forecast: Revenues ($m), AGR (%), 2017-2029
Figure 6.6 Canada Rheumatoid Arthritis Drugs Market Forecast: Revenues ($m), AGR (%), 2017-2029
Figure 7.1 Europe Rheumatoid Arthritis Drugs Market: Revenues ($m) by Country/Sub-region, 2017
Figure 7.2 Europe Rheumatoid Arthritis Drugs Market Forecast: Revenues ($m), AGR (%), 2017-2029
Figure 7.3 Europe Rheumatoid Arthritis Drugs Market: Market Shares (%) by Country, 2017
Figure 7.4 Europe Rheumatoid Arthritis Drugs Market: Market Shares (%) by Country, 2023
Figure 7.5 Europe Rheumatoid Arthritis Drugs Market: Market Shares (%) by Country, 2029
Figure 7.6 Germany Rheumatoid Arthritis Drugs Market Forecast: Revenues ($m), AGR (%), 2017-2029
Figure 7.7 France Rheumatoid Arthritis Drugs Market Forecast: Revenues ($m), AGR (%), 2017-2029
Figure 7.8 U.K. Rheumatoid Arthritis Drugs Market Forecast: Revenues ($m), AGR (%), 2017-2029
Figure 7.9 Italy Rheumatoid Arthritis Drugs Market Forecast: Revenues ($m), AGR (%), 2017-2029
Figure 7.10 Spain Rheumatoid Arthritis Drugs Market Forecast: Revenues ($m), AGR (%), 2017-2029
Figure 7.11 Russia Rheumatoid Arthritis Drugs Market Forecast: Revenues ($m), AGR (%), 2017-2029
Figure 7.12 Rest of Europe Rheumatoid Arthritis Drugs Market Forecast: Revenues ($m), AGR (%), 2017-2029
Figure 8.1 Asia-Pacific Rheumatoid Arthritis Drugs Market Forecast: Revenues ($m), AGR (%), 2017-2029
Figure 8.2 Asia-Pacific Rheumatoid Arthritis Drugs Market: Market Shares (%) by Country, 2017
Figure 8.3 Asia-Pacific Rheumatoid Arthritis Drugs Market: Market Shares (%) by Country, 2023
Figure 8.4 Asia-Pacific Rheumatoid Arthritis Drugs Market: Market Shares (%) by Country, 2029
Figure 8.5 China Rheumatoid Arthritis Drugs Market Forecast: Revenues ($m), AGR (%), 2017-2029
Figure 8.6 Japan Rheumatoid Arthritis Drugs Market Forecast: Revenues ($m), AGR (%), 2017-2029
Figure 8.7 India Rheumatoid Arthritis Drugs Market Forecast: Revenues ($m), AGR (%), 2017-2029
Figure 8.8 Rest of Asia Pacific Rheumatoid Arthritis Drugs Market Forecast: Revenues ($m), AGR (%), 2017-2029
Figure 9.1 Latin America Rheumatoid Arthritis Drugs Market Forecast: Revenues ($m), AGR (%), 2017-2029
Figure 9.2 Latin America Rheumatoid Arthritis Drugs Market: Market Shares (%) by Country, 2017
Figure 9.3 Latin America Rheumatoid Arthritis Drugs Market: Market Shares (%) by Country, 2023
Figure 9.4 Latin America Rheumatoid Arthritis Drugs Market: Market Shares (%) by Country, 2029
Figure 9.5 Brazil Rheumatoid Arthritis Drugs Market Forecast: Revenues ($m), AGR (%), 2017-2029
Figure 9.6 Mexico Rheumatoid Arthritis Drugs Market Forecast: Revenues ($m), AGR (%), 2017-2029
Figure 9.7 Rest of Latin America Rheumatoid Arthritis Drugs Market Forecast: Revenues ($m), AGR (%), 2017-2029
Figure 10.1 Middle East & Africa (MEA) Rheumatoid Arthritis Drugs Market Forecast: Revenues ($m), AGR (%), 2017-2029
Figure 10.2 Middle East & Africa Rheumatoid Arthritis Drugs Market: Market Shares (%) by Country, 2017
Figure 10.3 Middle East & Africa Rheumatoid Arthritis Drugs Market: Market Shares (%) by Country, 2023
Figure 10.4 Middle East & Africa Rheumatoid Arthritis Drugs Market: Market Shares (%) by Country, 2029
Figure 10.5 Saudi Arabia Rheumatoid Arthritis Drugs Market Forecast: Revenues ($m), AGR (%), 2017-2029
Figure 10.6 South Africa Rheumatoid Arthritis Drugs Market Forecast: Revenues ($m), AGR (%), 2017-2029
Figure 10.7 Rest of MEA Rheumatoid Arthritis Drugs Market Forecast: Revenues ($m), AGR (%), 2017-2029
Figure 12.1 AbbVie: Revenue ($m), AGR (%), 2013-2017
Figure 12.2 AbbVie: Business Segment Revenue Share (%), 2017
Figure 12.3 AbbVie: Region Revenue Share (%), 2017
Figure 12.4 Roche: Revenue ($m), AGR (%), 2013-2017
Figure 12.5 Roche: Business Segment Revenue Share (%), 2017
Figure 12.6 Roche: Breakdown of Revenue (%) by Pharmaceuticals Drug, 2017
Figure 12.7 Johnson & Johnson: Revenue ($m), AGR (%), 2013-2017
Figure 12.8 Johnson & Johnson: Business Segment Revenue Share (%), 2017
Figure 12.9 Johnson & Johnson: Region Revenue Share (%), 2017
Figure 12.10 Amgen, Inc.: Revenue ($m), AGR (%), 2013-2017
Figure 12.11 Amgen, Inc.: Revenue by Division, Share (%), 2017
Figure 12.12 Amgen, Inc.: Revenue by Region, Share (%), 2017
Figure 12.13 Pfizer, Inc.: Revenue ($m), AGR (%), 2013-2017
Figure 12.14 Pfizer, Inc.: Business Segment Revenue Share (%), 2017
Figure 12.15 Pfizer, Inc.: National Revenue Share (%), 2017
Figure 12.16 Merck & Co., Inc.: Revenue ($m), AGR (%), 2013-2017
Figure 12.17 Merck & Co., Inc.: Business Segment Revenue Share (%), 2017
Figure 12.18 Merck & Co., Inc.: Region Revenue Share (%), 2017
Figure 12.19 Bristol-Myers Squibb: Revenue ($m), AGR (%), 2013-2017
Figure 12.20 Bristol-Myers Squibb: Segment Revenue Share (%), 2017
Figure 12.21 Bristol-Myers Squibb: National Revenue Share (%), 2017
Figure 12.22 UCB: Revenue ($m), AGR (%), 2013-2017
Figure 12.23 UCB: Business Segment Revenue Share (%), 2017
Figure 12.24 UCB: by Region Revenue Share (%), 2017
Figure 12.25 Eli Lilly and Company: Revenue ($m), AGR (%), 2013-2017
Figure 12.26 Eli Lilly and Company: Business Segment Revenue Share (%), 2017
Figure 12.27 Eli Lilly and Company: by Region Revenue Share (%), 2017
Figure 12.28 Novartis AG: Revenue ($m), AGR (%), 2013-2017
Figure 12.29 Novartis AG: Business Segment Revenue Share (%), 2017
Figure 12.30 Novartis AG: by Region Revenue Share (%), 2017
Figure 12.31 Sanofi: Revenue ($m), AGR (%), 2013-2017
Figure 12.32 Sanofi: Business Segment Revenue Share (%), 2017
Figure 12.33 Sanofi: Region Revenue Share (%), 2017
Figure 14.1 RA Drugs Market: Comparison of Revenue ($m Forecasts for Total Market* and Market for RA Indication, 2017-2029
Figure 14.2 Global Rheumatoid Arthritis Market Forecast: Revenue ($m) 2017, 2023, 2029
Figure 14.3 Global Rheumatoid Arthritis Drugs Market by Drugs Class: Market Share (%), 2018
Figure 14.4 Global Rheumatoid Arthritis Drugs Market by Drugs Class: Market Share (%), 2023
Figure 14.5 Global Rheumatoid Arthritis Drugs Market by Drugs Class: Market Share (%), 2029
Figure 14.6 The Leading Drugs in the RA Market: Revenue ($m) Forecasts, 2017, 2023, 2029
Figure 14.7 The Global Rheumatoid Arthritis Market Forecast by Region: Revenue ($m), 2017, 2023, 2029