Contract manufacturing represents the largest sector of the pharma outsourcing industry. Pharmaceutical companies have sought to take advantage of the benefits of contract manufacturing – lower costs, increased flexibility and external expertise – to focus resources on core competencies in drug development and marketing.
CMOs are increasingly seen as a strategic partner for pharmaceutical companies, providing a one-stop-shop of services for formulation development and manufacturing throughout the lifecycle of a drug.
The market-leading CMOs have grown through acquisitions and site expansions to offer almost all required services on a global scale. However, there is still a role to be played by specialist CMOs, particularly those that offer biological drug manufacturing services.
This updated study discusses market-leading companies worldwide, as well as the strategies they have employed to develop in recent years. Visiongain’s research and analysis explore opportunities and challenges for the top 50 pharma contract manufacturing organisations.
How this report will benefit you
Read on to discover how you can exploit the future business opportunities emerging in this sector.
In this brand new 257-page report you will receive 189 charts– all unavailable elsewhere.
The 257-page report provides clear detailed insight into the leading pharmaceutical contract manufacturing organizations. Discover the key drivers and challenges affecting the market.
By ordering and reading our brand-new report today you stay better informed and ready to act.
Report Scope
• Global Pharmaceutical Contract Manufacturing Market Size in 2017
• Pharmaceutical Contract Manufacturing Market Size in 2017 segmented by national market:
• US
• EU
• China
• Japan
• India
• Brazil
• Russia
• South Korea
• Others
• Discussion and analysis of factors that drive and restrain the pharmaceutical contract manufacturing market
• Profiles of the 50 leading pharmaceutical contract manufacturing organizations:
• AbbVie Contract Manufacturing
• Aenova Group
• Aesica Pharmaceuticals
• Ajinomoto Althea, Inc.
• Albany Molecular Research, Inc.
• Alcami Corporation
• Alkermes plc
• Almac Group
• Amatsigroup
• Aurobindo Pharma Ltd.
• Avid Bioservices Inc.
• Bayer AG
• Baxter Biopharma Solutions
• Biomay AG
• Boehringer Ingelheim GmbH
• Catalent Pharma Solutions Inc.
• Charles River Laboratories International Inc.
• Cardinal Health
• Corden Pharmaceutical
• Daito Pharmaceutical
• Delpharm
• Divis Laboratories Ltd.
• Dr. Reddy’s Laboratories Ltd.
• DPT Laboratories
• Esteve Química
• Evonik Degussa
• Famar Health Care Services
• Fareva
• Fujifilm Diosynth Biotechnologies UK Ltd.
• GlaxoSmithKline plc
• Huapont Medical
• Lonza Group Ltd.
• Nipro Corporation
• Paragon Bioservices Inc
• Patheon Inc
• Pfizer Inc./Pfizer CentreSource (PCS)
• Piramal Healthcare L
• Recipharm A
• Roche
• Royal DSM NV
• Shandong Xinhua Pharmaceutical
• Siegfried
• Teva API
• Therapure Biopharma Inc.
• UPM Pharmaceuticals Inc.
• Vetter Pharmacuticals
• Xcelience LLC
• Xcellerex LLC
• Zhejiang Hisun Pharmaceutical
• Zhejiang Huahai Pharmaceuticals
• The content of each profile differs, depending on the organization. In general, a profile gives the following information:
• Overview of the company’s contract manufacturing services and operations
• Analysis of recent financial performance – annual revenue for CMO services, including some data on operating profit and margins
• Assessment of developments – activities, acquisitions, production capacity, deals, new service offerings and collaborations
• SWOT analysis – a firm’s strengths and weaknesses, as well as opportunities and threats to manufacturing sales growth
Visiongain’s study is intended for anyone requiring commercial analyses for pharmaceutical contract manufacturing market. You find data, trends and predictions.
Buy our report today Pharma Leader Series: Top 50 Pharmaceutical Contract Manufacturing Organisations (CMOs) Market 2018: Financial Performances, Services, Capacities, Mergers & Acquisitions, SWOT Analysis.
Visiongain is a trading partner with the US Federal Government
CCR Ref number: KD4R6
1. Report Overview
1.1 Leading Contract Manufacturing Organizations (CMOs) Overview
1.2 Benefits of This Report
1.3 How This Report Delivers Information
1.4 Main Questions This Report Answers
1.5 Who is This Report For?
1.6 Methods of Research and Analysis
1.7 Frequently Asked Questions (FAQs)
1.8 Some Associated Reports
1.9 About Visiongain
2. Introduction to Pharmaceutical Contract Manufacturing, 2017
2.1 What Services Do Contract Manufacturers Offer?
2.1.1 Why Do Firms Outsource Manufacturing?
2.1.2 What Is Driving Demand for Contract Manufacturing Services?
2.2 The Pharmaceutical Contract Manufacturing Market, 2017
2.2.1 Where is Supply and Demand Highest for Contract Manufacturing Services?
2.3 Driving and Restrictive Forces for Pharmaceutical Contract Manufacturing
2.3.1 Pharmaceutical Contract Manufacturing: Market Drivers
2.3.2 Pharmaceutical Contract Manufacturing: Market Restraints
3. Leading Contract Manufacturing Organizations
3.1 Alcami Corporation – A Contract Development and Manufacturing Organization
3.1.1 Alcami: Manufacturing Services and Capabilities
3.1.2 Divisional Segmentation – Breakdown of Alcami’s Service
3.1.3 Alcami Focuses on Advancing its Analytical Testing Turnaround Time
3.1.4 Alcami Extended its Laboratory Service Program
3.1.5 Alcami: Madison Dearborn Partners
3.1.6 Alcami Expands its Sales Office
3.1.7 Alcami Partnered with Solasia Pharma for Manufacturing Active Pharmaceutical Ingredient
3.2 AbbVie Contract Manufacturing
3.2.1 AbbVie Offers Full-Service Contract Manufacturing
3.2.2 Expanding and Adding New Services: 2017-2018
3.2.3 Biologics and HPAPIs Opportunities for Growth 2017-2028
3.3 Aenova Group
3.3.1 Acquisition of Haupt Creates European CMO Giant
3.3.2 Aenova’s Ever Expanding Manufacturing Capacity
3.3.3 Aenova’s Competitive Position in the Contract Manufacturing Market: SWOT Analysis 2017
3.3.4 Aenova: New Manufacturing Facilities to Expand Geographic Presence
3.4 Aesica Pharmaceuticals
3.4.1 Aesica Manufactures APIs and Finished Dosage Forms
3.4.2 Acquisitions Drive Revenue Growth, 2012-2017
3.4.3 Partnering with Academia for Innovative Solutions
3.4.4 Growth through Acquisitions and Internal Expansion
3.4.5 Aesica: Opportunities for Expansion
3.5 Ajinomoto Althea, Inc.
3.5.1 Ajinomoto Althea Expands its Manufacturing Capabilities
3.5.2 Ajinomoto: New U.S. Patent for Manufacturing Crystal Monoclonal Antibodies
3.5.3 Ajinomoto Althea Expanding its Manufacturing Capacity
3.6 Albany Molecular Research, Inc.
3.6.1 Acquiring New Businesses to Expand Capabilities and Services
3.6.2 Expanding Business Operations in New Geographies
3.6.3 Collaborations to Enhance Services
3.6.4 AMRI Acquisition of Euticals S.p.a
3.7 Alkermes
3.7.1 Collaboration as a Growth Strategy to Develop and Commercialize Products
3.7.2 Alkermes: Clinical Development Program
3.8 Almac Group
3.8.1 Almac’s Manufacturing Services
3.8.2 Almac Adding Capacity Globally
3.8.3 New Services Added 2012-2016
3.8.4 Almac Group: Contract Manufacturing Market Outlook
3.9 Amatsigroup
3.9.1 Amatsi: Contract Manufacturing Agreement
3.9.2 Mergers and Acquisitions to Enhance Market Presence
3.9.3 Amatsigroup Expands its Operations and Product Portfolio
3.10 Aurobindo Pharma
3.10.1 API Manufacturing Services
3.10.2 Aurobindo Pharma: Steady Revenue Growth 2012-2017
3.10.3 Aurobindo Expanding Outside of Antibacterial
3.10.4 Aurobindo: Opportunities for Expansion
3.11 Avid Bioservices, Inc.
3.11.1 Avid Focuses on Expanding its Manufacturing Capacity
3.11.2 Avid Bioservices Selected by Acumen Pharmaceuticals to Lead Process Development and Clinical Manufacture
3.11.3 Avid Bioservices Expands Process Development Capabilities and Laboratory Infrastructure
3.12 Bayer Healthcare AG
3.12.1 Bayer Focuses on Providing Superior Pharmaceutical Services
3.12.2 Bayer Focuses Quality for all the Products and Services Offered by the Company
3.13 Baxter BioPharma Solutions
3.13.1 BioPharma Solutions Offers a Broad Product Portfolio of Sterile Contract Manufacturing Services and Solutions
3.13.2 BioPharma Focuses on Expanding its Manufacturing Capacities
3.13.3 Baxter BioPharma Solutions and SAFC Collaborate on Complete ADC Offering
3.13.4 Baxter BioPharma Solutions Focuses on Research & Development Investments
3.13.5 Baxter BioPharma is the Global Leader in Sterile Fill and Finish
3.13.6 Baxter BioPharma SWOT Analysis
3.14 Biomay AG
3.14.1 Biomay Offers Fully Integrated GMP Capacities
3.14.2 Biomay Focuses on Increasing its Capital
3.15 Boehringer Ingelheim Contract Manufacturing
3.15.1 Expanding Biopharmaceuticals Manufacturing Services in China
3.15.2 Production Through to Fill and Finished Biopharmaceuticals
3.15.3 A Track Record of Production for 29 Biopharma Products
3.15.4 Increasing Revenue from Contract Manufacturing, 2012-2017
3.15.5 Pulling Out of Small Molecule API Manufacturing
3.15.6 Expanding through New Services
3.15.7 Boehringer Ingelheim Biopharmaceuticals: Opportunities for Growth
3.16 Catalent Pharma Solutions - the World’s Leading CMO
3.16.1 Catalent: Manufacturing Services and Capabilities
3.16.2 Divisional Segmentation –Catalent’s Service
3.16.3 Catalent Pharma’s Revenue Growth, 2012-2017
3.16.4 Catalent Is Expanding its Soft Gel Technologies Division
3.16.5 Quadrupling Biopharmaceutical Manufacturing Capacity
3.16.6 Expansion of Packaging Services in Asia-Pacific and Europe: 2015
3.16.7 Adding New Early-Stage Development Services
3.16.8 Expansion in Japan – Growth Prospects for Catalent
3.16.9 New Business Contracts 2014-2016
3.16.10 Catalent: Opportunities for Growth
3.17 Charles River Laboratories International, Inc.
3.17.1 Charles River Laboratories Focuses on Increasing the Service Areas of its Offerings
3.17.2 Strategic Acquisitions as a Growth Strategy to Expand Product Portfolio
3.17.3 Charles River Laboratories Revenue Growth, 2012-2017
3.18 Cardinal Health, Inc.
3.18.1 Cardinal Health Focuses on Helping Healthcare Organizations for Patient Safety
3.18.2 Cardinal Revenue Growth, 2012-2017
3.19 CordenPharma International
3.19.1 CordenPharma Service Division
3.19.2 CordenPharma Emerging in the API Market
3.19.3 Investments in Highly Potent Capabilities
3.19.4 CordenPharma: SWOT Analysis
3.20 Daito Pharmaceutical Co., Ltd.
3.20.1 Daito Has a Portfolio of More than 43 APIs
3.20.2 Rapid Growth in Revenue and Operational Profit: Daito Financial Performance 2012-2017
3.20.3 Daito Is Well-Placed for Asian Market Growth – SWOT Analysis
3.21 Delpharm
3.21.1 Finished Dosage Form Manufacturing for Developed Markets
3.21.2 Delpharm: Rapid Revenue Growth Via Acquisitions, 2012-2017
3.21.3 Delpharm: Outlook and Prospects for Growth
3.22 Divis Laboratories
3.22.1 Divis Laboratories and the Contract Manufacturing Industry
3.22.2 Divis Laboratories: A Rapidly Growing CMO, 2012-2017
3.22.3 Divis Laboratories: API Manufacturing
3.23 Dr. Reddy’s Laboratories Ltd.
3.23.1 API and FDF Manufacturing Services
3.23.2 Dr. Reddy’s PSAI: Strong Revenue Growth 2012-2017
3.23.3 Advancing in Complex Drug Manufacturing
3.23.4 Expanding in the European Manufacturing Market
3.24 DPT Laboratories, Ltd.
3.24.1 Mylan Acquires Topicals-Focused Specialty and Generic Business of DPT
3.24.2 DPT Enhances Flexibility and Efficiencies
3.24.3 DPT Enhances Capabilities with New High-Speed Filling Center
3.25 Esteve Qu`mica
3.25.1 Esteve Química Manufactures APIs for Developed and Emerging Markets
3.25.2 Expanding in the US, 2016
3.25.3 Esteve Química: SWOT Analysis
3.26 Evonik Degussa
3.26.1 Investing in API and Drug Delivery Services
3.26.2 Moderate Growth in Pharmaceutical Manufacturing Services, 2012-2017
3.26.3 Evonik Is a HPAPI Specialist
3.26.4 Evonik Continues to Grow Across All Segments
3.26.5 How Can Evonik Expand in the Pharmaceutical Contract Manufacturing Market?
3.27 FAMAR Health Care Services
3.27.1 Famar Is an Expert in Lyophilisation
3.27.2 Sustained Growth in Famar’s Revenue: 2011-2016
3.27.3 Expanding Outside Europe
3.27.4 Further Site Acquisitions Are an Opportunity for Growth
3.28 Fareva Group
3.28.1 Fareva Has 35 Years’ Manufacturing Experience
3.28.2 Revenue Growth through Acquisitions: 2012-2017
3.28.3 Fareva SWOT Analysis
3.29 FUJIFILM Diosynth Biotechnologies U.S.A., Inc.
3.29.1 Opening of New Manufacturing facility
3.29.2 Fujifilm Establishes Cell Culture Process Development Laboratories
3.29.3 Fujifilm Completes Acquisition of Kalon Biotherapeutics LLC
3.30 GlaxoSmithKline plc
3.30.1 GSK Enters into an Agreement with Novartis for Full Ownership of Consumer Healthcare Business
3.30.2 GSK Received Complete Response from FDA for Candidate Pandemic H5N1 Adjuvanted Influenza Vaccine
3.31 Pfizer CentreOne
3.31.1 Pfizer CentreSource: Historic Revenue Performance, 2012-2017
3.31.2 Will Hospira Acquisition Lead to Revenue Growth in Future?
3.32 Huapont Pharmaceutical Co., Ltd.
3.32.1 China Pharmaceutical Trade
3.33 Lonza
3.33.1 Lonza Is a Leader in Biologics Manufacturing
3.33.2 Lonza Contract Manufacturing and Development: 2012-2017
3.33.3 Investing in Advanced Biological Drug Sectors
3.33.4 The Promise of Antibody-Drug Conjugates (ADCs)
3.33.5 The Regenerative Medicine Future in Japan
3.33.6 Lonza: SWOT Analysis
3.34 Nipro Corporation: Japan’s Leading CMO
3.34.1 Nipro Pharmaceutical Contract Manufacturing Capabilities
3.34.2 Nipro Revenues 2012-2017
3.34.3 Biosimilars and Anti-Cancer Drugs Are Opportunities for Future Growth: SWOT Analysis
3.35 Paragon Bioservices, Inc.
3.35.1 Paragon Announced Expansion of its New Manufacturing Facility
3.36 Patheon – One of the Top 3 CMOs
3.36.1 Patheon – Global leader in Pharmaceutical Development Services
3.36.2 Contract Manufacturing Services at Patheon
3.36.3 Steady Revenue Growth 2012-2017
3.36.4 DPx Holdings: Developments
3.36.5 Adding New Formulations and Formulation Development Services
3.36.6 Expanding Services Through Acquisition, 2016
3.36.7 Patheon: SWOT Analysis
3.37 Recipharm
3.37.1 Contract Development and Manufacturing Services
3.37.2 Recipharm: Financial Performance 2012-2017
3.37.3 Recipharm Invests in Facility Expansion
3.37.4 Recipharm Growing in the Development and Technology Market Through Acquisitions
3.37.5 Recipharm: SWOT Analysis
3.38 F. Hoffman-La Roche Ltd.
3.38.1 Amplified Revenue Growth in Pharma Manufacturing 2012-2017
3.38.2 Value of Innovation
3.38.3 Approvals and Extensions in Pharmaceuticals Division
3.38.4 Launch of New Products Drive the Growth of the Company
3.39 Royal DSM
3.39.1 Amplified Revenue Growth in Pharma Manufacturing 2012-2017
3.39.2 DSM Pharmaceuticals Products/DPx Holdings: Manufacturing Services
3.39.3 DSM Sinochem Pharmaceuticals: A World Leader in Antibacterial Manufacturing
3.39.4 DPx Holdings: A New Pharma Leader
3.39.5 Investing in Biopharma Manufacturing
3.39.6 Expanding API Manufacturing
3.39.7 Generics and Biologics Offer Room for Growth
3.40 Shandong Xinhua Pharmaceutical
3.40.1 Experience in APIs and Finished Dosage Forms
3.40.2 Shandong Xinhua: Strong Revenue Growth 2012-2017
3.40.3 Growing through Joint Ventures
3.40.4 Looking to Expand in the US and EU
3.41 Siegfried
3.41.1 Siegfried’s Acquisitions, 2012-2017
3.41.2 Expanding Siegfried’s Manufacturing Footprint Globally
3.41.3 Expanding High Potency API Capabilities
3.41.4 Siegfried: Financial Performance 2012-2017
3.41.5 Siegfried’s Characteristics within the Contract Manufacturing Market: SWOT Analysis
3.42 TEVA Pharmaceutical, Ltd.
3.42.1 API Manufacturing Services
3.42.2 Teva API: Financial Performance 2012-2017
3.42.3 Building a Footprint in Mexico, India and China
3.42.4 Teva API: SWOT Analysis
3.43 Therapure Biopharma, Inc.
3.43.1 Therapure Collaborated with 3SBio Inc., and CPE Funds
3.44 UPM Pharmaceuticals
3.45 Vetter Pharmaceutical
3.45.1 Vetter is an Injectable Manufacturing Specialist
3.45.2 Services, Collaborations and Differentiating Factors
3.45.3 Expanding Services in the US and Asia
3.45.4 Biologics: Opportunity for Growth for Vetter
3.46 Xcelience, LLC
3.47 Xcellerex, Inc.
3.48 Piramal Pharma Solutions
3.48.1 Mergers and Acquisitions
3.48.2 Piramal Pharma Solutions: Financial Performance 2012-2017
3.48.3 Investment in Technology-based Delivery Platforms
3.48.4 Quality Governance
3.49 Zhejiang Hisun Pharmaceutical
3.49.1 API Manufacturing for Markets Worldwide
3.49.2 Moving into International Drug Marketing
3.49.3 Zhejiang Hisun: Opportunities for Growth
3.50 Zhejiang Huahai Pharmaceuticals
3.50.1 Zhejiang Huahai is a Market Leader Within the Antihypertensive API Market
3.50.2 Zhejiang Huahai: Contract Manufacturing Performance 2012-2017
3.50.3 Expanding in the US Generic Drugs Market
3.50.4 Zhejiang Huahai: SWOT Analysis
4. Conclusions of the Study
4.1 What Has Driven Growth for CMO Market Leaders in Recent Years?
4.2 Strategies for Growth: Prospects for Leading CMOs
4.3 High Demand for Biopharmaceutical Manufacturing Services
4.4 Investing in Novel Technologies
4.5 Outlook for API Manufacturers
Appendices
Some Associated Visiongain Reports
Visiongain Report Sales Order Form
About Visiongain
Visiongain Report Evaluation Form
List of Tables
Table 2.1 Benefits and Drawbacks to Outsourcing Pharmaceutical Manufacturing, 2017
Table 2.2 Contract Manufacturing Market Total Revenue: Total Revenue ($bn), Annual Growth (%), 2015-2017
Table 2.3 Contract Manufacturing Market by Leading Country: Market Size ($bn), Market Share (%), 2017
Table 3.1 Alcami Details, 2017
Table 3.2 Alcami Facility Details, 2017
Table 3.3 AbbVie Contract Manufacturing: Details, 2017
Table 3.4 AbbVie Contract Manufacturing Facility Capabilities, 2017
Table 3.5 AbbVie Contract Manufacturing SWOT Analysis, 2017
Table 3.6 Aenova Group Details, 2017
Table 3.7 Aenova Group Manufacturing Capacity by Dosage Form, 2017
Table 3.8 Aenova Group Manufacturing Facility Details, 2017
Table 3.9 Aenova Group SWOT Analysis, 2017
Table 3.10 Aesica Details, 2017
Table 3.11 Aesica Pharmaceuticals: Revenue ($m), Operating Profit ($m), Operating Margin (%), Annual Growth Rates (%), CAGRs (%), 2012-2017
Table 3.12 Aesica SWOT Analysis, 2018
Table 3.13 Ajinomoto Althea, Inc. Details, 2017
Table 3.14 Albany Molecular Research, Inc. Details, 2017
Table 3.15 Alkermes Details, 2017
Table 3.16 Almac Details, 2017
Table 3.17 Almac Pharmaceutical Manufacturing Facilities Details, 2017
Table 3.18 Almac: SWOT Analysis, 2017
Table 3.19 Amatsigroup Details, 2017
Table 3.20 Aurobindo Pharma Details, 2016
Table 3.21 Aurobindo Contract Manufacturing: Revenue ($m), Annual Growth Rate (%), CAGR (%), 2012-2017
Table 3.22 Aurobindo Contract Manufacturing: SWOT Analysis, 2017
Table 3.23 Avid Bioservices, Inc. Details, 2017
Table 3.24 Bayer Healthcare AG Details, 2017
Table 3.25 Baxter BioPharma Solutions Details, 2017
Table 3.26 Baxter BioPharma Solutions: Facilities and Services Offered, 2016
Table 3.27 Baxter BioPharma Solutions SWOT Analysis, 2017
Table 3.28 Biomay AG Details, 2017
Table 3.29 Boehringer Ingelheim Biopharmaceuticals Details, 2017
Table 3.30 Boehringer Ingelheim Total Pharmaceutical Manufacturing Capacity: Reactor Size and Number of Units by CMO Service, 2017
Table 3.31 Products Developed by Boehringer Ingelheim Biopharmaceuticals, 1983-2014
Table 3.32 Boehringer Ingelheim Pharmaceutical Manufacturing: Revenue ($m), Annual Growth (%), CAGR (%), 2012-2017
Table 3.33 Boehringer Ingelheim: SWOT Analysis, 2017
Table 3.34 Catalent Details, 2017
Table 3.35 Catalent Facility Details, 2017
Table 3.36 Catalent Financial Performance: Revenue ($m), Annual Growth Rates (%), CAGR (%), 2012-2017
Table 3.37 Catalent Financial Performance by Product Type: Revenue ($m), Revenue Share (%), 2017
Table 3.38 Catalent Pharma SWOT Analysis, 2017
Table 3.39 Charles River Laboratories International, Inc. Details, 2017
Table 3.40 Charles River Financial Performance: Revenue ($m), Annual Growth Rates (%), CAGR (%), 2012-2017
Table 3.41 Cardinal Health, Inc. Details, 2017
Table 3.42 Cardinal Health Financial Performance: Revenue ($b), Annual Growth Rates (%), CAGR (%), 2012-2017
Table 3.43 CordenPharma International Details, 2017
Table 3.44 CordenPharma Facilities and Service Details, 2017
Table 3.45 CordenPharma SWOT Analysis, 2017
Table 3.46 Daito Pharmaceutical: Details, 2017
Table 3.47 Daito Pharmaceuticals Financial Performance: Revenue ($m), Revenue (¥m), CAGR (%), 2012-2017
Table 3.48 Daito Pharmaceuticals SWOT Analysis, 2017
Table 3.49 Delpharm Details, 2017
Table 3.50 Delpharm: Facilities and Services, 2017
Table 3.51 Delpharm: Revenue ($m), Annual Growth Rate (%), CAGR (%), 2012-2017
Table 3.52 Delpharm: SWOT Analysis, 2017
Table 3.53 Divis Laboratories Details, 2017
Table 3.54 Divis Laboratories: Facility Details, Production Capacity and Services, 2017
Table 3.55 Divis Laboratories: Revenue ($m), Annual Growth Rate (%), CAGR (%), 2012-2017
Table 3.56 Divis Laboratories Revenue Distribution: Revenue ($m), Share of Total (%), 2017
Table 3.57 Divis Laboratories Revenue by Region: Revenue ($m), Share of Total (%), 2017
Table 3.58 Divis Laboratories Contract Manufacturing: SWOT Analysis, 2017
Table 3.59 Dr. Reddy’s Laboratories Ltd. Details, 2017
Table 3.60 Dr. Reddy’s Laboratories Cumulative Drug Master File (DMF) Applications: Applications Accepted by Region, Regional Share (%), 2017
Table 3.61 Dr. Reddy’s Laboratories Contract Manufacturing: Revenue ($m), Annual Growth Rate (%), CAGR (%), 2012-2017
Table 3.62 Dr. Reddy’s Laboratories: Contract Manufacturing Revenue ($m) by Regional Market and Revenue Share (%), FY 2017
Table 3.63 Dr. Reddy’s Laboratories: SWOT Analysis, 2017
Table 3.64 DPT Laboratories Ltd. Details, 2017
Table 3.65 Esteve Química Details, 2017
Table 3.66 Esteve Química SWOT Analysis, 2017
Table 3.67 Evonik Degussa Details, 2017
Table 3.68 Evonik Health and Nutrition: R&D and Production Sites by Region, 2017
Table 3.69 Evonik Pharmaceutical Manufacturing: Revenue ($m), Annual Growth (%), CAGR (%), 2012-2017
Table 3.70 Evonik Pharmaceutical Manufacturing: SWOT Analysis, 2017
Table 3.71 Famar Details, 2017
Table 3.72 Famar Pharmaceutical Manufacturing Facilities, 2017
Table 3.73 Famar Pharmaceutical Manufacturing: Revenue ($m), Annual Growth Rate (%), CAGR (%), 2011-2016
Table 3.74 Famar: SWOT Analysis, 2017
Table 3.75 Fareva Details, 2016
Table 3.76 Fareva Manufacturing Facilities, 2017
Table 3.77 Fareva Pharmaceutical Manufacturing: Revenue ($m), Annual Growth Rate (%), CAGR (%), 2012-2017
Table 3.78 Fareva: SWOT Analysis, 2017
Table 3.79 FUJIFILM Diosynth Biotechnologies U.S.A., Inc. Details, 2017
Table 3.80 GlaxoSmithKline plc Details, 2017
Table 3.81 Pfizer CentreOne Details, 2017
Table 3.82 Pfizer CentreSource: Revenue ($m), Annual Growth Rate (%), CAGR (%), 2012-2017
Table 3.83 Pfizer CentreOne SWOT Analysis, 2017
Table 3.84 Huapont Pharmaceutical Co., Ltd. Details, 2017
Table 3.85 Lonza Details, 2017
Table 3.86 Selected Lonza Pharmaceutical and Biotech Manufacturing and Development Agreements, 2010-2015
Table 3.87 Lonza Pharma & Biotech Department: Revenue ($m), 2012-2018
Table 3.88 ADCs Approved and in Late Stage Clinical Development, 2014
Table 3.89 Lonza SWOT Analysis, 2017
Table 3.90 Nipro Pharma Details, 2017
Table 3.91 Nipro Pharmaceutical Contract Manufacturing Capabilities: 2012-2017
Table 3.92 Nipro Pharmaceutical Contract Manufacturing: Annual Production Capacity, 2017
Table 3.93 Nipro Pharmaceutical Contract Manufacturing Financial Performance: Revenue ($m), Annual Growth Rates (%), CAGR (%), 2012-2017
Table 3.94 Nipro Pharmaceutical Contract Manufacturing SWOT Analysis, 2017
Table 3.95 Paragon Bioservices, Inc. Details, 2017
Table 3.96 Patheon Details, 2017
Table 3.97 Patheon Manufacturing Facilities, 2017
Table 3.98 Patheon Pharmaceutical Manufacturing: Revenue ($m), Annual Growth Rates (%), CAGRs (%), 2012-2017
Table 3.99 Patheon: SWOT Analysis, 2017
Table 3.100 Recipharm Details, 2017
Table 3.101 Recipharm: Facility Details and Services, 2017
Table 3.102 Recipharm: Revenue ($m), Annual Growth Rates (%), CAGRs (%), 2012-2017
Table 3.103 Recipharm Manufacturing Revenue by Client Size: Revenue ($m), Share of Total Revenues (%), 2017
Table 3.104 Recipharm Manufacturing Revenue Distribution: Customer Revenue ($m), Share of Total Revenues (%), 2017
Table 3.105 Recipharm: SWOT Analysis, 2017
Table 3.106 F. Hoffman-La Roche Details, 2017
Table 3.107 Roche Pharmaceutical Manufacturing: Revenue ($bn), Annual Growth (%), CAGR (%) 2012-2017
Table 3.108 Royal DSM Details, 2017
Table 3.109 Royal DSM Pharmaceutical Manufacturing: Revenue ($m), Annual Growth (%), CAGR (%) 2012-2017
Table 3.110 DSM Pharmaceutical Products (DPP)/DPx Holdings Division: Revenue ($m), Annual Growth (%), CAGR (%), 2011-2016
Table 3.111 DSM Sinochem Pharmaceuticals (DSP): Revenue ($m), Annual Growth (%), CAGR (%), 2012-2017
Table 3.112 DSM Pharmaceutical Manufacturing: SWOT Analysis, 2017
Table 3.113 Shandong Xinhua Pharmaceuticals Details, 2017
Table 3.114 Shandong Xinhua Pharmaceutical Production Capacity by Dosage Form, 2017
Table 3.115 Shandong Xinhua: Revenue ($m), Annual Growth Rate (%), CAGR (%), 2012-2017
Table 3.116 Shandong Xinhua Revenue Share by Geographic Region: Revenue Share (%), 2017
Table 3.117 Shandong Xinhua Manufacturing: SWOT Analysis, 2017
Table 3.118 Siegfried Details, 2017
Table 3.119 Siegfried Pharmaceutical Manufacturing Facilities Details, 2017
Table 3.120 Siegfried Pharmaceutical Manufacturing: Revenue ($m), Annual Growth Rates (%), CAGRs (%), 2012-2017
Table 3.121Siegfried: SWOT Analysis, 2017
Table 3.122 Teva API Details, 2017
Table 3.123 Teva API: Revenue ($m), Annual Growth Rate (%), CAGR (%), 2012-2017
Table 3.124 Teva API SWOT Analysis, 2017
Table 3.125 Therapure Biopharma Details, 2017
Table 3.126 UPM Pharmaceuticals Details, 2017
Table 3.127 Vetter Details, 2017
Table 3.128 Vetter Pharmaceutical Facilities, 2017
Table 3.129 Vetter: SWOT Analysis, 2017
Table 3.130 Xcelience LLC Details, 2017
Table 3.131 Xcellerex, Inc. Details, 2017
Table 3.132 Piramal Pharma Solutions Details, 2017
Table 3.133 Piramal Pharma Solutions: Revenue ($m), Annual Growth Rate (%), CAGR (%), 2012-2017
Table 3.134 Zhejiang Hisun Pharmaceuticals Details, 2017
Table 3.135 Zhejiang Hisun Manufacturing: SWOT Analysis, 2017
Table 3.136 Zhejiang Huahai Pharmaceuticals Details, 2017
Table 3.137 Zhejiang Huahai Contract Manufacturing: Revenue ($m), Annual Growth Rate (%), CAGR (%), 2012-2017
Table 3.138 Zhejiang Huahai Contract Manufacturing: SWOT Analysis, 2017
Table 4.1 Top Five Developed and Emerging Market CMOs: Grouped Revenue ($m), Annual Growth Rate (%), CAGR (%), 2012-2017
List of Figures
Figure 2.1 Selected Services Contracted to CMOs by Developmental Stage, 2017
Figure 2.2 Contract Manufacturing Market Total Revenue: Total Revenue ($bn), 2015-2017
Figure 2.3 Contract Manufacturing Market by Leading Country: Market Share (%), 2017
Figure 2.4 Pharmaceutical Contract Manufacturing: Drivers and Restraints
Figure 3.1 Aesica Pharmaceuticals: Revenue ($m), 2012-2017
Figure 3.2 Aurobindo Contract Manufacturing: Revenue ($m), 2012-2017
Figure 3.3 Boehringer Ingelheim Pharmaceutical Manufacturing: Revenue ($m), 2012-2017
Figure 3.4 Catalent Facilities by Region, 2017
Figure 3.5 Catalent Facilities by Service Offered, 2017
Figure 3.6 Catalent Financial Performance: Revenue ($m), 2012-2017
Figure 3.7 Catalent Financial Performance by Product Type: Revenue Share (%), 2017
Figure 3.7 Charles River Laboratories Financial Performance: Revenue ($m), 2012-2017
Figure 3.8 Cardinal Health Financial Performance: Revenue ($b), 2012-2017
Figure 3.9 Daito Pharmaceuticals Financial Performance: Revenue ($m), 2012-2017
Figure 3.10 Delpharm: Revenue ($m), 2012-2017
Figure 3.11 Divis Laboratories Contract Manufacturing: Revenue ($m), 2012-2017
Figure 3.12 Divis Laboratories Revenue Distribution: Revenue ($m), 2017
Figure 3.13 Divis Laboratories Revenue by Region: Share of Total (%), 2017
Figure 3.14 Dr. Reddy’s Laboratories Cumulative Drug Master File (DMF) Applications: Accepted by Region (%), 2017
Figure 3.15 Dr. Reddy’s Laboratories Contract Manufacturing: Revenue ($m), 2012-2017
Figure 3.16 Dr. Reddy’s Laboratories Contract Manufacturing Revenue: Regional Revenue Share (%), FY 2017
Figure 3.17 Evonik Health and Nutrition: R&D and Production Sites (%) by Region, 2017
Figure 3.18 Evonik Pharmaceutical Manufacturing: Revenue ($m), 2012-2017
Figure 3.19 Famar Pharmaceutical Manufacturing: Revenue ($m), 2011-2016
Figure 3.20 Fareva Pharmaceutical Manufacturing: Revenue ($m), 2012-2017
Figure 3.21 Pfizer CentreOne: Revenue ($m), 2012-2017
Figure 3.22 Lonza Pharma & Biotech: Revenue ($m), 2012-2018
Figure 3.23 Lonza Custom Manufacturing by Regional Market: Revenue Share (%), 2017
Figure 3.24 Nipro Pharmaceutical Contract Manufacturing Capabilities: Orally Administered Drugs, Injectables, External Preparations, 2012-2017
Figure 3.25 Nipro Pharmaceuticals Financial Performance: Revenue ($m), 2012-2017
Figure 3.26 Patheon Pharmaceutical Development Projects (%) by Phase, 2017
Figure 3.27 Patheon Pharmaceutical Manufacturing Projects by Client Size: Proportion of Total Revenue (%), 2017
Figure 3.28 Patheon Pharmaceutical Manufacturing: Revenue ($m), 2012-2017
Figure 3.29 Recipharm: Revenue ($m), 2012-2017
Figure 3.30 Recipharm Manufacturing Revenue by Client: Share of Total Revenues (%), 2017
Figure 3.31 Recipharm Manufacturing Revenue Distribution: Customer Revenue ($m), 2017
Figure 3.32 Roche Pharmaceutical Manufacturing: Revenue ($b), 2012-2017
Figure 3.33 Royal DSM Pharmaceutical Manufacturing: Revenue ($m), 2012-2017
Figure 3.34 DSM Pharmaceutical Products (DPP)/ DPx Holdings Division: Revenue ($m), 2011-2016
Figure 3.35 DSM Sinochem Pharmaceuticals (DSP): Revenue ($m), 2012-2017
Figure 3.36 Shandong Xinhua: Revenue ($m), 2012-2017
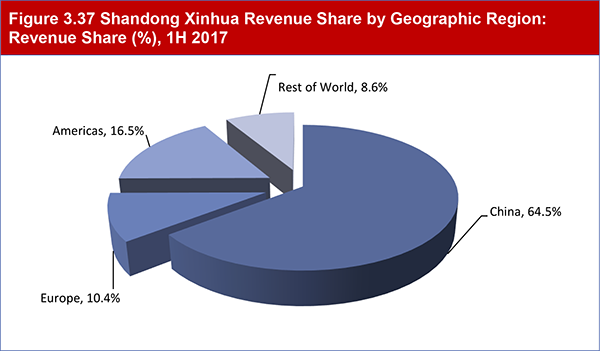
Figure 3.37 Shandong Xinhua Revenue Share by Geographic Region: Revenue Share (%), 1H 2017
Figure 3.38 Siegfried Pharmaceutical Manufacturing: Revenue ($m), 2012-2017
Figure 3.39 Teva API: Revenue ($m), 2012-2017
Figure 3.40 Piramal Pharma Solutions: Revenue ($m), 2012-2017
Figure 3.41 Zhejiang Huahai Contract Manufacturing: Revenue ($m), 2012-2017
Figure 4.1 Top Five Developed and Emerging Market CMOs: Grouped Revenue ($m), 2012-2017
3SBio Inc.
Abbott
AbbVie
Accucaps Industries Limited
Acorda
Activa Capital
Acumen Pharmaceuticals, Inc.
AdAlta
Adamas Pharmaceuticals
Aenova Group
Aesica Pharmaceuticals
Agennix
Agere Pharmaceuticals
Ajinomoto Althea, Inc.
Albany Molecular Research, Inc.
Alcami Corporation
Alkermes plc
Alliance Medical Products (AMP)
Almac Group
Althea Technologies Inc.
Amatsigroup
AmatsiQBiologicals
AMYRA Biotech
Apexigen
arGEN-X
Astellas Pharma
AstraZeneca
Athera Biotechnologies
Aurobindo Pharma Ltd.
Avalanche Biotechnologies
Avepharm
Avid Bioservices Inc.
Avogadro
Banner Life Sciences
Baxter Biopharma Solutions
Bayer AG
BC Partners
Biogen
Biomay AG
Bionomics
Biotest
Boehringer Ingelheim BioXcellence
Boehringer Ingelheim GmbH
Breckenridge Pharmaceutical
Bristol-Myers Squibb
Cambridge Major Laboratories, Inc.
Carbogen Amcis
Cardinal Health
Catalent Pharma Solutions Inc.
Catalyst Capital Group, Inc.
Celladon
Celldex Therapeutics
Celsion
CEVEC Pharmaceuticals
Charles River Laboratories International Inc.
Chemisch-Pharmazeutisches Laboratorium Ravensburg
Chemtrix
Chongqing Huapont Pharmaceutical Co., Ltd.
Circadian Technologies
CITICPE
Cleveland BioLabs
Cobra Biomanufacturing
Consort Medical
Corden Pharmaceutical
Corvette
CPE Funds
Daiichi Sankyo
Daito Pharmaceutical
DBI
Delmas Perfusion
Delpharm
Divis Laboratories Ltd.
DPT Laboratories
DPX Holdings
Dr. Reddy’s Laboratories Ltd.
Dragenopharm Apotheker Püschl
DSM Pharmaceutical Products (DPP)
Eagle Pharmaceuticals
Eclipse Therapeutics
Eisai
Ekkio Capital
Eli Lilly
EmulTech
Enzon Pharmaceuticals
Esteve Química
Euro Vital Pharma
Eurofins Amatsigroup
Euticals
Evonik
Exelixis
Famar Health Care Services
Fareva
Flamel Technologies
Frazier Healthcare
Fujifilm Diosynth Biotechnologies UK Ltd.
Gadea Pharmaceutical Group
Gallus BioPharmaceuticals
Genzyme
GlaxoSmithKline (GSK)
Hameln Pharmaceuticals GmbH
Hameln RDS GmbH
Haupt Pharma
Hospira, Inc.
Huapont Medical
Human Genome Sciences
Icagen, Inc.
Immune Pharmaceuticals
Immunomedics
Index Ventures
Indoco Remedies
Intellect Neurosciences
International Chemical Investors Group (ICIG)
IRIX Pharmaceuticals
Janssen
JK Pharmaceutical
JLL Partners
Johnson & Johnson (J&J)
KWS BioTest Limited
Laboratoire Aguettant
Laboratoires Besins
Lanxess Corporation
Lonza Group Ltd.
Lusomedicamenta
Madison Dearborn Partners, LLC (MDP)
Marine Ingredients
Marinopoulos Group
Merck KGaA
Mesoblast
Micron Technologies
Molecular Partners
Mundipharma
Mylan
New York Center for Nanomedicine Research (NYCNMR)
NIH CRM
Nikon
Nipro Corporation
Novozymes
Octane
OncoMed Pharmaceuticals
OPKO Health. Inc.
Opthea
Orpegen Peptide Chemicals GmbH
Osiris Therapeutics
Paragon Bioservices Inc
Patheon Inc
Pfizer
Pfizer CentreOne
Pfizer Inc./Pfizer CentreSource (PCS)
Pharmacia (now Pfizer)
Pharmacyclis
Pharmatek Laboratories, Inc.
Piramal
Piramal Healthcare L
Precision Ocular Ltd
Prime European Therapeuticals S.p.A
Progenics Pharmaceuticals
Propanc Health Group
Q-Biologicals
R5 Pharmaceuticals
Ranbaxy
Recipharm A
Regeneus
Relthy Laboratórios
Relypsa
Renaissance Acquisition Holdings, LLC
Rexim
Roche
Royal DSM
Sandoz
Sanofi
Schering (now Bayer)
Seattle Genetics
Sentry BioPharma Services
Servier
Shandong Tianda Biological Pharmaceutical
Shandong Xinhua Pharmaceutical
Siegfried
Sigma-Aldrich
Sigmar Italia
Sinopharm
Solasia Pharma
Solvay
SurModics
Swedish Orphan Biovitrium AB (Sobi)
Swiss Caps
Syntex (now Roche)
Takeda
Temmler Group
Tessenderlo Group
Teva
The Carlyle Group
Therapure Biopharma Inc.
TL Biopharmaceuticals Ltd
Tohoku Nipro Pharmaceutical Corporation
Tunitas Therapeutics
UCB
UMN Pharma
UPM Pharmaceuticals Inc.
Valerion Therapeutics
Vetter Pharmacuticals
Virbac
Whitehouse Analytical Laboratories, LLC.
WindRose
Xcelience LLC
Xcellerex LLC
Xinhua Pharmaceutical (Gaomi) Company
XOMA
Yiwu Huayi Fine Chemical Co.
Zhejiang Hisun Pharmaceutical
Zhejiang Huahai Pharmaceuticals
Zhejiang Jiang Yuan Tang
Zumutor
ZYMtronix
List of Organizations Mentioned in the Report
Agence Nationale de sécurité du Médicament et des produits de santé (ANSM)
Agência Nacional de Vigilância Sanitária (ANVISA)
Biomedical Advanced Research and Development Authority (BARDA)
Cardinal Health Foundation
Eindhoven University of Technology
FDA
Générique Même Médicament (GEMME)
Health Canada
International Chemical Investors Group (ICIG)
MHRA
Queens University Belfast
Sanquin Blood Supply Foundation
University College London (UCL)
University of Bradford
University of Durham
University of Leeds