Industries > Pharma > Pharma Leader Series: Top 25 Ophthalmic Drug Manufacturers 2018-2028
Pharma Leader Series: Top 25 Ophthalmic Drug Manufacturers 2018-2028
Retinal Disorder Drugs, Allergic, Inflammatory & Infective Drugs, Glaucoma Drugs, Dry Eye Drugs
The global ophthalmic drugs market was valued at $23bn in 2017. The market was dominated by the Retinal Disorder drug submarket which held 39.1% of the global ophthalmic drugs market.
How this report will benefit you
Read on to discover how you can exploit the future business opportunities emerging in this sector.
In this brand new 223-page report you will receive 83 tables and 71 figures– all unavailable elsewhere.
The 223-page report provides clear detailed insight into the top ophthalmic drugs manufacturers. Discover the key drivers and challenges affecting the market.
By ordering and reading our brand-new report today you stay better informed and ready to act.
Report Scope
• Global ophthalmic drugs market revenue forecasts from 2018-2028
• Global ophthalmic drugs market revenue orecasts from 2018-2028, by submarket:
• Retinal Disorder Drugs
• Allergic, Inflammatory & Infective Drugs
• Glaucoma Drugs
• Dry Eye Drugs
• Other Ophthalmic Drugs
• Revenue forecasts from 2018-2028 of the leading ophthalmic drugs:
• Alphagan
• Avastin
• Azopt
• Eylea
• Lucentis
• Lumigan & Ganfort
• Other Ophthalmic Drugs
• Restasis
• Vigamix
• Xalatan/Xalacom
• Our study discusses the selected leading companies that are the major players in the ophthalmic drugs industry:
• Acucela
• Akorn
• Alimera Sciences
• Allergan
• Amakem
• Bayer
• Chengdu Kanghong
• EyeGate Pharmaceuticals
• Gene Signal
• Icon Biosciences
• MacuCLEAR
• Neurotech
• Novartis
• Omeros
• Ophthotech
• Otsuka Pharmaceutical
• Pfizer
• pSivida Corp.
• Regeneron
• Roche
• Santen
• Senju
• Shire
• ThromboGenics
• Valeant
• Our report provides an overview, revenue forecast from 2018-2028 of the ophthalmic drugs segment, revenue forecast from 2018-2028 of the leading drugs, product pipeline and SWOT Analysis, for these companies:
• Akorn
• Alcon
• Allergan
• Bausch & Lomb
• Bayer
• Novartis
• Pfizer
• Regeneron
• Roche
• Santen
• Senju
• Valeant
• Our report provides these Qualitative Analysis:
• Drivers and Restraints of the Global Ophthalmic Drugs market
• SWOT Analysis of selected leading companies
• Porter’s Five Forces Analysis of the Global Ophthalmic Drugs Market
Visiongain’s study is intended for anyone requiring commercial analyses for the ophthalmic drugs market. You find data, trends and predictions.
Buy our report today Pharma Leader Series: Top 25 Ophthalmic Drug Manufacturers 2018-2028: Retinal Disorder Drugs, Allergic, Inflammatory & Infective Drugs, Glaucoma Drugs, Dry Eye Drugs.
Visiongain is a trading partner with the US Federal Government
CCR Ref number: KD4R6
1. Report Overview
1.1 Global Ophthalmic Drugs Market Overview
1.2 Global Ophthalmic Drugs Market Segmentation
1.3 Why You Should Read This Report
1.4 How This Report Delivers
1.5 Key Questions Answered by This Analytical Report
1.6 Who is This Report For?
1.7 Methodology
1.8 Frequently Asked Questions (FAQ)
1.9 Associated Visiongain Reports
1.10 About Visiongain
2. Introduction to Ophthalmic Drugs
2.1 The Pharmaceutical Industry: Very Brief Overview
2.2 The Global Burden of Eye Disease
2.3 Ophthalmic Drugs: Market Segmentation
2.4 Glaucoma: the ‘Silent Thief of Sight’
2.4.1 A Classification of Glaucoma
2.4.2 Risk Factors for Glaucoma
2.4.3 Diagnosis of Glaucoma
2.4.4 Drug Treatment of Glaucoma
2.4.5 Laser Treatment and Surgery for Glaucoma
2.5 Age-Related Macular Degeneration (AMD)
2.5.1 Dry (Non-Exudative) AMD
2.5.2 Wet (Exudative) AMD
2.5.3 Risk Factors for AMD
2.5.4 Diagnosis of AMD
2.5.5 Treatment of AMD
2.6 Diabetic Retinopathy (DR)
2.6.1 Diagnosis of Diabetic Retinopathy
2.6.2 Treatment of Diabetic Retinopathy
2.7 Ocular Allergy and Allergic Conjunctivitis
2.7.1 Diagnosis of Ocular Allergy
2.7.2 Treatment of Ocular Allergy
2.8 Ocular Inflammatory Disease
2.8.1 Treatment of Ocular Inflammatory Disease
2.9 Eye Infections
2.9.1 Treatment of Eye Infections
2.10 Dry Eye Syndrome
2.10.1 Treatment of Dry Eye Syndrome
2.11 Phases of Clinical Trials
3. Ophthalmic Drugs: World Market 2018-2028
3.1 The World Ophthalmic Drugs Market in 2018
3.2 World Ophthalmic Drugs Market: Sales Forecast 2018-2028
3.3 Leading Ophthalmic Drugs
3.4 Leading Companies in the Ophthalmic Drugs Market
3.4.1 Top 25 Ophthalmic Drug Manufacturers
3.5 Ophthalmic Drugs Market Segments: Sales Forecasts 2018-2028
3.5.1 Retinal Disorders Drugs Market: Sales Forecast 2018-2028
3.5.2 Allergic, Inflammatory and Infective Drugs Market: Sales Forecast 2018-2028
3.5.3 Glaucoma Drugs Market: Sales Forecast 2018-2028
3.5.4 Dry Eye Drugs Market: Sales Forecast 2018-2028
3.5.5 Other Ophthalmic Drugs Market: Sales Forecast 2018-2028
3.6 How Will Market Shares Change to 2028?
3.7 World Ophthalmic Drugs Market: Drivers and Restraints 2018-2028
3.7.1 World Ophthalmic Drugs Market: Analysis of Drivers
3.7.2 World Ophthalmic Drugs Market: Analysis of Restraints
4. Leading US Ophthalmic Drug Manufacturers 2018-2028
4.1 Allergan Overview
4.1.1 Allergan: Ophthalmic Product Portfolio
4.1.2 Allergan: Late Stage Ophthalmic Product Pipeline
4.1.3 Allergan: Ophthalmic Revenue Forecast 2018-2028
4.1.4 Allergan: SWOT Analysis
4.2 Pfizer Overview
4.2.1 Pfizer: Ophthalmic Product Portfolio
4.2.2 Pfizer: Ophthalmic Product Pipeline
4.2.3 Pfizer: Revenue Forecast 2018-2028
4.2.4 Pfizer: SWOT Analysis
4.3 Regeneron Overview
4.3.1 Regeneron: Ophthalmic Product Portfolio
4.3.2 Regeneron: Ophthalmic Product Pipeline
4.3.3 Regeneron: Revenue Forecast 2018-2028
4.3.4 FDA Approves Zaltrap (aflibercept)
4.3.5 Eylea/Zaltrap and the Davis-Smyth Patent Agreements
4.3.6 Regeneron: SWOT Analysis
4.4 Akorn Overview
4.4.1 Akorn: Ophthalmic Product Portfolio
4.4.2 Akorn: Revenue Forecast 2018-2028
4.4.3 Akorn: SWOT Analysis
5. Leading European Ophthalmic Drug Manufacturers 2018-2028
5.1 Bayer Overview
5.1.1 Bayer: Ophthalmic Product Pipeline
5.1.2 Eylea: non-US Sales Forecast 2018-2028
5.1.3 Bayer: Revenue Forecast 2018-2028
5.2 Novartis (including Alcon) Overview
5.2.1 Novartis: Ophthalmic Product Portfolio
5.2.2 Novartis: Ophthalmic Product Pipeline
5.2.3 Novartis: Revenue Forecast 2018-2028
5.2.4 Novartis: SWOT Analysis
5.3 Roche Overview
5.3.1 Roche: Ophthalmic Product Portfolio
5.3.2 Roche: Ophthalmic Product Pipeline
5.3.3 Roche: Revenue Forecast 2018-2028
5.3.4 Roche: SWOT Analysis
6. Leading Asia-Pacific and Other Ophthalmic Drug Manufacturers 2018-2028
6.1 Santen Overview
6.1.1 Santen: Ophthalmic Product Portfolio
6.1.2 Santen: Ophthalmic Product Pipeline
6.1.3 Santen: Revenue Forecast 2018-2028
6.1.4 Santen: SWOT Analysis
6.2 Senju Overview
6.2.1 Senju: Ophthalmic Product Portfolio
6.2.2 Senju: Ophthalmic Product Pipeline
6.2.3 Senju: Revenue Forecast 2018-2028
6.2.4 Senju: SWOT Analysis
6.3 Valeant Overview
6.3.1 Valeant: Ophthalmic Product Portfolio
6.3.2 Valeant: Ophthalmic Product Pipeline
6.3.3 Valeant: Revenue Forecast 2018-2028
6.3.4 Valeant: SWOT Analysis
7. Emerging Ophthalmic Drug Manufacturers in 2017
7.1 Companies with Small Ophthalmic Portfolios and Promising Pipeline Candidates, 2017
7.2 Acucela
7.3 Aerie Pharmaceuticals
7.4 Aerpio Therapeutics: Developing AKB 9778
7.5 Alimera Sciences
7.5.1 Iluvien: Increasing Geographical Reach and Increasing Sales
7.5.2 NADPH Oxidase Inhibitors Offer Potential for Dry AMD
7.6 Amakem
7.7 Ampio Pharmaceuticals
7.8 Chengdu Kanghong Pharmaceutical
7.9 Eleven Biotherapeutics
7.10 EyeGate Pharmaceuticals
7.11 Gene Signal
7.11.1 Aganirsen: Preventing Corneal Graft Rejection
7.12 Icon Bioscience
7.13 MacuCLEAR
7.13.1 MC 1101: a Potential Therapy for Dry AMD
7.14 Neurotech
7.15 Omeros
7.16 OphthaliX (Can-Fite BioPharma)
7.17 Ophthotech
7.17.1 Fovista: Potential Game-Changer in AMD
7.17.2 Fovista: Significant Improvement on Lucentis in Phase II Trials
7.17.3 Zimura: Complement C5 Inhibitor
7.18 Otsuka Pharmaceutical
7.19 pSivida Corp.
7.20 RXi Pharmaceuticals: Will Bevasiranib Resume Development?
7.21 Shire
7.21.1 Lifitegrast (SHP606) for Dry Eye
7.21.2 Premiplex (SHP607): Preventing Retinopathy of Prematurity
7.22 ThromboGenics
7.22.1 Jetrea (ocriplasmin)
7.22.2 ThromboGgenics: Leading Diabetic Eye Disease Pipeline
8. Qualitative Analysis of the Ophthalmic Drugs Market 2018-2028
8.1 Porter’s Five Forces Analysis of the Ophthalmic Drugs Market
8.1.1 Rivalry Among Competitors [Medium]
8.1.2 Threat of New Entrants [Low]
8.1.3 Power of Suppliers [Low]
8.1.4 Power of Buyers [Medium]
8.1.5 Threat of Substitutes [Medium]
9. Conclusions
9.1 Ophthalmic Pharmaceuticals: A Growing Niche Market
9.2 The World Ophthalmic Drugs Market in 2017
9.2.1 Leading Ophthalmic Drugs Market Segments
9.2.2 Leading Ophthalmic Drugs
9.2.3 Leading Ophthalmic Drugs Companies
9.3 World Ophthalmic Drugs Market Forecast 2018-2028
9.4 The Future of the Ophthalmic Drugs Market?
9.4.1 Increasing Revenue Concentration among Specialist Companies
9.4.2 The Rise of Generics
9.4.3 Small Companies Can Have a Big Impact
9.4.4 What Will Succeed in the Ophthalmic Drugs Market?
Glossary
Associated Visiongain Reports
Visiongain Report Sales Order Form
Appendix A
About Visiongain
Appendix B
Visiongain report evaluation form
List of Tables
Table 2.1 ICD 10 Classification of Visual Impairment, 2015
Table 2.2 Drug Treatments for Glaucoma, 2017
Table 2.3 Drug Treatments for AMD, 2017
Table 2.4 Drug Treatments for Ocular Allergy, 2017
Table 2.5 Drug Treatments for Ocular Inflammatory Disease, 2017
Table 2.6 Selected Drug Treatments for Eye Infections, 2017
Table 2.7 Clinical Trial Phases
Table 3.1 World Ophthalmic Drugs Market: Revenue ($m) and Market Share (%) by Segment, 2017
Table 3.2 World Ophthalmic Drugs Market Forecast: Revenue ($m), AGR (%), CAGR (%), 2018-2028
Table 3.3 Top 10 Ophthalmic Drugs: Revenue ($m), Market Share (%), Rank, Active Ingredient and Manufacturer, 2017
Table 3.4 Top 10 Ophthalmic Drug Manufacturers: Ophthalmic Drugs Revenue ($m), Market Share (%), 2017
Table 3.5 Top 25 Ophthalmic Drug Manufacturers: Ophthalmic Drugs Revenue ($m), Leading Pipeline Products, 2017
Table 3.6 World Ophthalmic Drugs Market Forecast: Revenues ($m), AGR (%), CAGR (%) by Segment, 2017-2028
Table 3.7 Retinal Disorders Drugs Market Forecast: Revenues ($m), AGR (%), CAGR (%), 2017-2028
Table 3.8 Allergic, Inflammatory and Infective Drugs Market Forecast: Revenue ($m), AGR (%) and CAGR (%), 2017-2028
Table 3.9 Glaucoma Drugs Market Forecast: Revenues ($m), AGR (%) and CAGR (%), 2017-2028
Table 3.10 Dry Eye Drugs Market Forecast: Revenues ($m), AGR (%) and CAGR (%), 2017-2028
Table 3.11 Other Ophthalmic Drugs Market Forecast: Revenues ($m), AGR (%), CAGR (%), 2017-2028
Table 3.12 Market Shares (%) of the Ophthalmic Drugs Market by Segment, 2017, 2023 and 2028
Table 4.1 Allergan: Overview, 2017
Table 4.2 Allergan: Ophthalmic Drug Products, Revenue ($m), Growth Rate (%), 2016 and 2017
Table 4.3 Allergan: Restasis Revenue ($m), AGR (%) and CAGR (%), 2017-2028
Table 4.4 Allergan: Lumigan and Ganfort Revenue ($m), AGR (%) and CAGR (%), 2017-2028
Table 4.5 Allergan: Alphagan/Alphagan P and Combigan Revenue ($m), AGR (%) and CAGR (%), 2017-2028
Table 4.6 Allergan: Ophthalmic Drugs Revenue ($m), AGR (%) and CAGR (%), 2017-2028
Table 4.7 Allergan: Ophthalmic Drugs Market Share (%), Revenue ($m), 2017-2028
Table 4.8 Allergan: Ophthalmic Drugs Market SWOT Analysis, 2018-2028
Table 4.9 Pfizer: Overview, 2017
Table 4.10 Pfizer: Xalatan/Xalacom Revenue ($m), AGR (%) and CAGR (%), 2017-2028
Table 4.11 Pfizer: Ophthalmic Drugs Revenue ($m), AGR (%) and CAGR (%), 2017-2028
Table 4.12 Pfizer: Ophthalmic Drugs Market Share (%), Revenue ($m), 2017-2028
Table 4.13 Pfizer: Ophthalmic Drugs Market SWOT Analysis, 2018-2028
Table 4.14 Regeneron: Overview, 2017
Table 4.15 Regeneron: Eylea Revenue ($m), AGR (%) and CAGR (%) 2017-2028
Table 4.16 Regeneron: Ophthalmic Drugs Revenue ($m), AGR (%) and CAGR (%), 2017-2028
Table 4.17 Regeneron: Ophthalmic Drugs Market Share (%), Revenue ($m), 2017-2028
Table 4.18 Regeneron: Ophthalmic Drugs Market SWOT Analysis, 2018-2028
Table 4.19 Akorn: Overview, 2017
Table 4.20 Akorn: Ophthalmic Drugs Revenue ($m), AGR (%) and CAGR (%), 2017-2028
Table 4.21 Akorn: Ophthalmic Drugs Market Share (%), Revenue ($m), 2017-2028
Table 4.22 Akorn: Ophthalmic Drugs Market SWOT Analysis, 2018-2028
Table 5.1 Bayer: Overview, 2017
Table 5.2 Bayer: Eylea Revenue ($m), AGR (%) and CAGR (%), 2017-2028
Table 5.3 Bayer: Ophthalmic Drugs Revenue ($m), AGR (%) and CAGR (%), 2017-2028
Table 5.4 Bayer: Ophthalmic Drugs Market Share (%), Revenue ($m), 2017-2028
Table 5.5 Novartis: Overview, 2017
Table 5.6 Novartis: Lucentis Revenue ($m), AGR (%) and CAGR (%), 2017-2028
Table 5.7 Novartis: Travatan/Travatan Z and DuoTrav Revenue ($m), AGR (%) and CAGR (%), 2017-2028
Table 5.8 Novartis: Vigamox Revenue ($m), AGR (%) and CAGR(%), 2017-2028
Table 5.9 Novartis: Azopt Revenue ($m), AGR (%) and CAGR(%), 2017-2028
Table 5.11 Novartis: Ophthalmic Drugs Revenue ($m), AGR (%) and CAGR (%), 2017-2028
Table 5.12 Novartis: Ophthalmic Drugs Market Share (%), Revenue ($m), 2017-2028
Table 5.13 Novartis: Ophthalmic Drugs Market SWOT Analysis, 2018-2028
Table 5.14 Roche: Overview, 2017
Table 5.15 Roche: Lucentis Revenue ($m), AGR (%) and CAGR(%), 2017-2028
Table 5.16 Roche: Avastin Ophthalmic Revenue ($m), AGR (%) and CAGR (%), 2017-2028
Table 5.17 Roche: Ophthalmic Drugs Revenue ($m), AGR (%) and CAGR (%), 2017-2028
Table 5.18 Roche: Ophthalmic Drugs Market Share (%), Revenue ($m), 2017-2028
Table 5.19 Roche: Ophthalmic Drugs Market SWOT Analysis, 2018-2028
Table 6.1 Santen: Overview, 2017
Table 6.2 Santen: Major Prescription Ophthalmic Drugs by Therapeutic Area, Launch Date, Region, 2017
Table 6.3 Santen: Eylea Revenue ($m), AGR (%) and CAGR(%), 2017-2028
Table 6.4 Santen: Hyalein Revenue ($m), AGR (%) and CAGR (%), 2017-2028
Table 6.5 Santen: Cosopt Revenue ($m), AGR (%) and CAGR (%), 2017-2028
Table 6.6 Santen: Tapros/Taflotan Revenue ($m), AGR (%) and CAGR (%), 2017-2028
Table 6.7 Santen: Diquas Revenue ($m), AGR (%) and CAGR (%), 2017-2028
Table 6.8 Santen: Cravit Revenue ($m), AGR (%) and CAGR (%), 2017-2028
Table 6.9 Santen: Alesion Revenue ($m), AGR (%) and CAGR (%), 2017-2028
Table 6.10 Santen: Ophthalmic Drugs Revenue ($m), AGR (%) and CAGR (%), 2017-2028
Table 6.11 Santen: Ophthalmic Drugs Market Share (%), Revenue ($m), 2017-2028
Table 6.12 Santen: Ophthalmic Drugs Market SWOT Analysis, 2018-2028
Table 6.13 Senju: Overview, 2017
Table 6.14 Senju: Major Prescription Ophthalmic Drugs by Therapeutic Area, Launch Year, 2017
Table 6.15 Senju: Ophthalmic Drugs Revenue ($m), AGR (%) and CAGR (%), 2017-2028
Table 6.16 Senju: Ophthalmic Drugs Market Share (%), Revenue ($m), 2017-2028
Table 6.17 Senju: Ophthalmic Drugs Market SWOT Analysis, 2018-2028
Table 6.18 Valeant: Overview, 2017
Table 6.19 Valeant: Lotemax Revenue ($m), AGR (%) and CAGR (%), 2017-2028
Table 6.20 Valeant: Ophthalmic Drugs Revenue ($m), AGR (%) and CAGR (%), 2017-2028
Table 6.21 Valeant: Ophthalmic Drugs Market Share (%), Revenue ($m), 2017-2028
Table 6.22 Valeant: Ophthalmic Drugs Market SWOT Analysis, 2018-2028
Table 7.1 Otsuka Pharmaceutical: Overview of Ophthalmic Drug Pipelines, Drug Type, Indication, Country
Table 9.1 Leading Ophthalmic Drugs Manufacturers: Revenues ($m), Market Share (%), 2018
List of Figures
Figure 1.1 Global Causes of Visual Impairment (% of cases), 2017
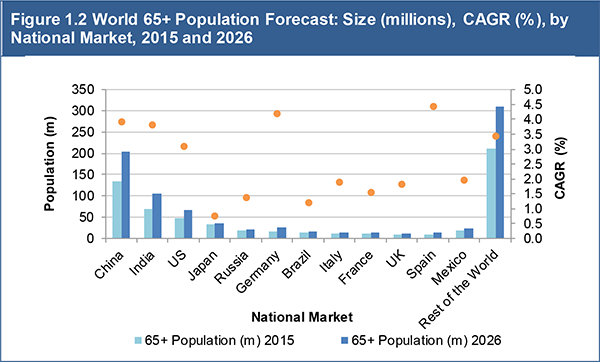
Figure 1.2 World 65+ Population Forecast: Size (millions), CAGR (%), by National Market, 2015 and 2026
Figure 1.3 Global Ophthalmic Drugs Market Segmentation Overview, 2017
Figure 2.1 Estimated Global Blindness and Visual Impairment (% of people), 2015
Figure 2.2 Estimated Global Prevalence of Visual Impairment (millions of people), 2015
Figure 2.3 Global Causes of Visual Impairment (% of cases), 2015
Figure 2.4 Global Causes of Blindness (% of cases), 2015
Figure 2.5 Classification of Glaucoma, 2017
Figure 3.1 World Ophthalmic Drugs Market: Revenues ($m) by Segment, 2017
Figure 3.2 World Ophthalmic Drugs Market: Market Share (%) by Segment, 2017
Figure 3.3 World Ophthalmic Drugs Market Forecast: Revenue ($m) and AGR (%), 2018-2028
Figure 3.4 Top 9 Ophthalmic Drugs: Revenues ($m), 2017
Figure 3.5 Top 9 Ophthalmic Drugs: Market Share (%), 2017
Figure 3.6 Top 10 Ophthalmic Drug Manufacturers: Ophthalmic Drugs Revenues ($m), 2017
Figure 3.7 Top 10 Ophthalmic Drug Manufacturers: Market Share (%), 2017
Figure 3.8 Retinal Disorders Drugs Market Forecast: Revenues ($m), 2017-2028
Figure 3.9 Allergic, Inflammatory and Infective Drugs Market Forecast: Revenue ($m), 2017-2028
Figure 3.10 Glaucoma Drugs Market Forecast: Revenues ($m), 2017-2028
Figure 3.11 Dry Eye Drugs Market Forecast: Revenues ($m), 2017-2028
Figure 3.12 Other Ophthalmic Drugs Market Forecast: Revenues ($m), 2017-2028
Figure 3.13 World Ophthalmic Drugs Market: Market Share (%) by Segment, 2017
Figure 3.14 World Ophthalmic Drugs Market Forecast: Market Shares (%) by Segment, 2023
Figure 3.15 World Ophthalmic Drugs Market Forecast: Market Shares (%) by Segment, 2028
Figure 3.16 World Ophthalmic Drugs Market: Drivers and Restraints, 2018-2028
Figure 4.1 Allergan: Restasis Revenue ($m) and AGR (%), 2017-2028
Figure 4.2 Allergan: Lumigan and Ganfort Revenue ($m) and AGR (%), 2017-2028
Figure 4.3 Allergan: Alphagan/Alphagan P and Combigan Revenue ($m) and AGR (%), 2017-2028
Figure 4.4 Allergan: Ophthalmic Drugs Revenue ($m) and AGR (%), 2017-2028
Figure 4.5 Allergan: Ophthalmic Drugs Revenue and Market Share (%), 2017-2028
Figure 4.6 Pfizer: Xalatan/Xalacom Revenue ($m), AGR (%), 2017-2028
Figure 4.7 Pfizer: Ophthalmic Drugs Revenue ($m) and AGR (%), 2017-2028
Figure 4.8 Pfizer: Ophthalmic Drugs Revenue and Market Share (%), 2017-2028
Figure 4.9 Regeneron: Eylea Revenue ($m) and AGR (%), 2017-2028
Figure 4.10 Regeneron: Ophthalmic Drugs Revenue ($m) and AGR (%), 2017-2028
Figure 4.11 Regeneron: Ophthalmic Drugs Revenue and Market Share (%), 2017-2028
Figure 4.12 Akorn: Ophthalmic Drugs Revenue ($m) and AGR (%), 2017-2028
Figure 4.13 Akorn: Ophthalmic Drugs Market Share (%), 2017-2028
Figure 5.1 Bayer: Eylea Revenue ($m) and AGR (%), 2017-2028
Figure 5.2 Bayer: Ophthalmic Drugs Revenue ($m) and AGR(%), 2017-2028
Figure 5.3 Bayer: Ophthalmic Drugs Revenue and Market Share (%), 2017-2028
Figure 5.4 Novartis: Lucentis Revenue ($m) and AGR(%), 2017-2028
Figure 5.5 Novartis: Travatan/Travatan Z and DuoTrav Revenue ($m) and AGR (%), 2017-2028
Figure 5.6 Novartis: Vigamox Revenue ($m) and AGR(%), 2017-2028
Figure 5.7 Novartis: Azopt Revenue ($m) and AGR (%), 2017-2028
Figure 5.8 Novartis: Ophthalmic Drugs Revenue ($m) and AGR (%), 2017-2028
Figure 5.9 Novartis: Ophthalmic Drugs Revenue and Market Share (%), 2017-2028
Figure 5.10 Roche: Lucentis Revenue ($m) and AGR (%), 2017-2028
Figure 5.11 Roche: Avastin Ophthalmic Revenue ($m) and AGR(%), 2017-2028
Figure 5.12 Roche: Ophthalmic Drugs Revenue ($m) and AGR (%), 2017-2028
Figure 5.13 Roche: Ophthalmic Drugs Revenue and Market Share (%), 2017-2028
Figure 6.1 Santen: Ophthalmic Drugs Revenue ($m) by Segment, FY 2017
Figure 6.2 Santen: Major Prescription Ophthalmic Drugs, Revenue Share (%), FY 2017
Figure 6.3 Santen: Eylea Revenue ($m) and AGR (%), 2017-2028
Figure 6.4 Santen: Hyalein Revenue ($m) and AGR (%), 2017-2028
Figure 6.5 Santen: Cosopt Revenue ($m) and AGR (%), 2017-2028
Figure 6.6 Santen: Tapros/Taflotan Revenue ($m) and AGR (%), 2017-2028
Figure 6.7 Santen: Diquas Revenue ($m) and AGR (%), 2017-2028
Figure 6.8 Santen: Cravit Revenue ($m) and AGR (%), 2017-2028
Figure 6.9 Santen: Alesion Revenue ($m) and AGR (%), 2017-2028
Figure 6.10 Santen: Ophthalmic Drugs Revenue ($m) and AGR (%), 2017-2028
Figure 6.11 Santen: Ophthalmic Drugs Market Share (%), 2017-2028
Figure 6.12 Senju: Ophthalmic Drugs Revenue ($m) and AGR (%), 2017-2028
Figure 6.13 Senju: Ophthalmic Drugs Market Share (%), 2017-2028
Figure 6.14 Valeant: Lotemax Revenue ($m) and AGR (%), 2017-2028
Figure 6.15 Valeant: Ophthalmic Drugs Revenue ($m) and AGR (%), 2017-2028
Figure 6.16 Valeant: Ophthalmic Drugs Market Share (%), 2017-2028
Figure 7.1 Gene Signal: Ophthalmic Drug Pipeline Progress
Figure 7.2 Ophthotech: Ophthalmic Drug Pipeline Progress
Figure 7.3 Otsuka Pharmaceutical: Ophthalmic Drug Pipeline Progress
Figure 7.4 Shire: Ophthalmic Drug Pipeline Progress
Figure 8.1 Porter’s Five Forces Analysis of the Ophthalmic Drugs Market, 2018-2028
Abbott Laboratories (Abbott)
Abbvie
Actavis
Acucela
Advanced Vision Research (acquired by Akorn)
Aerie Pharmaceuticals
Aerpio Therapeutics
Akorn Pharmaceuticals
Alcon (subsidiary of Novartis)
Alimera Sciences
Allergan
Allegro Ophthalmics
Altheos
Amakem
Ampio Pharma
Asahi Glass
AstraZeneca
Aton Pharma (acquired by Valeant)
Banyu Pharmaceutical (part of Merck)
Bausch and Lomb (subsidiary of Valeant)
Bayer
Bayer Yakuhin (Japanese subsidiary of Bayer)
BioDiem
Bicycle Therapeutics
Biogen Idec
BioInvent International
Biovail Corporation (part of Valeant)
Bristol-Myers Squibb
Can-Fite BioPharma
Chengdu Kanghong Pharmaceutical
Chiron Corportation (part of Novartis)
Chugai Pharmaceutical (part of Roche)
CIBA VISION (part of Novartis)
Ciba-Geigy (part of Novartis)
Colby Pharmaceutical Company (Colby)
CoMentis
Daiichi Sankyo
Eleven Biotherapeutics
Eli Lilly and Company (Lilly)
EyeGate Pharmaceuticals
Eyetech Inc. / Eyetech Pharmaceuticals (acquired by Valeant)
Fougera Pharmaceuticals (acquired by Novartis)
Gene Signal
Genentech (subsidiary of Roche)
Genzyme (subsidiary of Sanofi)
Gilead Sciences
GSK
ICN Pharmaceuticals (original Valeant company)
Icon Bioscience
Inamed Corporation (subsidiary of Allergan)
Inception Sciences, Inc.
InSite Vision
Inspire Pharmaceuticals (acquired by Merck)
ISTA Pharmaceuticals (part of Valeant)
Jerini AG
Jerini Ophthalmic (part of Jerini AG)
Johnson & Johnson
Kestrel Ophthalmics
Kyorin Pharmaceutical
Kyowa Hakko Kirin
LEO Pharma
Lpath
MacuCLEAR
MacuSIGHT, Inc.
MAP Pharmaceuticals (acquired by Allergan)
Meda
Medicis Corporation (acquired by Valeant)
Merck & Co. (Merck)
MerLion Pharmaceuticals
MSD K.K. (part of Merck)
Mylan Pharmaceuticals
Mystic Pharmaceuticals
Neurotech
NicOx
Nippon Boehringer Ingelheim (subsidiary of Boehringer Ingelheim)
NovaBay Pharmaceuticals
Novagali Pharma (acquired by Santen)
Novartis
Novo (subsidiary of Novo Nordisk)
Novo Nordisk
Oakwood Laboratories
OcuSciences
Omeros
Onyx Pharmaceuticals
OphthaliX (part-owned by Can-Fite BioPharma)
Ophthotech
OPKO Health
Ora
OSI Pharmaceuticals
Othera Pharmaceuticals (acquired by Colby)
Otsuka Pharmaceutical
Oxford BioMedica
OXiGENE
Parke-Davis (subsidiary of Pfizer)
PDL BioPharma
Pfizer
Pharmacia (acquired by Pfizer)
Potentia Pharmaceuticals
Premacure
Procter & Gamble
pSivida
Quark Pharmaceuticals
Reckitt Benckiser
Regeneron
RetroSense Therapeutics
ReVision Therapeutics
Roche
RXi Pharmaceuticals
Sandoz (part of Novartis)
Sanofi
Santen Pharmaceutical Co. (Santen)
SARcode Bioscience
Schering-Plough (part of Merck)
Senju
Senju Pharmaceuticals Science & Technology (Beijing) Co., Ltd. (subsidiary of Senju)
Senju USA Inc. (subsidiary of Senju)
Shire
Sirion Therapeutics
Sirna Therapeutics
Sirnaomics
SkinMedica (subsidiary of Allergan)
Spark Therapeutics
Symphony ViDA
Takeda Pharmaceutical
Teva
The Patent Board
ThromboGenics
Upjohn (acquired by Pfizer through Pharmacia)
Valeant Pharmaceuticals
Ventana Medical Systems (acquired by Roche)
Versant Ventures
Warburg Pincus LLC
Warner-Lambert (acquired by Pfizer)
Watson Pharmaceuticals
Wyeth Pharmaceuticals (part of Pfizer)
List of Other Organizations Mentioned in the Report
A*STAR Institute for Infocomm Research (Singapore)
American Academy of Ophthalmology (AAO)
American Diabetes Association
American Society of Retina Specialists (ASRS)
Association for Research in Vision and Ophthalmology (ARVO)
Council of Europe
Emory University
European Medicines Agency (EMA)
Foundation Fighting Blindness (FFB) (US)
Health Canada
Institute of Experimental Medicine (Russia)
Institute of Ocular Pharmacology, Texas A&M (US)
Institute of Ophthalmology, University College London (UK)
Intellectual Property Appellate Board (India)
International Diabetes Federation
Internet Archive
Japan Patent Office (JPO)
Mayo Clinic
Ministry of Health, Labour and Welfare (MHLW) (Japan)
Monash University
National Eye Institute (NEI) (US)
National Health Service (NHS) (UK)
National Institute for Health and Care Excellence (NICE) (UK)
NHS Scotland
Novartis Institutes for BioMedical Research (NIBR) (part of Novartis)
Novartis Venture Funds (NVF) (part of Novartis)
Ophthalmology External Research Unit (part of Pfizer)
Ophthrisi (GSK research unit)
Rinat (Pfizer research unit)
Texas Emerging Technology Fund
Therapeutic Goods Administration (TGA) (Australia)
Tokyo University of Science
United States Food and Drug Administration (FDA)
University of Florida
University of Kentucky
University of Melbourne
University of Michigan
US Preventive Services Task Force (USPSTF)
US Securities and Exchange Commission (SEC)
World Health Organization (WHO)
Download sample pages
Complete the form below to download your free sample pages for Pharma Leader Series: Top 25 Ophthalmic Drug Manufacturers 2018-2028
Related reports
-

Global Biosimilars and Follow-On Biologics Market 2018-2028
The global biosimilars and follow-on biologics market is estimated to have reached $7.70bn in 2017 and expected to grow at...
Full DetailsPublished: 01 June 2018 -
Drug Delivery Technologies Market Forecast 2019-2029
The Drug Delivery Technologies market is estimated to grow at a CAGR of 8.3% in the first half of the...
Full DetailsPublished: 27 February 2019 -
Pharmaceutical Contract Manufacturing Market 2018-2028
The pharmaceutical contract manufacturing market is expected to grow at a CAGR of 6.0% in the first half of the...
Full DetailsPublished: 27 June 2018 -
Global Ophthalmic Drugs Market Forecast 2018-2028
The global ophthalmic drugs market is expected to grow at a CAGR of 4.4% in the first half of the...
Full DetailsPublished: 26 June 2018 -

Needle-Free Delivery Technology Market 2018-2028
The global needle-free delivery technology market was valued at $1.7bn in 2017 and is estimated to reach $5.5bn by 2028,...Full DetailsPublished: 21 August 2018 -
Global Ophthalmic Devices Market 2018-2028
The global ophthalmic devices market is expected to grow at a CAGR of 5.5% in the first half of the...
Full DetailsPublished: 25 June 2018 -

Global Medical Device Contract Manufacturing Market Forecast 2018-2028
The global medical device contract manufacturing market was valued at $70bn in 2017. Visiongain forecasts this market to increase to...
Full DetailsPublished: 17 July 2018 -
The Companion Diagnostics (CDx) Market Forecast 2018-2028
What can be expected from the Companion Diagnostics market? Which areas are going to grow at the fastest rates? This...
Full DetailsPublished: 10 April 2018 -
Generic Drugs Market Forecast 2018-2028
The generic drugs market is estimated at $257.3bn in 2017 and is expected to grow at a CAGR of 7.9%...
Full DetailsPublished: 25 April 2018 -
Biological Drug API Manufacturing Services World Industry and Market Predictions 2018-2028
The biological drug API manufacturing market is estimated to grow at a CAGR of 9.0% in the first half of...
Full DetailsPublished: 06 July 2018
Download sample pages
Complete the form below to download your free sample pages for Pharma Leader Series: Top 25 Ophthalmic Drug Manufacturers 2018-2028
Do you have any custom requirements we can help you with?
Any specific country, geo region, market segment or specific company information?
Email us today, we can discuss your needs and see how we can help: jamie.roberts@visiongain.com
Would you like a free report overview of the report of your choice?
If so, please drop an email to Jamie Roberts stating your chosen report title to jamie.roberts@visiongain.com
Visiongain’s reports are based on comprehensive primary and secondary research. Those studies provide global market forecasts (sales by drug and class, with sub-markets and leading nations covered) and analyses of market drivers and restraints (including SWOT analysis) and current pipeline developments. To find out more about our reports methodology, please email jamie.roberts@visiongain.com
“Thank you for this Gene Therapy R&D Market report and for how easy the process was. Your colleague was very helpful and the report is just right for my purpose. This is the 2nd good report from Visiongain and a good price.”
Dr Luz Chapa Azuella, Mexico
American Association of Colleges of Pharmacy
American College of Clinical Pharmacy
American Pharmacists Association
American Society for Pharmacy Law
American Society of Consultant Pharmacists
American Society of Health-System Pharmacists
Association of Special Pharmaceutical Manufacturers
Australian College of Pharmacy
Biotechnology Industry Organization
Canadian Pharmacists Association
Canadian Society of Hospital Pharmacists
Chinese Pharmaceutical Association
College of Psychiatric and Neurologic Pharmacists
Danish Association of Pharmaconomists
European Association of Employed Community Pharmacists in Europe
European Medicines Agency
Federal Drugs Agency
General Medical Council
Head of Medicines Agency
International Federation of Pharmaceutical Manufacturers & Associations
International Pharmaceutical Federation
International Pharmaceutical Students’ Federation
Medicines and Healthcare Products Regulatory Agency
National Pharmacy Association
Norwegian Pharmacy Association
Ontario Pharmacists Association
Pakistan Pharmacists Association
Pharmaceutical Association of Mauritius
Pharmaceutical Group of the European Union
Pharmaceutical Society of Australia
Pharmaceutical Society of Ireland
Pharmaceutical Society Of New Zealand
Pharmaceutical Society of Northern Ireland
Professional Compounding Centers of America
Royal Pharmaceutical Society
The American Association of Pharmaceutical Scientists
The BioIndustry Association
The Controlled Release Society
The European Federation of Pharmaceutical Industries and Associations
The European Personalised Medicine Association
The Institute of Clinical Research
The International Society for Pharmaceutical Engineering
The Pharmaceutical Association of Israel
The Pharmaceutical Research and Manufacturers of America
The Pharmacy Guild of Australia
The Society of Hospital Pharmacists of Australia
Latest Pharma news
Visiongain Publishes Drug Delivery Technologies Market Report 2024-2034
The global Drug Delivery Technologies market is estimated at US$1,729.6 billion in 2024 and is projected to grow at a CAGR of 5.5% during the forecast period 2024-2034.
23 April 2024
Visiongain Publishes Cell Therapy Technologies Market Report 2024-2034
The cell therapy technologies market is estimated at US$7,041.3 million in 2024 and is projected to grow at a CAGR of 10.7% during the forecast period 2024-2034.
18 April 2024
Visiongain Publishes Automation in Biopharma Industry Market Report 2024-2034
The global Automation in Biopharma Industry market is estimated at US$1,954.3 million in 2024 and is projected to grow at a CAGR of 7% during the forecast period 2024-2034.
17 April 2024
Visiongain Publishes Anti-obesity Drugs Market Report 2024-2034
The global Anti-obesity Drugs market is estimated at US$11,540.2 million in 2024 and is expected to register a CAGR of 21.2% from 2024 to 2034.
12 April 2024
