1. Report Overview
1.1 Global Antibiotics Drugs Manufacturer Market Overview
1.2 Overview of Findings
1.3 Structure of the Report
1.4 Global Antibiotics Drugs Manufacturer Market Segmentation
1.5 Why You Should Read This Report
1.6 Key Questions Answered by This Analytical Report
1.7 Who is This Report For?
1.8 Methodology
1.9 Associated Visiongain Report
1.10 About Visiongain
2. Introduction to Antibiotics Drugs Manufacturer
2.1 An Introduction to Antibiotics Drugs Manufacturer
2.1.1. Cephalosporins
2.1.2. Penicillins
2.1.3. Quinolones/Fluoroquinolones
2.1.4. Macrolides
2.1.5. Carbapenems
2.2. Antibiotics Drugs Manufacturer Market: Drivers, Restrains and Opportunities
2.2.1. Drivers
2.2.1.1. Need of new broad-spectrum agents
2.2.1.2. Increase in Government Funding
2.2.1.3. Infection control in health care settings
2.2.1.4. Rapidly growing antibacterial resistance
2.2.2. Restrains
2.2.2.1. Inappropriate prescription and patient compliance
2.2.2.2. Lack of return on investment
2.2.3. Opportunities
2.2.3.1. Public-Private Funding
3. Antibiotics Drugs: World Market 2018-2028
3.1 Global Antibiotics Drugs Market Forecast, 2018-2028
3.2 Global Antibiotics Drugs Market, by Automation Type: Sales Forecast 2018-2028
3.3 Leading Antibiotics Drugs Manufacturer
3.4 Leading Companies in the Antibiotics Drugs Market
3.5 Antibiotics Drugs Market Segments: Sales Forecasts 2018-2028
3.5.1 Cephalosporins Drugs Market: Sales Forecast 2018-2028
3.5.2 Penicillins Drugs Market: Sales Forecast 2018-2028
3.5.3 Fluoroquinolones Drugs Market: Sales Forecast 2018-2028
3.5.4 Macrolides Drugs Market: Sales Forecast 2018-2028
3.5.5 Carbapenems Drugs Market: Sales Forecast 2018-2028
3.5.6 Others Drugs Market: Sales Forecast 2018-2028
4. Leading US Antibiotics Drugs Manufacturers 2018-2028
4.1 Pfizer, Inc.: Overview
4.1.1 Pfizer: Antibiotics Drugs Portfolio
4.1.2 Pfizer Antibiotics Drug Sales Forecast 2018-2028
4.1.2.1 Sulperazon
4.1.2.2 Sulperazon: Sales Forecast 2018-2028
4.1.2.3 Unasyn
4.1.2.4 Unasyn: Sales Forecast 2018-2028
4.1.2.5 Zithromax
4.1.2.6 Zithromax: Sales Forecast 2018-2028
4.1.2.7 Dalacin
4.1.2.8 Dalacin: Sales Forecast 2018-2028
4.1.2.9 Merrem/Meropen
4.1.2.10 Merrem/Meropen: Sales Forecast 2018-2028
4.1.2.11 Zyvox
4.1.2.12 Zyvox: Sales Forecast 2018-2028
4.1.2.13 Tygacil
4.1.2.14 Tygacil: Sales Forecast 2018-2028
4.1.2.15 Others
4.1.2.16 Others: Sales Forecast 2018-2028
4.1.3 Pfizer: SWOT Analysis
4.2 Merck & Co.: Overview
4.2.1 Merck & Co.: Antibiotics Drugs Portfolio
4.2.2 Merck & Co. Antibiotics Drug Sales Forecast 2018-2028
4.2.2.1 Cubicin
4.2.2.2 Cubicin: Sales Forecast 2018-2028
4.2.2.3 Invanz
4.2.2.4 Invanz: Sales Forecast 2018-2028
4.2.2.5 Avelox
4.2.2.6 Avelox: Sales Forecast 2018-2028
4.2.2.7 Primaxin
4.2.2.8 Primaxin: Sales Forecast 2018-2028
4.2.2.9 Others
4.2.2.10 Others: Sales Forecast 2018-2028
4.2.3. Merck & Co.: SWOT Analysis
4.3 Johnson & Johnson: Overview
4.3.1 Johnson & Johnson: Antibiotics Drugs Portfolio
4.3.2 Johnson & Johnson Antibiotics Drug Sales Forecast 2018-2028
4.3.2.1 Zeftera
4.3.2.2 Zeftera: Sales Forecast 2018-2028
4.3.2.3 Sirturo
4.3.2.4 Sirturo: Sales Forecast 2018-2028
4.3.2.5 Others
4.3.2.6 Others: Sales Forecast 2018-2028
4.3.3. Johnson & Johnson: SWOT Analysis
4.4 Cubist Pharmaceuticals: Overview
4.4.1 Cubist Pharmaceuticals: Antibiotics Drugs Portfolio
4.4.2 Cubist Pharmaceuticals Antibiotics Drug Sales Forecast 2018-2028
4.4.2.1 Cubicin
4.4.2.2 Cubicin: Sales Forecast 2018-2028
4.4.2.3 Sivextro Oral (Tedizolid)
4.4.2.4 Sivextro Oral: Sales Forecast 2018-2028
4.4.2.5 Others
4.4.2.6 Others: Sales Forecast 2018-2028
4.4.3. Cubist Pharmaceuticals.: SWOT Analysis
4.5 Abbott Laboratories: Overview
4.5.1. Abbott Laboratories: Antibiotics Drugs Portfolio
4.5.2 Abbott Laboratories Antibiotics Drug Sales Forecast 2018-2028
4.5.2.1 Baxin
4.5.2.2 Baxin: Sales Forecast 2018-2028
4.5.2.3 Others
4.5.2.4 Others: Sales Forecast 2018-2028
4.5.3. Abbott Laboratories.: SWOT Analysis
4.6 Eli Lilly & Co.: Overview
4.6.1. Eli Lilly & Co.: Antibiotics Drugs Portfolio
4.6.2 Eli Lilly & Co. Antibiotics Drug Sales Forecast 2018-2028
4.6.2.1 Vancocin
4.6.2.2 Vancocin: Sales Forecast 2018-2028
4.6.2.3 Ceclor
4.6.2.4 Ceclor: Sales Forecast 2018-2028
4.6.3. Eli Lilly & Co.: SWOT Analysis
4.7 Melinta Therapeutics, Inc.: Overview
4.7.1 Melinta Therapeutics, Inc.: Antibiotics Drugs Portfolio
4.7.2 Melinta Therapeutics, Inc. Antibiotics Drug Sales Forecast 2018-2028
4.7.2.1 Orbactiv
4.7.2.2 Orbactiv: Sales Forecast 2018-2028
4.7.2.3 Others
4.7.2.4 Others: Sales Forecast 2018-2028
4.7.3. Melinta Therapeutics, Inc: SWOT Analysis
5. Leading Europe Antibiotics Drugs Manufacturers 2018-2028
5.1 Novartis: Overview
5.1.1 Novartis: Antibiotics Drugs Portfolio
5.1.2 Novartis Antibiotics Drug Sales Forecast 2018-2028
5.1.2.1 Vigamox
5.1.2.2 Vigamox: Sales Forecast 2018-2028
5.1.2.3 Ciprodex
5.1.2.4 Ciprodex: Sales Forecast 2018-2028
5.1.2.5 TOBI Podhaler
5.1.2.6 TOBI Podhaler: Sales Forecast 2018-2028
5.1.2.7 Cubicin
5.1.2.8 Cubicin: Sales Forecast 2018-2028
5.1.3 Novartis: SWOT Analysis
5.2 GlaxoSmithKline plc: Overview
5.2.1 GlaxoSmithKline plc: Antibiotics Drugs Portfolio
5.2.2 GlaxoSmithKline plc Antibiotics Drug Sales Forecast 2018-2028
5.2.2.1 Ceftin/Zinnat
5.2.2.2 Ceftin/Zinnat: Sales Forecast 2018-2028
5.2.2.3 Augmentin IR
5.2.2.4 Augmentin IR: Sales Forecast 2018-2028
5.2.2.5 Amoxil (Amoxicillin)
5.2.2.6 Amoxil: Sales Forecast 2018-2028
5.2.2.7 Others
5.2.2.8 Others: Sales Forecast 2018-2028
5.2.3 GlaxoSmithKline plc: SWOT Analysis
5.3 Bayer AG: Overview
5.3.1 Bayer AG: Antibiotics Drugs Portfolio
5.3.2 Bayer AG Antibiotics Drug Sales Forecast 2018-2028
5.3.2.1 Avelox
5.3.2.2 Avelox: Sales Forecast 2018-2028
5.3.2.3 Cipro/Cirpobay
5.3.2.4 Cipro/Cirpobay: Sales Forecast 2018-2028
5.3.3 Bayer AG: SWOT Analysis
5.4 Allergan plc: Overview
5.4.1 Allergan plc: Antibiotics Drugs Portfolio
5.4.2 Allergan plc Antibiotics Drug Sales Forecast 2018-2028
5.4.2.1 Zinforo/Teflaro
5.4.2.2 Zinforo/Teflaro: Sales Forecast 2018-2028
5.4.2.3 Dalbavancin
5.4.2.4 Dalbavancin: Sales Forecast 2018-2028
5.4.2.5 Others
5.4.2.6 Others: Sales Forecast 2018-2028
5.4.3. Allergan plc: SWOT Analysis
5.5. F. Hoffmann-La Roche AG: Overview
5.5.1 F. Hoffmann-La Roche AG: Antibiotics Drugs Portfolio
5.5.2. F. Hoffmann-La Roche AG Antibiotics Drug Sales Forecast 2018-2028
5.5.2.1 Rocephin
5.5.2.2 Rocephin: Sales Forecast 2018-2028
5.5.3. F. Hoffmann-La Roche AG: SWOT Analysis
5.6 Sanofi: Overview
5.6.1. Sanofi: Antibiotics Drugs Portfolio
5.6.2 Sanofi Antibiotics Drug Sales Forecast 2018-2028
5.6.2.1 Targocid
5.6.2.2 Targocid: Sales Forecast 2018-2028
5.6.2.3 Others
5.6.2.4 Others: Sales Forecast 2018-2028
5.6.3 Sanofi: SWOT Analysis
5.7 STADA Arzneimittel: Overview
5.7.1. STADA Arzneimittel: Antibiotics Drugs Portfolio
5.7.2 STADA Arzneimittel Antibiotics Drug Sales Forecast 2018-2028
5.7.2.1 Amoxicillin
5.7.2.2 Amoxicillin: Sales Forecast 2018-2028
5.7.2.3 Diclofenac Sodium
5.7.2.4 Diclofenac Sodium: Sales Forecast 2018-2028
5.7.3 STADA Arzneimittel: SWOT Analysis
6. Leading Japan Antibiotics Drugs Manufacturers 2018-2028
6.1 Shionogi & Co., Ltd.: Overview
6.2.1 Shionogi & Co., Ltd.: Antibiotics Drugs Portfolio
6.1.2 Shionogi & Co., Ltd. Antibiotics Drug Sales Forecast 2018-2028
6.1.2.1 Flomox/Flumarin
6.1.2.2 Flomox/Flumarin: Sales Forecast 2018-2028
6.1.2.3 Others
6.1.2.4 Others: Sales Forecast 2018-2028
6.1.3 Shionogi & Co., Ltd.: SWOT Analysis
6.2 Taisho Pharmaceutical Holdings: Overview
6.2.1 Taisho Pharmaceutical Holdings: Antibiotics Drugs Portfolio
6.2.2 Taisho Pharmaceutical Holdings Antibiotics Drug Sales Forecast 2018-2028
6.2.2.1 Geninax
6.2.2.2 Geninax: Sales Forecast 2018-2028
6.2.2.3 Biaxin/Clarith
6.2.2.4 Biaxin/Clarith: Sales Forecast 2018-2028
6.2.2.5 Zosyn/Tazocin
6.2.2.6 Zosyn/Tazocin: Sales Forecast 2018-2028
6.2.2.7 Other
6.2.2.8 Other: Sales Forecast 2018-2028
6.2.3. Taisho Pharmaceutical Holdings: SWOT Analysis
6.3 Daiichi Sankyo: Overview
6.3.1 Daiichi Sankyo: Antibiotics Drugs Portfolio
6.3.2 Daiichi Sankyo Antibiotics Drug Sales Forecast 2018-2028
6.3.2.1 Cravit
6.3.2.2 Cravit: Sales Forecast 2018-2028
6.3.2.3 Levaquin
6.3.2.4 Levaquin: Sales Forecast 2018-2028
6.3.2.5 Others
6.3.2.6 Others: Sales Forecast 2018-2028
6.3.3. Taisho Pharmaceutical Holdings: SWOT Analysis
6.4 Meiji Holdings Company, Ltd.: Overview
6.4.1. Meiji Holdings Company, Ltd.: Antibiotics Drugs Portfolio
6.4.2 Meiji Holdings Company, Ltd. Antibiotics Drug Sales Forecast 2018-2028
6.4.2.1 Meiact/Spectracef
6.4.2.2 Meiact/Spectracef: Sales Forecast 2018-2028
6.4.2.3 Others
6.4.2.4 Others: Sales Forecast 2018-2028
6.4.3. Meiji Holdings Company, Ltd
6.5 Astellas Pharma: Overview
6.5.1 Astellas Pharma: Antibiotics Drugs Portfolio
6.5.2 Astellas Pharma Antibiotics Drug Sales Forecast 2018-2028
6.5.2.1 Dificid
6.5.2.2 Dificid: Sales Forecast 2018-2028
6.5.2.3 Others
6.5.2.4 Others: Sales Forecast 2018-2028
6.5.3. Astellas Pharma
7. Leading Others Antibiotics Drugs Manufacturers 2018-2028
7.1 Sun Pharmaceutical Industries: Overview
7.1.1 Sun Pharmaceutical Industries: Antibiotics Drugs Portfolio
7.1.2 Sun Pharmaceutical Industries Antibiotics Drug Sales Forecast 2018-2028
7.1.2.1 Ciprofloxacin Hydrochloride
7.1.2.2 Ciprofloxacin Hydrochloride: Sales Forecast 2018-2028
7.1.2.3 Others
7.1.2.4 Others: Sales Forecast 2018-2028
7.1.3 Sun Pharmaceutical Industries: SWOT Analysis
7.2 Cipla: Overview
7.2.1 Cipla: Antibiotics Drugs Portfolio
7.2.2 Cipla Antibiotics Drug Sales Forecast 2018-2028
7.2.2.1 Amoxicillin
7.2.2.2 Amoxicillin: Sales Forecast 2018-2028
7.2.2.3 Others
7.2.2.4 Others: Sales Forecast 2018-2028
7.2.3. Cipla
7.3 Lupin Limited: Overview
7.3.1 Lupin: Antibiotics Drugs Portfolio
7.3.2 Lupin Antibiotics Drug Sales Forecast 2018-2028
7.3.2.1 Cefixime
7.3.2.2 Cefixime: Sales Forecast 2018-2028
7.3.2.3 Cephalexin
7.3.2.4 Cephalexin: Sales Forecast 2018-2028
7.3.2.5 Others
7.3.2.6 Others: Sales Forecast 2018-2028
7.3.3. Lupin: SWOT Analysis
7.4 Shanghai Pharmaceuticals Holding: Overview
7.4.1. Shanghai Pharmaceuticals Holding: Antibiotics Drugs Portfolio
7.4.2 Shanghai Pharmaceuticals Holding Antibiotics Drug Sales Forecast 2018-2028
7.4.2.1 Cefotaxime Sodium
7.4.2.2 Cefotaxime Sodium: Sales Forecast 2018-2028
7.4.2.3 Cefotiam Hydrochloride
7.4.2.4 Cefotiam Hydrochloride: Sales Forecast 2018-2028
7.4.2.5 Ceftriaxone Sodium
7.4.2.6 Ceftriaxone Sodium: Sales Forecast 2018-2028
7.4.3. Shanghai Pharmaceuticals Holding: SWOT Analysis
7.5 Dr. Reddy’s Laboratories: Overview
7.5.1 Dr. Reddy’s Laboratories: Antibiotics Drugs Portfolio
7.5.2.1 Amoxil
7.5.2.2 Amoxil: Sales Forecast 2018-2028
7.5.2.3 Ciprofloxacin Hydrochloride
7.5.2.4 Ciprofloxacin Hydrochloride: Sales Forecast 2018-2028
7.5.3. Dr. Reddy’s Laboratories: SWOT Analysis
7.6 TaiGen Biotechnology: Overview
7.6.1. TaiGen Biotechnology: Antibiotics Drugs Portfolio
7.6.2 TaiGen Biotechnology Antibiotics Drug Sales Forecast 2018-2028
7.6.2.1 Taigexyn
7.6.2.2 Taigexyn: Sales Forecast 2018-2028
7.4.3. TaiGen Biotechnology
8. Conclusions
8.1 The World Antibiotics Drugs Market in 2016 and 2017
8.1.1 Current Leading Antibiotics Drugs Segments
8.1.2 Leading Antibiotics Drugs Manufacturer Markets
8.2 World Antibiotics drugs Market Forecast 2018-2028
8.3 The Future of the Antibiotics drugs Market?
Appendix
Associated Visiongain Reports
Visiongain Report Sales Order Form
About Visiongain
Visiongain Report Evaluation Form
List of Tables
Table 3.1 Global Antibiotics Drugs Market by Product Type: Revenue ($m) and Market Share (%), 2017
Table 3.2 Global Antibiotics Drugs Market Forecast, By Automation Type: Revenues ($m), AGR (%), CAGR (%), 2016-2028
Table 3.3 Top 10 Antibiotics Drugs Manufacturer: Revenue ($m), Market Share (%), 2017
Table 3.4 Top 25 Antibiotics Drugs Manufacturer Revenue ($m), 2017
Table 3.5 Global Antibiotics Drugs Market Forecast, By Manufacturer: Revenues ($m), AGR (%), CAGR (%), 2016-2028
Table 3.6 Global Antibiotics Drugs Market Forecast, By Product Type: Revenues ($m), AGR (%), CAGR (%), 2016-2028
Table 3.7 Cephalosporins Drugs Market Forecast: Revenues ($m), AGR (%), CAGR (%), 2016-2028
Table 3.8 Penicillins Market Forecast: Revenues ($m), AGR (%), CAGR (%), 2016-2028
Table 3.9 Fluoroquinolones Drugs Market Forecast: Revenues ($m), AGR (%), CAGR (%), 2016-2028
Table 3.10 Macrolides Drugs Market Forecast: Revenues ($m), AGR (%), CAGR (%), 2016-2028
Table 3.11 Carbapenems Drugs Market Forecast: Revenues ($m), AGR (%), CAGR (%), 2016-2028
Table 3.12 Others Drugs Market Forecast: Revenues ($m), AGR (%), CAGR (%), 2016-2028
Table 4.1 Pfizer, Inc.: Overview, 2018
Table 4.2 Pfizer: Antibiotics Drug Products, Revenue ($m), Growth Rate (%), 2016 and 2017
Table 4.3 Pfizer Antibiotics Drug Revenue ($m), AGR (%) and CAGR (%), 2016-2028
Table 4.4 Pfizer: Sulperazon Revenue ($m), AGR (%) and CAGR (%), 2016-2028
Table 4.5 Pfizer: Unasyn Revenue ($m), AGR (%) and CAGR (%), 2016-2028
Table 4.6 Pfizer: Zithromax Revenue ($m), AGR (%) and CAGR (%), 2016-2028
Table 4.7 Pfizer: Dalacin Revenue ($m), AGR (%) and CAGR (%), 2016-2028
Table 4.8 Pfizer: Merrem/Meropen Revenue ($m), AGR (%) and CAGR (%), 2016-2028
Table 4.9 Pfizer: Zyvox Revenue ($m), AGR (%) and CAGR (%), 2016-2028
Table 4.10 Pfizer: Tygacil Revenue ($m), AGR (%) and CAGR (%), 2016-2028
Table 4.11 Pfizer: Others Revenue ($m), AGR (%) and CAGR (%), 2016-2028
Table 4.12 Pfizer: Antibiotics Drugs Market SWOT Analysis, 2018-2028
Table 4.13 Merck & Co.: Overview, 2018
Table 4.14 Merck & Co.: Antibiotics Drug Products, Revenue ($m), Growth Rate (%), 2016 and 2017
Table 4.15 Merck & Co. Antibiotics Drug Revenue ($m), AGR (%) and CAGR (%), 2016-2028
Table 4.16 Merck & Co.: Cubicin Revenue ($m), AGR (%) and CAGR (%), 2016-2028
Table 4.17 Merck & Co.: Invanz Revenue ($m), AGR (%) and CAGR (%), 2016-2028
Table 4.18 Merck & Co.: Avelox Revenue ($m), AGR (%) and CAGR (%), 2016-2028
Table 4.19 Merck & Co.: Primaxin Revenue ($m), AGR (%) and CAGR (%), 2016-2028
Table 4.20 Merck & Co.: Others Revenue ($m), AGR (%) and CAGR (%), 2016-2028
Table 4.21 Merck & Co.: Antibiotics Drugs Market SWOT Analysis, 2018-2028
Table 4.22 Johnson & Johnson: Overview, 2018
Table 4.23 Johnson & Johnson: Antibiotics Drug Products, Revenue ($m), Growth Rate (%), 2016 and 2017
Table 4.24 Johnson & Johnson Antibiotics Drug Revenue ($m), AGR (%) and CAGR (%), 2016-2028
Table 4.25 Johnson & Johnson: Zeftera Revenue ($m), AGR (%) and CAGR (%), 2016-2028
Table 4.26 Johnson & Johnson: Sirturo Revenue ($m), AGR (%) and CAGR (%), 2016-2028
Table 4.27 Johnson & Johnson: Others Revenue ($m), AGR (%) and CAGR (%), 2016-2028
Table 4.28 Johnson & Johnson: Antibiotics Drugs Market SWOT Analysis, 2018-2028
Table 4.29 Cubist Pharmaceuticals: Overview, 2018
Table 4.30 Cubist Pharmaceuticals: Antibiotics Drug Products, Revenue ($m), Growth Rate (%), 2016 and 2017
Table 4.31 Cubist Pharmaceuticals Antibiotics Drug Revenue ($m), AGR (%) and CAGR (%), 2016-2028
Table 4.32 Cubist Pharmaceuticals: Cubicin Revenue ($m), AGR (%) and CAGR (%), 2016-2028
Table 4.33 Cubist Pharmaceuticals: Sivextro Oral Revenue ($m), AGR (%) and CAGR (%), 2016-2028
Table 4.34 Cubist Pharmaceuticals: Others Revenue ($m), AGR (%) and CAGR (%), 2016-2028
Table 4.35 Cubist Pharmaceuticals: Antibiotics Drugs Market SWOT Analysis, 2018-2028
Table 4.36 Abbott Laboratories: Overview, 2018
Table 4.37 Abbott Laboratories: Antibiotics Drug Products, Revenue ($m), Growth Rate (%), 2016 and 2017
Table 4.38 Abbott Laboratories Antibiotics Drug Revenue ($m), AGR (%) and CAGR (%), 2016-2028
Table 4.39 Abbott Laboratories: Baxin Revenue ($m), AGR (%) and CAGR (%), 2016-2028
Table 4.40 Abbott Laboratories: Others Revenue ($m), AGR (%) and CAGR (%), 2016-2028
Table 4.41 Abbott Laboratories: Antibiotics Drugs Market SWOT Analysis, 2018-2028
Table 4.42 Eli Lilly & Co.: Overview, 2018
Table 4.43 Eli Lilly & Co.: Antibiotics Drug Products, Revenue ($m), Growth Rate (%), 2016 and 2017
Table 4.44 Eli Lilly & Co. Antibiotics Drug Revenue ($m), AGR (%) and CAGR (%), 2016-2028
Table 4.45 Eli Lilly & Co.: Vancocin Revenue ($m), AGR (%) and CAGR (%), 2016-2028
Table 4.46 Eli Lilly & Co.: Ceclor Revenue ($m), AGR (%) and CAGR (%), 2016-2021
Table 4.47 Eli Lilly & Co.: Antibiotics Drugs Market SWOT Analysis, 2018-2028
Table 4.48 Melinta Therapeutics, Inc.: Overview, 2018
Table 4.49 Melinta Therapeutics, Inc.: Antibiotics Drug Products, Revenue ($m), Growth Rate (%), 2016 and 2017
Table 4.50 Melinta Therapeutics, Inc. Antibiotics Drug Revenue ($m), AGR (%) and CAGR (%), 2016-2028
Table 4.51 Melinta Therapeutics, Inc: Orbactiv Revenue ($m), AGR (%) and CAGR (%), 2016-2028
Table 4.52 Melinta Therapeutics, Inc: Others Revenue ($m), AGR (%) and CAGR (%), 2016-2028
Table 4.53 Melinta Therapeutics, Inc.: Antibiotics Drugs Market SWOT Analysis, 2018-2028
Table 5.1 Novartis: Overview, 2018
Table 5.2 Novartis: Antibiotics Drug Products, Revenue ($m), Growth Rate (%), 2016 and 2017
Table 5.3 Novartis Antibiotics Drug Revenue ($m), AGR (%) and CAGR (%), 2016-2028
Table 5.4 Novartis: Vigamox Revenue ($m), AGR (%) and CAGR (%), 2016-2028
Table 5.5 Novartis: Ciprodex Revenue ($m), AGR (%) and CAGR (%), 2016-2028
Table 5.6 Novartis: TOBI Podhaler Revenue ($m), AGR (%) and CAGR (%), 2016-2028
Table 5.7 Novartis: Cubicin Revenue ($m), AGR (%) and CAGR (%), 2016-2028
Table 5.8 Novartis: Antibiotics Drugs Market SWOT Analysis, 2018-2028
Table 5.9 GlaxoSmithKline plc: Overview, 2018
Table 5.10 GlaxoSmithKline plc: Antibiotics Drug Products, Revenue ($m), Growth Rate (%), 2016 and 2017
Table 5.11 GlaxoSmithKline plc Antibiotics Drug Revenue ($m), AGR (%) and CAGR (%), 2016-2028
Table 5.12 GlaxoSmithKline plc: Ceftin/Zinnat Revenue ($m), AGR (%) and CAGR (%), 2016-2028
Table 5.13 GlaxoSmithKline plc: Augmentin IR Revenue ($m), AGR (%) and CAGR (%), 2016-2028
Table 5.14 GlaxoSmithKline plc: Amoxil Revenue ($m), AGR (%) and CAGR (%), 2016-2028
Table 5.15 GlaxoSmithKline plc: Others Revenue ($m), AGR (%) and CAGR (%), 2016-2028
Table 5.16 GlaxoSmithKline plc: Antibiotics Drugs Market SWOT Analysis, 2018-2028
Table 5.17 Bayer AG: Overview, 2018
Table 5.18 Bayer AG: Antibiotics Drug Products, Revenue ($m), Growth Rate (%), 2016 and 2017
Table 5.19 Bayer AG Antibiotics Drug Revenue ($m), AGR (%) and CAGR (%), 2016-2028
Table 5.20 Bayer AG: Avelox Revenue ($m), AGR (%) and CAGR (%), 2016-2028
Table 5.21 Bayer AG: Cipro/Cirpobay Revenue ($m), AGR (%) and CAGR (%), 2016-2028
Table 5.22 Bayer AG: Antibiotics Drugs Market SWOT Analysis, 2018-2028
Table 5.23 Allergan plc: Overview, 2018
Table 5.24 Allergan plc: Antibiotics Drug Products, Revenue ($m), Growth Rate (%), 2016 and 2017
Table 5.25 Allergan plc Antibiotics Drug Revenue ($m), AGR (%) and CAGR (%), 2016-2028
Table 5.26 Allergan plc: Zinforo/Teflaro Revenue ($m), AGR (%) and CAGR (%), 2016-2028
Table 5.27 Allergan plc: Dalbavancin Revenue ($m), AGR (%) and CAGR (%), 2016-2028
Table 5.28 Allergan plc: Others Revenue ($m), AGR (%) and CAGR (%), 2016-2028
Table 5.29 Allergan plc: Antibiotics Drugs Market SWOT Analysis, 2018-2028
Table 5.30 F. Hoffmann-La Roche AG: Overview, 2018
Table 5.31 F. Hoffmann-La Roche AG: Antibiotics Drug Products, Revenue ($m), Growth Rate (%), 2016 and 2017
Table 5.32 F. Hoffmann-La Roche AG Antibiotics Drug Revenue ($m), AGR (%) and CAGR (%), 2016-2028
Table 5.33 F. Hoffmann-La Roche AG: Rocephin Revenue ($m), AGR (%) and CAGR (%), 2016-2028
Table 5.34 F. Hoffmann-La Roche AG: Antibiotics Drugs Market SWOT Analysis, 2018-2028
Table 5.35 Sanofi: Overview, 2018
Table 5.36 Sanofi: Antibiotics Drug Products, Revenue ($m), Growth Rate (%), 2016 and 2017
Table 5.37 Sanofi Antibiotics Drug Revenue ($m), AGR (%) and CAGR (%), 2016-2028
Table 5.38 Sanofi: Targocid Revenue ($m), AGR (%) and CAGR (%), 2016-2028
Table 5.39 Sanofi: Others Revenue ($m), AGR (%) and CAGR (%), 2016-2028
Table 5.40 Sanofi: Antibiotics Drugs Market SWOT Analysis, 2018-2028
Table 5.41 STADA Arzneimittel: Overview, 2018
Table 5.42 STADA Arzneimittel: Antibiotics Drug Products, Revenue ($m), Growth Rate (%), 2016 and 2017
Table 5.43 STADA Arzneimittel Antibiotics Drug Revenue ($m), AGR (%) and CAGR (%), 2016-2028
Table 5.44 STADA Arzneimittel: Amoxicillin Revenue ($m), AGR (%) and CAGR (%), 2016-2028
Table 5.45 STADA Arzneimittel: Diclofenac Sodium Revenue ($m), AGR (%) and CAGR (%), 2016-2028
Table 5.46 STADA Arzneimittel: Antibiotics Drugs Market SWOT Analysis, 2018-2028
Table 6.1 Shionogi & Co., Ltd.: Overview, 2018
Table 6.2 Shionogi & Co., Ltd.: Antibiotics Drug Products, Revenue ($m), Growth Rate (%), 2016 and 2017
Table 6.3 Shionogi & Co., Ltd. Antibiotics Drug Revenue ($m), AGR (%) and CAGR (%), 2016-2028
Table 6.4 Shionogi & Co., Ltd.: Flomox/Flumarin Revenue ($m), AGR (%) and CAGR (%), 2016-2028
Table 6.5 Shionogi & Co., Ltd.: Others Revenue ($m), AGR (%) and CAGR (%), 2016-2028
Table 6.6 Shionogi & Co., Ltd.: Antibiotics Drugs Market SWOT Analysis, 2018-2028
Table 6.7 Taisho Pharmaceutical Holdings: Overview, 2018
Table 6.8 Taisho Pharmaceutical Holdings: Antibiotics Drug Products, Revenue ($m), Growth Rate (%), 2016 and 2017
Table 6.9 Taisho Pharmaceutical Holdings Antibiotics Drug Revenue ($m), AGR (%) and CAGR (%), 2016-2028
Table 6.10 Taisho Pharmaceutical Holdings: Geninax Revenue ($m), AGR (%) and CAGR (%), 2016-2028
Table 6.11 Taisho Pharmaceutical Holdings: Biaxin/Clarith Revenue ($m), AGR (%) and CAGR (%), 2016-2028
Table 6.12 Taisho Pharmaceutical Holdings: Zosyn/Tazocin Revenue ($m), AGR (%) and CAGR (%), 2016-2028
Table 6.13 Taisho Pharmaceutical Holdings: Other Revenue ($m), AGR (%) and CAGR (%), 2016-2028
Table 6.14 Taisho Pharmaceutical Holdings: Antibiotics Drugs Market SWOT Analysis, 2018-2028
Table 6.15 Daiichi Sankyo: Overview, 2018
Table 6.16 Daiichi Sankyo: Antibiotics Drug Products, Revenue ($m), Growth Rate (%), 2016 and 2017
Table 6.17 Daiichi Sankyo Antibiotics Drug Revenue ($m), AGR (%) and CAGR (%), 2016-2028
Table 6.18 Daiichi Sankyo: Cravit Revenue ($m), AGR (%) and CAGR (%), 2016-2028
Table 6.19 Daiichi Sankyo: Levaquin Revenue ($m), AGR (%) and CAGR (%), 2016-2028
Table 6.20 Daiichi Sankyo: Others Revenue ($m), AGR (%) and CAGR (%), 2016-2028
Table 6.21 Taisho Pharmaceutical Holdings: Antibiotics Drugs Market SWOT Analysis, 2018-2028
Table 6.22 Meiji Holdings Company, Ltd.: Overview, 2018
Table 6.23 Meiji Holdings Company, Ltd.: Antibiotics Drug Products, Revenue ($m), Growth Rate (%), 2016 and 2017
Table 6.24 Meiji Holdings Company, Ltd. Antibiotics Drug Revenue ($m), AGR (%) and CAGR (%), 2016-2028
Table 6.25 Meiji Holdings Company, Ltd.: Meiact/Spectracef Revenue ($m), AGR (%) and CAGR (%), 2016-2028
Table 6.26 Meiji Holdings Company, Ltd.: Others Revenue ($m), AGR (%) and CAGR (%), 2016-2028
Table 6.27 Meiji Holdings Company, Ltd: Antibiotics Drugs Market SWOT Analysis, 2018-2028
Table 6.28 Astellas Pharma: Overview, 2018
Table 6.29 Astellas Pharma: Antibiotics Drug Products, Revenue ($m), Growth Rate (%), 2016 and 2017
Table 6.30 Astellas Pharma Antibiotics Drug Revenue ($m), AGR (%) and CAGR (%), 2016-2028
Table 6.31 Astellas Pharma: Dificid Revenue ($m), AGR (%) and CAGR (%), 2016-2028
Table 6.32 Astellas Pharma: Others Revenue ($m), AGR (%) and CAGR (%), 2016-2028
Table 6.33 Astellas Pharma: Antibiotics Drugs Market SWOT Analysis, 2018-2028
Table 7.1 Sun Pharmaceutical Industries: Overview, 2018
Table 7.2 Sun Pharmaceutical Industries: Antibiotics Drug Products, Revenue ($m), Growth Rate (%), 2016 and 2017
Table 7.3 Sun Pharmaceutical Industries Antibiotics Drug Revenue ($m), AGR (%) and CAGR (%), 2016-2028
Table 7.4 Sun Pharmaceutical Industries: Ciprofloxacin Hydrochloride Revenue ($m), AGR (%) and CAGR (%), 2016-2028
Table 7.5 Sun Pharmaceutical Industries: Others Revenue ($m), AGR (%) and CAGR (%), 2016-2028
Table 7.6 Sun Pharmaceutical Industries: Antibiotics Drugs Market SWOT Analysis, 2018-2028
Table 7.7 Cipla: Overview, 2018
Table 7.8 Cipla: Antibiotics Drug Products, Revenue ($m), Growth Rate (%), 2016 and 2017
Table 7.9 Cipla Antibiotics Drug Revenue ($m), AGR (%) and CAGR (%), 2016-2028
Table 7.10 Cipla: Amoxicillin Revenue ($m), AGR (%) and CAGR (%), 2016-2028
Table 7.11 Cipla: Others Revenue ($m), AGR (%) and CAGR (%), 2016-2028
Table 7.12 Cipla: Antibiotics Drugs Market SWOT Analysis, 2018-2028
Table 7.13 Lupin: Overview, 2018
Table 7.14 Lupin: Antibiotics Drug Products, Revenue ($m), Growth Rate (%), 2016 and 2017
Table 7.15 Lupin Antibiotics Drug Revenue ($m), AGR (%) and CAGR (%), 2016-2028
Table 7.16 Lupin: Cefixime Revenue ($m), AGR (%) and CAGR (%), 2016-2028
Table 7.17 Lupin: Cephalexin Revenue ($m), AGR (%) and CAGR (%), 2016-2028
Table 7.18 Lupin: Others Revenue ($m), AGR (%) and CAGR (%), 2016-2028
Table 7.19 Lupin: Antibiotics Drugs Market SWOT Analysis, 2018-2028
Table 7.20 Shanghai Pharmaceuticals Holding: Overview, 2018
Table 7.21 Shanghai Pharmaceuticals Holding: Antibiotics Drug Products, Revenue ($m), Growth Rate (%), 2016 and 2017
Table 7.22 Shanghai Pharmaceuticals Holding Antibiotics Drug Revenue ($m), AGR (%) and CAGR (%), 2016-2028
Table 7.23 Shanghai Pharmaceuticals Holding: Cefotaxime Sodium Revenue ($m), AGR (%) and CAGR (%), 2016-2028
Table 7.24 Shanghai Pharmaceuticals Holding: Cefotiam Hydrochloride Revenue ($m), AGR (%) and CAGR (%), 2016-2028
Table 7.25 Shanghai Pharmaceuticals Holding: Ceftriaxone Sodium Revenue ($m), AGR (%) and CAGR (%), 2016-2028
Table 7.26 Shanghai Pharmaceuticals Holding: Antibiotics Drugs Market SWOT Analysis, 2018-2028
Table 7.27 Dr. Reddy’s Laboratories: Overview, 2018
Table 7.28 Dr. Reddy’s Laboratories: Antibiotics Drug Products, Revenue ($m), Growth Rate (%), 2016 and 2017
Table 7.29 Dr. Reddy’s Laboratories Antibiotics Drug Revenue ($m), AGR (%) and CAGR (%), 2016-2028
Table 7.30 Dr. Reddy’s Laboratories: Amoxil Revenue ($m), AGR (%) and CAGR (%), 2016-2028
Table 7.31 Dr. Reddy’s Laboratories: Ciprofloxacin Hydrochloride Revenue ($m), AGR (%) and CAGR (%), 2016-2028
Table 7.32 Dr. Reddy’s Laboratories: Antibiotics Drugs Market SWOT Analysis, 2018-2028
Table 7.33 TaiGen Biotechnology: Overview, 2018
Table 7.34 TaiGen Biotechnology: Antibiotics Drug Products, Revenue ($m), Growth Rate (%), 2016 and 2017
Table 7.35 TaiGen Biotechnology Antibiotics Drug Revenue ($m), AGR (%) and CAGR (%), 2016-2028
Table 7.36 TaiGen Biotechnology: Taigexyn Revenue ($m), AGR (%) and CAGR (%), 2016-2028
Table 7.37 TaiGen Biotechnology: Antibiotics Drugs Market SWOT Analysis, 2018-2028
List of Figure
Figure 1.1 Global Antibiotics Drugs Manufacturer Market Segmentation Overview
Figure 3.1 Global Antibiotics Drugs Market by Product Type: Market Share (%), 2017
Figure 3.2 Global Antibiotics Drugs Market by Product Type: Market Share (%), 2017
Figure 3.3 Global Antibiotics Drugs Market Forecast: Revenue ($m), AGR (%), 2016-2028
Figure 3.4 Top 10 Antibiotics Drugs Manufacturer: Revenue ($m), 2017
Figure 3.5 Top 10 Antibiotics Drugs Manufacturer: Market Share (%), 2017
Figure 3.6 Global Antibiotics Drugs Market by Automation Type: Market Share (%), 2017
Figure 3.7 Global Antibiotics Drugs Market by Automation Type: Market Share (%), 2022
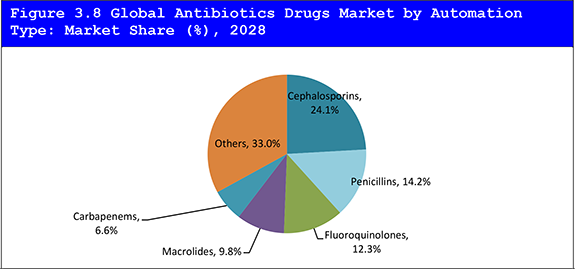
Figure 3.8 Global Antibiotics Drugs Market by Automation Type: Market Share (%), 2028
Figure 3.9 Global Cephalosporins Drugs Market Forecast: Revenue ($m), AGR (%), 2016-2028
Figure 3.10 Global Penicillins Market Forecast: Revenue ($m), AGR (%), 2016-2028
Figure 3.11 Global Fluoroquinolones Drugs Market Forecast: Revenue ($m), AGR (%), 2016-2028
Figure 3.12 Global Macrolides Drugs Market Forecast: Revenue ($m), AGR (%), 2016-2028
Figure 3.13 Global Carbapenems Drugs Market Forecast: Revenue ($m), AGR (%), 2016-2028
Figure 3.14 Global Others Drugs Market Forecast: Revenue ($m), AGR (%), 2016-2028
Figure 4.1 Pfizer Antibiotics Drug: Revenue ($m), AGR (%), 2016-2028
Figure 4.2 Pfizer: Sulperazon: Revenue ($m), AGR (%), 2016-2028
Figure 4.3 Pfizer: Unasyn Revenue ($m), AGR (%), 2016-2028
Figure 4.4 Pfizer: Zithromax Revenue ($m), AGR (%), 2016-2028
Figure 4.5 Pfizer: Dalacin Revenue ($m), AGR (%), 2016-2028
Figure 4.6 Pfizer: Merrem/Meropen Revenue ($m), AGR (%), 2016-2028
Figure 4.7 Pfizer: Zyvox Revenue ($m), AGR (%), 2016-2028
Figure 4.8 Pfizer: Tygacil Revenue ($m), AGR (%), 2016-2028
Figure 4.9 Others: Tygacil Revenue ($m), AGR (%), 2016-2028
Figure 4.10 Merck & Co. Antibiotics Drug: Revenue ($m), AGR (%), 2016-2028
Figure 4.11 Merck & Co.: Cubicin: Revenue ($m), AGR (%), 2016-2028
Figure 4.12 Merck & Co.: Invanz Revenue ($m), AGR (%), 2016-2028
Figure 4.13 Merck & Co.: Avelox Revenue ($m), AGR (%), 2016-2028
Figure4.14 Merck & Co.: Primaxin Revenue ($m), AGR (%), 2016-2028
Figure 4.15 Merck & Co.: Others Revenue ($m), AGR (%), 2016-2028
Figure 4.16 Johnson & Johnson Antibiotics Drug: Revenue ($m), AGR (%), 2016-2028
Figure 4.17 Johnson & Johnson: Zeftera: Revenue ($m), AGR (%), 2016-2028
Figure 4.18 Johnson & Johnson: Sirturo Revenue ($m), AGR (%), 2016-2028
Figure 4.19 Johnson & Johnson: Others Revenue ($m), AGR (%), 2016-2028
Figure 4.20 Cubist Pharmaceuticals Antibiotics Drug: Revenue ($m), AGR (%), 2016-2028
Figure 4.21 Cubist Pharmaceuticals: Cubicin: Revenue ($m), AGR (%), 2016-2028
Figure 4.22 Cubist Pharmaceuticals: Sivextro Oral Revenue ($m), AGR (%), 2016-2028
Figure 4.23 Cubist Pharmaceuticals: Others Revenue ($m), AGR (%), 2016-2028
Figure 4.24 Abbott Laboratories Antibiotics Drug: Revenue ($m), AGR (%), 2016-2028
Figure 4.25 Abbott Laboratories: Baxin Revenue ($m), AGR (%), 2016-2028
Figure 4.26 Abbott Laboratories: Tedizolid Revenue ($m), AGR (%), 2016-2028
Figure 4.27 Eli Lilly & Co. Antibiotics Drug: Revenue ($m), AGR (%), 2016-2028
Figure 4.28 Eli Lilly & Co.: Vancocin Revenue ($m), AGR (%), 2016-2028
Figure 4.29 Eli Lilly & Co.: Ceclor Revenue ($m), AGR (%), 2016-2021
Figure 4.30 Melinta Therapeutics, Inc.Antibiotics Drug: Revenue ($m), AGR (%), 2016-2028
Figure 4.31 Melinta Therapeutics, Inc.: Orbactiv Revenue ($m), AGR (%), 2016-2028
Figure 4.32 Melinta Therapeutics, Inc.: Others Revenue ($m), AGR (%), 2016-2028
Figure 5.1 Novartis Antibiotics Drug: Revenue ($m), AGR (%), 2016-2028
Figure 5.2 Novartis: Vigamox Revenue ($m), AGR (%), 2016-2028
Figure 5.3 Novartis: Ciprodex Revenue ($m), AGR (%), 2016-2028
Figure 5.4 Novartis: TOBI Podhaler Revenue ($m), AGR (%), 2016-2028
Figure 5.5 Novartis: Cubicin Revenue ($m), AGR (%), 2016-2028
Figure 5.6 GlaxoSmithKline plc Antibiotics Drug: Revenue ($m), AGR (%), 2016-2028
Figure 5.7 GlaxoSmithKline plc: Ceftin/Zinnat: Revenue ($m), AGR (%), 2016-2028
Figure 5.8 GlaxoSmithKline plc: Augmentin IR Revenue ($m), AGR (%), 2016-2028
Figure 5.9 GlaxoSmithKline plc: Amoxil Revenue ($m), AGR (%), 2016-2028
Figure 5.10 GlaxoSmithKline plc: Others Revenue ($m), AGR (%), 2016-2028
Figure 5.11 Bayer AG Antibiotics Drug: Revenue ($m), AGR (%), 2016-2028
Figure 5.12 Bayer AG: Avelox Revenue ($m), AGR (%), 2016-2028
Figure 5.13 Bayer AG: Cipro/Cirpobay Revenue ($m), AGR (%), 2016-2028
Figure 5.14 Allergan plc Antibiotics Drug: Revenue ($m), AGR (%), 2016-2028
Figure 5.15 Allergan plc: Zinforo/Teflaro Revenue ($m), AGR (%), 2016-2028
Figure 5.16 Allergan plc: Dalbavancin Revenue ($m), AGR (%), 2016-2028
Figure 5.17 Allergan plc: Others Revenue ($m), AGR (%), 2016-2028
Figure 5.18 F. Hoffmann-La Roche AG Antibiotics Drug: Revenue ($m), AGR (%), 2016-2028
Figure 5.19 F. Hoffmann-La Roche AG: Rocephin Revenue ($m), AGR (%), 2016-2028
Figure 5.20 Sanofi Antibiotics Drug: Revenue ($m), AGR (%), 2016-2028
Figure 5.21 Sanofi: Targocid Revenue ($m), AGR (%), 2016-2028
Figure 5.22 Sanofi: Others Revenue ($m), AGR (%), 2016-2028
Figure 5.23 STADA ArzneimittelAntibiotics Drug: Revenue ($m), AGR (%), 2016-2028
Figure 5.24 STADA Arzneimittel: Amoxicillin Revenue ($m), AGR (%), 2016-2028
Figure 5.25 STADA Arzneimittel: Diclofenac Sodium Revenue ($m), AGR (%), 2016-2028
Figure 6.1 Shionogi & Co., Ltd. Antibiotics Drug: Revenue ($m), AGR (%), 2016-2028
Figure 6.2 Shionogi & Co., Ltd.: Flomox/Flumarin Revenue ($m), AGR (%), 2016-2028
Figure 6.3 Shionogi & Co., Ltd.: Others Revenue ($m), AGR (%), 2016-2028
Figure 6.4 Taisho Pharmaceutical Holdings Antibiotics Drug: Revenue ($m), AGR (%), 2016-2028
Figure 6.5 Taisho Pharmaceutical Holdings: Geninax Revenue ($m), AGR (%), 2016-2028
Figure 6.6 Taisho Pharmaceutical Holdings: Biaxin/Clarith Revenue ($m), AGR (%), 2016-2028
Figure 6.7 Taisho Pharmaceutical Holdings: Zosyn/Tazocin Revenue ($m), AGR (%), 2016-2028
Figure 6.8 Taisho Pharmaceutical Holdings: Other Revenue ($m), AGR (%), 2016-2028
Figure 6.9 Daiichi Sankyo Antibiotics Drug: Revenue ($m), AGR (%), 2016-2028
Figure 6.10 Daiichi Sankyo: Cravit Revenue ($m), AGR (%), 2016-2028
Figure 6.11 Daiichi Sankyo: Levaquin Revenue ($m), AGR (%), 2016-2028
Figure 6.12 Daiichi Sankyo: Others Revenue ($m), AGR (%), 2016-2028
Figure 6.13 Meiji Holdings Company, Ltd. Antibiotics Drug: Revenue ($m), AGR (%), 2016-2028
Figure 6.14 Meiji Holdings Company, Ltd.: Meiact/Spectracef Revenue ($m), AGR (%), 2016-2028
Figure 6.15 Meiji Holdings Company, Ltd.: Others Revenue ($m), AGR (%), 2016-2028
Figure 6.16 Astellas Pharma Antibiotics Drug: Revenue ($m), AGR (%), 2016-2028
Figure 6.17 Astellas Pharma: Dificid Revenue ($m), AGR (%), 2016-2028
Figure 6.18 Astellas Pharma: Tedizolid Revenue ($m), AGR (%), 2016-2028
Figure 7.1 Sun Pharmaceutical Industries Antibiotics Drug: Revenue ($m), AGR (%), 2016-2028
Figure 7.2 Sun Pharmaceutical Industries: Ciprofloxacin Hydrochloride Revenue ($m), AGR (%), 2016-2028
Figure 7.3 Sun Pharmaceutical Industries: Others Revenue ($m), AGR (%), 2016-2028
Figure 7.4 Cipla Antibiotics Drug: Revenue ($m), AGR (%), 2016-2028
Figure 7.5 Cipla: Amoxicillin Revenue ($m), AGR (%), 2016-2028
Figure 7.6 Cipla: Others Revenue ($m), AGR (%), 2016-2028
Figure 7.7 Lupin Antibiotics Drug: Revenue ($m), AGR (%), 2016-2028
Figure 7.8 Lupin: Cefixime Revenue ($m), AGR (%), 2016-2028
Figure 7.9 Lupin: Cephalexin Revenue ($m), AGR (%), 2016-2028
Figure 7.10 Lupin: Others Revenue ($m), AGR (%), 2016-2028
Figure 7.11 Shanghai Pharmaceuticals Holding Antibiotics Drug: Revenue ($m), AGR (%), 2016-2028
Figure 7.12 Shanghai Pharmaceuticals Holding: Cefotaxime Sodium Revenue ($m), AGR (%), 2016-2028
Figure 7.13 Shanghai Pharmaceuticals Holding: Tedizolid Revenue ($m), AGR (%), 2016-2028
Figure 7.14 Shanghai Pharmaceuticals Holding: Ceftriaxone Sodium Revenue ($m), AGR (%), 2016-2028
Figure 7.15 Dr. Reddy’s Laboratories Antibiotics Drug: Revenue ($m), AGR (%), 2016-2028
Figure 7.16 Dr. Reddy’s Laboratories: Amoxil Revenue ($m), AGR (%), 2016-2028
Figure 7.17 Dr. Reddy’s Laboratories: Ciprofloxacin Hydrochloride Revenue ($m), AGR (%), 2016-2028
Figure 7.18 TaiGen Biotechnology Antibiotics Drug: Revenue ($m), AGR (%), 2016-2028
Figure 7.19 TaiGen Biotechnology: Taigexyn Revenue ($m), AGR (%), 2016-2028
Figure 8.1 Global Antibiotics drugs Market by Product Type: Market Share (%), 2016
Figure 8.2 Top Antibiotics drugs Manufacturer Share (%), 2016