Industries > Pharma > Top 20 Vaccines Manufacturers 2019
Top 20 Vaccines Manufacturers 2019
Merck & Co., Sanofi, Pfizer, GlaxoSmithKline, Johnson & Johnson, AstraZeneca, Emergent Biosolutions, Other Companies
The global vaccines market has witnessed strong growth in past few years. The top 5 manufacturers in the global vaccines market are, Merck & Co., Inc., Sanofi, Pfizer Inc., GlaxoSmithKline PLC, and Johnson & Johnson. These companies secured about 76% revenue share in the global vaccines market.
How this report will benefit you
Read on to discover how you can exploit the future business opportunities emerging in this sector.
In this brand new report you will find 157-page report and you will receive 90 tables and 75 figures – all unavailable elsewhere.
The 157-page report provides clear detailed insight into the Top 20 Vaccines Manufacturers 2019. Discover the key drivers and challenges affecting the market.
By ordering and reading our brand new report today you stay better informed and ready to act.
Report Scope
• Assessment of the leading companies in the global vaccines market:
• Astellas Pharma Inc.
• AstraZeneca
• Bavarian Nordic
• CSL Ltd.
• Emergent Biosolutions, Inc.
• F. Hoffmann-La Roche Ltd.
• Gilead Sciences
• GlaxoSmithKline PLC
• Inovio Pharmaceuticals
• Johnson & Johnson
• Merck & Co., Inc.
• Mitsubishi Tanabe Pharma Corporation
• Novavax, Inc.
• Pfizer Inc.
• Sanofi
• SELLAS Life Sciences Group, Inc.
• Serum Institute of India Pvt. Ltd.
• Sun Pharmaceutical Industries Ltd.
• Takeda Pharmaceutical Company Ltd.
• Teva Pharmaceutical
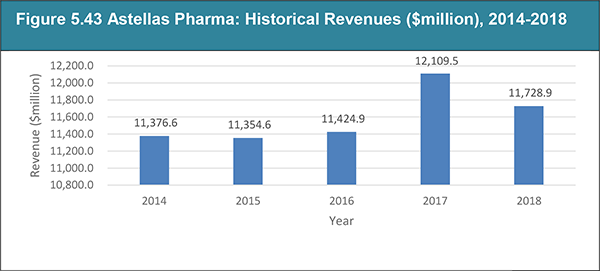
This report discusses financial outlook, product portfolio and strategic developments.
• Revenues forecast from 2017-2028 for the US, Europe and Japan Vaccines Market.
• Market share of key companies in the vaccines market.
• Market share of leading vaccines in the global vaccines market.
• Drivers, Challenges and Opportunities for the global vaccines market.
• A SWOT analysis of the global vaccines market.
Visiongain’s study is intended for anyone requiring commercial analyses for the Top 20 Vaccines Manufacturers 2019. You find data, trends and predictions.
Buy our report today Top vaccine manufacturers Market Analysis : Merck & Co., Sanofi, Pfizer, GlaxoSmithKline, Johnson & Johnson, AstraZeneca, Emergent Biosolutions, Other Companies.
Visiongain is a trading partner with the US Federal Government
CCR Ref number: KD4R6
1. Report Overview
1.1 Overview of the Global Vaccines Market
1.2 Why You Should Read This Report
1.3 Benefits of This Report
1.4 Report Structure
1.5 Who is This Report For?
1.6 Methodology
1.6.1 Primary Research
1.6.2 Secondary Research
1.7 Frequently Asked Questions (FAQs)
1.8 Associated Visiongain Reports
1.9 About Visiongain
2. Introduction to the World Human Vaccines Market
2.1 Vaccines Market Definition
2.2 Vaccines Market Segmentation
2.2.1 Vaccine Types:
2.2.1.1 Inactivated Vaccines
2.2.1.2 Live Attenuated Vaccines
2.2.1.3 Conjugate Vaccines
2.2.1.4 Recombinant Vector Vaccines
2.2.2 Vaccine Submarket
2.2.2.1 Paediatric vaccines
2.2.2.2 Adult vaccines
2.2.2.3 Elderly vaccines
2.2.2.4 Travel vaccines
2.2.2.5 Therapeutic Vaccines
2.3 Demand for Vaccines in Regional Markets
2.3.1 U.S. Vaccines Market Overview - 2018
2.3.2 Europe Vaccines Market Overview- 2018
2.3.3 Japan Vaccines Market Overview- 2018
3. World Vaccine Market Outlook, 2017-2028
3.1 Global Vaccines Market 2018 Overview
3.2 The World Vaccine Market: Industry Trends, 2017-2028
3.3 Drivers and Challenges for the Global Vaccines Market
3.3.1 Drivers
3.3.1.1 Growing demand from emerging markets
3.3.1.2 Increasing birth rates in developing countries
3.3.1.3 Rise in ageing population globally
3.3.2 Challenges
3.3.2.1 Funding can be difficult to sustain
3.3.2.2 Oligarchic market presents barrier to entry
3.3.3 Opportunities
3.3.3.1 Advancements in vaccine technology and a strong culture of innovation and R&D pipelines
3.3.3.2 Growing awareness of benefits of vaccinations amongst adults
4. Leading 20 Companies Ranking in the Vaccines Market
4.1 Leading 20 Companies Ranking in the Vaccines Market 2018
4.2 Global Vaccines Market Forecast, 2017-2028
5. Top 20 Vaccines Manufacturers
5.1 Merck & Co., Inc. Overview
5.1.1 Merck Financial Outlook
5.1.2 Merck Product Portfolio
5.1.3 Merck Strategic Developments
5.2 Sanofi Overview
5.2.1 Sanofi Financial Outlook
5.2.2 Sanofi Product Portfolio
5.2.3 Sanofi Strategic Developments
5.3 Pfizer Overview
5.3.1 Pfizer Financial Outlook
5.3.2 Pfizer Product Portfolio
5.3.3 Pfizer Strategic Developments
5.4 GlaxoSmithKline PLC Overview
5.4.1 GlaxoSmithKline PLC Financial Outlook
5.4.2 GlaxoSmithKline PLC Product Portfolio
5.4.3 GlaxoSmithKline PLC Strategic Developments
5.5 Johnson & Johnson Overview
5.5.1 Johnson & Johnson Financial Outlook
5.5.2 Johnson & Johnson Product Portfolio
5.5.3 Johnson & Johnson Strategic Developments
5.6 AstraZeneca Overview
5.6.1 AstraZeneca Financial Outlook
5.6.2 AstraZeneca Product Portfolio
5.6.3 AstraZeneca Strategic Developments
5.7 Emergent Biosolutions Overview
5.7.1 Emergent Biosolutions Financial Outlook
5.7.2 Emergent Biosolutions Product Portfolio
5.7.3 Emergent Biosolutions Strategic Developments
5.8 CSL Ltd. Overview
5.8.1 CSL Ltd. Financial Outlook
5.8.2 CSL Ltd. Product Portfolio
5.8.3 CSL Ltd. Strategic Developments
5.9 Serum Institute of India Pvt. Ltd. Overview
5.9.1 Serum Institute of India Pvt. Ltd. Financial Outlook
5.9.2 Serum Institute of India Pvt. Ltd. Product Portfolio
5.9.3 Serum Institute of India Pvt. Ltd. Strategic Developments
5.10 Astellas Pharma Overview
5.10.1 Astellas Pharma Financial Outlook
5.10.2 Astellas Pharma Product Portfolio
5.10.3 Astellas Pharma Strategic Developments
5.11 SELLAS Life Sciences Group, Inc. Overview
5.11.1 SELLAS Life Sciences Group, Inc. Financial Outlook
5.11.2 SELLAS Life Sciences Group, Inc. Product Portfolio
5.11.3 SELLAS Life Sciences Group, Inc. Strategic Developments
5.12 Novavax, Inc. Overview
5.12.1 Novavax, Inc. Financial Outlook
5.12.2 Novavax, Inc. Product Portfolio
5.13 Inovio Pharmaceuticals Overview
5.13.1 Inovio Pharmaceuticals Financial Outlook
5.13.2 Inovio Pharmaceuticals Product Portfolio
5.13.3 Inovio Pharmaceuticals Strategic Developments
5.14 Mitsubishi Tanabe Pharma Corporation Overview
5.14.1 Mitsubishi Tanabe Pharma Corporation Financial Outlook
5.14.2 Mitsubishi Tanabe Pharma Corporation Product Portfolio
5.14.3 Mitsubishi Tanabe Pharma Corporation Strategic Developments
5.15 Sun Pharmaceutical Industries Ltd. Overview
5.15.1 Sun Pharmaceutical Industries Ltd. Financial Outlook
5.15.2 Sun Pharmaceutical Industries Ltd. Product Portfolio
5.15.3 Sun Pharmaceutical Industries Ltd. Strategic Developments
5.16 Gilead Sciences Overview
5.16.1 Gilead Sciences Financial Outlook
5.16.2 Gilead Sciences Product Portfolio
5.16.3 Gilead Sciences Strategic Developments
5.17 F. Hoffmann-La Roche Ltd. Overview
5.17.1 F. Hoffmann-La Roche Ltd. Financial Outlook
5.17.2 F. Hoffmann-La Roche Ltd. Product Portfolio
5.17.3 F. Hoffmann-La Roche Ltd. Strategic Developments
5.18 Takeda Pharmaceutical Company Limited Overview
5.18.1 Takeda Pharmaceutical Company Limited. Financial Outlook
5.18.2 Takeda Pharmaceutical Company Limited. Product Portfolio
5.18.3 Takeda Pharmaceutical Company Limited. Strategic Developments
5.19 Teva Pharmaceutical Overview
5.19.1 Teva Pharmaceutical Financial Outlook
5.19.2 Teva Pharmaceutical Product Portfolio
5.19.3 Teva Pharmaceutical Strategic Developments
5.20 Bavarian Nordic Overview
5.20.1 Bavarian Nordic Financial Outlook
5.20.2 Bavarian Nordic Product Portfolio
5.20.3 Bavarian Nordic Strategic Developments
6. SWOT Analysis of the Global Vaccines Market, 2018
6.1 Strengths
6.2 Weaknesses
6.3 Opportunities
6.4 Threats
7. Conclusion
7.1 Strong and Diverse Research and Development
7.2 Oligarchic market presents
7.3 Emerging Markets: High Demand for Vaccines
7.4 Top 20 Companies and Revenue
Appendices
Associated Visiongain Reports
Visiongain Report Sales Order Form
About Visiongain
Visiongain Report Evaluation Form
List of Tables
Table 2.1 The US Vaccines Revenue Forecast ($bn) and Annual Growth (%), 2017-2028
Table 2.2 The Europe Vaccines Revenue Forecast ($bn) and Annual Growth (%), 2017-2028
Table 2.3 Japan Vaccines Revenue Forecast ($bn) and Annual Growth (%), 2017-2028
Table 4.1 Companies Profiled in this Report and Country HQ
Table 4.2 Global Vaccines Revenue Forecast ($bn) and Annual Growth (%), 2017-2028
Table 5.1 Merck & Co., Inc.: Key Facts, 2017
Table 5.2 Merck & Co., Inc.: Revenue ($million) and Revenue Shares (%) by Reporting Segment, 2017
Table 5.3 Merck & Co., Inc.: Product Revenue ($million) and Revenue Shares (%) by Reporting Segment, 2017
Table 5.4 Merck & Co., Inc.: Vaccines Clinical Pipeline
Table 5.5 Merck & Co., Inc.: Vaccines Revenue ($million), AGR (%) 2015-2017
Table 5.6 Merck & Co., Inc.: Vaccines Product Revenue ($million) and Revenue Shares (%), 2017
Table 5.7 Merck & Co., Inc.: Strategic Developments, 2015-2018
Table 5.8 Sanofi: Key Facts, 2017
Table 5.9 Sanofi: Revenue ($million) and Revenue Shares (%) by Reporting Segment, 2017
Table 5.10 Sanofi: Vaccines Clinical Pipeline
Table 5.11 Sanofi: Vaccines Revenue ($million), AGR (%) 2015-2017
Table 5.12 Sanofi: Vaccines Product Revenue ($million) and Revenue Shares (%), 2017
Table 5.13 Sanofi: Strategic Developments, 2015-2018
Table 5.14 Pfizer: Key Facts, 2017
Table 5.15 Pfizer: Revenue ($million) and Revenue Shares (%) by Reporting Segment, 2017
Table 5.16 Pfizer: Product Revenue ($million) and Revenue Shares (%) by Reporting Segment, 2017
Table 5.17 Pfizer: Vaccines Clinical Pipeline
Table 5.18 Pfizer: Vaccines Revenue ($million), AGR (%) 2015-2017
Table 5.19 Pfizer: Vaccines Product Revenue ($million) and Revenue Shares (%), 2017
Table 5.20 Pfizer: Strategic Developments, 2015-2018
Table 5.21 GlaxoSmithKline PLC: Key Facts, 2017
Table 5.22 GlaxoSmithKline PLC: Revenue ($million) and Revenue Shares (%) by Reporting Segment, 2017
Table 5.23 GlaxoSmithKline PLC: Product Revenue ($million) and Revenue Shares (%) by Reporting Segment, 2017
Table 5.24 GlaxoSmithKline PLC: Vaccines Clinical Pipeline
Table 5.25 GlaxoSmithKline PLC: Vaccines Revenue ($million), AGR (%) 2015-2017
Table 5.26 GlaxoSmithKline PLC: Vaccines Product Revenue ($million) and Revenue Shares (%), 2017
Table 5.27 GlaxoSmithKline PLC: Strategic Developments, 2015-2018
Table 5.28 Johnson & Johnson: Key Facts, 2018
Table 5.29 Johnson & Johnson: Revenue ($million) and Revenue Shares (%) by Reporting Segment, 2017
Table 5.30 Johnson & Johnson: Product Revenue ($million) and Revenue Shares (%) by Reporting Segment, 2017
Table 5.31 Johnson & Johnson: Vaccines Clinical Pipeline
Table 5.32 Johnson & Johnson: Infectious Diseases and Vaccines Revenue ($million), AGR (%) 2015-2017
Table 5.33 Johnson & Johnson: Vaccines Product Revenue ($million) and Revenue Shares (%), 2017
Table 5.34 Johnson & Johnson: Strategic Developments, 2015-2018
Table 5.35 AstraZeneca: Key Facts, 2018
Table 5.36 AstraZeneca: Revenue ($million) and Revenue Shares (%) by Reporting Segment, 2017
Table 5.37 AstraZeneca: Infectious Diseases and Vaccines Revenue ($million), AGR (%) 2015-2017
Table 5.38 AstraZeneca: Vaccines Product Revenue ($million) and Revenue Shares (%), 2017
Table 5.39 AstraZeneca: Strategic Developments, 2015-2018
Table 5.40 Emergent Biosolutions: Key Facts, 2018
Table 5.41 Emergent Biosolutions: Revenue ($million) and Revenue Shares (%) by Reporting Segment, 2017
Table 5.42 Emergent Biosolutions: Vaccines Clinical Pipeline
Table 5.43 Emergent Biosolutions: Strategic Developments, 2015-2018
Table 5.44 CSL Ltd.: Key Facts, 2018
Table 5.45 CSL Ltd.: Revenue ($million) and Revenue Shares (%) by Reporting Segment, 2018
Table 5.46 CSL Ltd.: Vaccines Clinical Pipeline
Table 5.47 CSL Ltd.: Strategic Developments, 2015-2018
Table 5.48 Serum Institute of India Pvt. Ltd.: Key Facts, 2018
Table 5.49 Serum Institute of India Pvt. Ltd.: Strategic Developments, 2015-2018
Table 5.50 Astellas Pharma: Key Facts, 2018
Table 5.51 Astellas Pharma: Revenue ($million) and Revenue Shares (%) by Product, 2018
Table 5.52 Astellas Pharma: Vaccines Clinical Pipeline
Table 5.53 Astellas Pharma: Strategic Developments, 2015-2018
Table 5.54 SELLAS Life Sciences Group, Inc.: Key Facts, 2018
Table 5.55 SELLAS Life Sciences Group, Inc.: Vaccines Clinical Pipeline
Table 5.56 SELLAS Life Sciences Group, Inc.: Strategic Developments, 2015-2018
Table 5.57 Novavax, Inc.: Key Facts, 2018
Table 5.58 Novavax, Inc.: Vaccines Clinical Pipeline
Table 5.59 Inovio Pharmaceuticals: Key Facts, 2018
Table 5.60 Inovio Pharmaceuticals: Vaccines Clinical Pipeline
Table 5.61 Inovio Pharmaceuticals: Strategic Developments, 2015-2018
Table 5.62 Mitsubishi Tanabe Pharma Corporation: Key Facts, 2018
Table 5.63 Mitsubishi Tanabe Pharma Corporation: Revenue ($million) and Revenue Shares (%) by Product Type, 2017
Table 5.64 Mitsubishi Tanabe Pharma Corporation: Vaccines Clinical Pipeline
Table 5.65 Mitsubishi Tanabe Pharma Corporation: Vaccines Revenue ($million), AGR (%) 2015-2017
Table 5.66 Mitsubishi Tanabe Pharma Corporation: Vaccines Product Revenue ($million) and Revenue Shares (%), 2017
Table 5.67 Mitsubishi Tanabe Pharma Corporation: Strategic Developments, 2015-2018
Table 5.68 Sun Pharmaceutical Industries Ltd.: Key Facts, 2018
Table 5.69 Sun Pharmaceutical Industries Ltd.: Strategic Developments, 2015-2018
Table 5.70 Gilead Sciences: Key Facts, 2018
Table 5.71 Gilead Sciences: Revenue ($million) and Revenue Shares (%) by Segment, 2017
Table 5.72 Gilead Sciences: Strategic Developments, 2015-2018
Table 5.73 F. Hoffmann-La Roche Ltd.: Key Facts, 2018
Table 5.74 F. Hoffmann-La Roche Ltd.: Vaccines Clinical Pipeline
Table 5.75 F. Hoffmann-La Roche Ltd.: Strategic Developments, 2015-2018
Table 5.76 Takeda Pharmaceutical Company Limited: Key Facts, 2018
Table 5.77 Takeda Pharmaceutical Company: Vaccines Clinical Pipeline
Table 5.78 Takeda Pharmaceutical Company: Strategic Developments, 2015-2018
Table 5.79 Teva Pharmaceutical: Key Facts, 2018
Table 5.80 Teva Pharmaceutical: Revenue ($million) and Revenue Shares (%) by Segment, 2017
Table 5.81 Teva Pharmaceutical: Strategic Developments, 2015-2018
Table 5.82 Bavarian Nordic: Key Facts, 2018
Table 5.83 Bavarian Nordic: Vaccines Clinical Pipeline
Table 5.84 Bavarian Nordic: Strategic Developments, 2015-2018
Table 7.1 Top 20 Companies and Revenue, 2017 ($million)
List of Figures
Figure 4.1 Market Share of Key Companies in the Vaccines Market (%), 2017
Figure 4.2 Market Share of Leading Vaccines in the Market (%), 2017
Figure 4.3 Global Vaccines Revenue ($bn), 2017-2028
Figure 5.1 Merck & Co., Inc.: Historical Revenues ($million), 2013-2017
Figure 5.2 Merck & Co., Inc.: Revenue Shares (%) by Reporting Segment, 2017
Figure 5.3 Merck & Co., Inc.: Revenue Shares (%) by Reporting Segment, 2017
Figure 5.4 Merck & Co., Inc.: Revenue Shares (%) by Region, 2017
Figure 5.5 Merck & Co., Inc.: Diagnostics Revenue ($million), 2015-2017
Figure 5.6 Merck & Co., Inc.: Vaccines Product Revenue Shares (%), 2017
Figure 5.7 Sanofi: Historical Revenues ($million), 2013-2017
Figure 5.8 Sanofi: Revenue Shares (%) by Reporting Segment, 2017
Figure 5.9 Sanofi: Revenue Shares (%) by Region, 2017
Figure 5.10 Sanofi: Diagnostics Revenue ($million), 2015-2017
Figure 5.11 Sanofi: Vaccines Product Revenue Shares (%), 2017
Figure 5.12 Pfizer: Historical Revenues ($million), 2013-2017
Figure 5.13 Pfizer: Revenue Shares (%) by Reporting Segment, 2017
Figure 5.14 Merck & Co., Inc.: Revenue Shares (%) by Reporting Segment, 2017
Figure 5.15 Pfizer: Revenue Shares (%) by Region, 2017
Figure 5.16 Pfizer: Diagnostics Revenue ($million), 2015-2017
Figure 5.17 Pfizer: Vaccines Product Revenue Shares (%), 2017
Figure 5.18 GlaxoSmithKline PLC: Historical Revenues ($million), 2013-2017
Figure 5.19 GlaxoSmithKline PLC: Revenue Shares (%) by Reporting Segment, 2017
Figure 5.20 GlaxoSmithKline PLC: Revenue Shares (%) by Product, 2017
Figure 5.21 GlaxoSmithKline PLC: Revenue Shares (%) by Region, 2017
Figure 5.22 GlaxoSmithKline PLC: Diagnostics Revenue Shares (%), 2017
Figure 5.23 GlaxoSmithKline PLC: Vaccines Revenue Shares (%), 2017
Figure 5.24 GlaxoSmithKline PLC: Vaccines Revenue by Region ($million), 2017
Figure 5.25 Johnson & Johnson: Historical Revenues ($million), 2013-2017
Figure 5.26 Johnson & Johnson: Revenue Shares (%) by Reporting Segment, 2017
Figure 5.27 Johnson & Johnson: Revenue Shares (%) by Product, 2017
Figure 5.28 Johnson & Johnson: Revenue Shares (%) by Region, 2017
Figure 5.29 Johnson & Johnson: Diagnostics Revenue ($million), 2015-2017
Figure 5.30 Johnson & Johnson: Vaccines Revenue Shares (%), 2017
Figure 5.31 AstraZeneca: Historical Revenues ($million), 2013-2017
Figure 5.32 AstraZeneca: Revenue Shares (%) by Reporting Segment, 2017
Figure 5.33 AstraZeneca: Revenue Shares (%) by Region, 2017
Figure 5.34 AstraZeneca: Diagnostics Revenue ($million), 2015-2017
Figure 5.35 AstraZeneca: Vaccines Revenue Shares (%), 2017
Figure 5.36 AstraZeneca: Vaccines Revenue by Region ($million), 2017
Figure 5.37 Emergent Biosolutions: Historical Revenues ($million), 2013-2017
Figure 5.38 Emergent Biosolutions: Revenue Shares (%) by Reporting Segment, 2017
Figure 5.39 Emergent Biosolutions: Revenue Shares (%) by Region, 2017
Figure 5.40 CSL Ltd.: Historical Revenues ($million), 2013-2017
Figure 5.41 CSL Ltd.: Revenue Shares (%) by Reporting Segment, 2018
Figure 5.42 CSL Ltd.: Revenue Shares (%) by Region, 2017
Figure 5.43 Astellas Pharma: Historical Revenues ($million), 2014-2018
Figure 5.44 Astellas Pharma: Revenue Shares (%) by Product, 2018
Figure 5.45 Astellas Pharma: Revenue Shares (%) by Region, 2018
Figure 5.46 Novavax, Inc.: Historical Revenues ($million), 2013-2017
Figure 5.47 Inovio Pharmaceuticals: Historical Revenues ($million), 2013-2017
Figure 5.48 Mitsubishi Tanabe Pharma Corporation: Historical Revenues ($million), 2013-2017
Figure 5.49 Mitsubishi Tanabe Pharma Corporation: Revenue Shares (%) by Product Type, 2017
Figure 5.50 Mitsubishi Tanabe Pharma Corporation: Revenue Shares (%) by Ethical Products, 2017
Figure 5.51 Mitsubishi Tanabe Pharma Corporation: Revenue Shares (%) by Region, 2017
Figure 5.52 Mitsubishi Tanabe Pharma Corporation: Diagnostics Revenue ($million), 2015-2017
Figure 5.53 Mitsubishi Tanabe Pharma Corporation: Vaccines Revenue Shares (%), 2017
Figure 5.54 Sun Pharmaceutical Industries Ltd.: Historical Revenues ($million), 2014-2018
Figure 5.55 Sun Pharmaceutical Industries Ltd.: Revenue Shares (%) by Region, 2018
Figure 5.56 Gilead Sciences: Historical Revenues ($million), 2013-2017
Figure 5.57 Gilead Sciences: Revenue Shares (%) by Segment, 2017
Figure 5.58 Gilead Sciences: Revenue Shares (%) by Product Type, 2017
Figure 5.59 Gilead Sciences: Revenue Shares (%) by Products, 2017
Figure 5.60 Gilead Sciences: Revenue Shares (%) by Region, 2017
Figure 5.61 F. Hoffmann-La Roche Ltd.: Historical Revenues ($million), 2013-2017
Figure 5.62 Mitsubishi Tanabe Pharma Corporation: Revenue Shares (%) by Product Type, 2018
Figure 5.63 F. Hoffmann-La Roche Ltd.: Revenue Shares (%) by Region, 2018
Figure 5.64 Takeda Pharmaceutical Company Limited: Historical Revenues ($million), 2014-2018
Figure 5.65 Takeda Pharmaceutical Company Limited: Revenue Shares (%) by Product Type, 2018
Figure 5.66 Takeda Pharmaceutical Company Limited: Revenue Shares (%) by Region, 2018
Figure 5.67 Teva Pharmaceutical: Historical Revenues ($million), 2013-2017
Figure 5.68 Teva Pharmaceutical: Revenue Shares (%) by Product Type, 2017
Figure 5.69 Teva Pharmaceutical: Revenue Shares (%) by Region, 2017
Figure 5.70 Bavarian Nordic: Historical Revenues ($million), 2013-2017
Figure 5.71 Bavarian Nordic: Revenue Shares (%) by Region, 2017
Figure 6.1 SWOT Analysis of the Global Vaccines Market, 2018
AELIX Therapeutics
Afferent Pharmaceuticals
Astellas Pharma Inc.
AstraZeneca
Bavarian Nordic A/S
Bayer
BIKEN Co. Ltd.
BioJect Medical Technologies Inc.
Biological E. Limited
BioNTech
CSL Ltd.
Daiichi Sankyo Co., Ltd.
Dyadic International, Inc.
Emergent Biosolutions, Inc.
Evaxion Biotech
F. Hoffmann-La Roche Ltd.
Ganymed Pharmaceuticals AG
Genentech, Inc.
GeneOne Life Science Inc.
Gilead Sciences, Inc.
GlaxoSmithKline PLC
GlaxoWellcome
GlobeImmune
GlycoVaxyn AG
Hitachi Ltd.
HitGen Ltd.
Hookipa Pharma
Immunomic Therapeutics, Inc.
Inovio Pharmaceuticals Inc.
IOmet
Janssen Pharmaceutical Companies
Janssen Vaccines & Prevention B.V.
Johnson & Johnson
MedImmune, LLC
Merck & Co., Inc.
Mitsubishi Tanabe Pharma Corporation
Moderna
Nanotherapeutics
Novavax, Inc.
PaxVax
Pfizer Inc.
Plumbline Life Sciences, Inc.
Poonawalla Investment & Industries Pvt. Ltd.
Potenza Therapeutics, Inc.
Protein Sciences
Regeneron Pharmaceuticals, Inc.
Roche
Sanofi
SELLAS Life Sciences Group, Inc.
Seqirus
Serum Institute of India Pvt. Ltd.
Shionogi
SmithKline Beecham
Sun Pharmaceutical Industries Ltd.
Takeda Pharmaceutical Company Ltd.
Teva Pharmaceutical
Valneva SE
Zydus Cadila
List of Organizations Mentioned in the Report
Biomedical Advanced Research and Development Authority (BARDA)
Centers for Disease Control and Protection (CDC)
Defense Advanced Research Projects Agency
Drexel University
Global Alliance for Vaccines and Immunization (GAVI)
International Centre for Genetic Engineering and Biotechnology (ICGEB)
Mayo Clinic
National Cancer Institute
National Institute of Allergy and Infectious Diseases
National Institutes of Health
National Microbiology Laboratory of the Public Health Agency of Canada
Oswaldo Cruz Foundation
Pan American Health Organization (PAHO)
The Jenner Institute
The Ministry of Health, Labour and Welfare and the Health Service Bureau
The National Institute of Virology (NIV), Pune
The Parker Institute for Cancer Immunotherapy
The US Department of Health and Human Services (HHS)
The Wistar Institute
U.S. Army Medical Research Institute of Infectious Diseases
UNICEF
University of Oxford
University of Pennsylvania
University of Tokyo
Walter Reed Army Institute of Research
Download sample pages
Complete the form below to download your free sample pages for Top 20 Vaccines Manufacturers 2019
Related reports
-
Drug Delivery Technologies Market Forecast 2019-2029
The Drug Delivery Technologies market is estimated to grow at a CAGR of 8.3% in the first half of the...
Full DetailsPublished: 27 February 2019 -
Global Vaccine Contract Manufacturing Market Report 2018-2028
The global vaccine contract manufacturing market was worth $883.0m in 2017 and is expected to grow at a CAGR of...
Full DetailsPublished: 06 March 2018 -
Top 50 Bioreactor Manufacturers 2019
Asia-Pacific bioreactors market is anticipated to be the fast-growing market in the forecast period with a CAGR of 8.0% from...
Full DetailsPublished: 25 March 2019 -
Medical Device Leader Series: Top Pre-Filled Injection Device Manufacturers 2018-2028
The Pre-Filled Device Manufacturing market is estimated to reach $7.5bn in 2022, growing at a CAGR of 10.5% from 2017...Full DetailsPublished: 13 November 2018 -
Global Influenza Vaccines Market Outlook 2018-2028
The latest report from business intelligence provider visiongain offers comprehensive analysis of the global influenza vaccines market. Visiongain assesses that...
Full DetailsPublished: 19 June 2018 -
Pharma Leader Series: Top 50 Pharmaceutical Contract Manufacturing Organisations (CMOs) Market 2018
Contract manufacturing represents the largest sector of the pharma outsourcing industry. Pharmaceutical companies have sought to take advantage of the...Full DetailsPublished: 28 September 2018 -
Global Bioreactors Market 2019-2029
The global bioreactors market is expected to grow at a CAGR of 7.5% in the second half of the forecast...
Full DetailsPublished: 18 December 2018 -
Lyophilization in Pharmaceutical Market Forecast 2019-2029
The global lyophilization in pharmaceutical market is estimated to have reached $5.6bn in 2018. The pharmaceutical and biotechnology segment held...Full DetailsPublished: 28 March 2019 -
Vaccine Sales Market Forecast 2018-2028
The Global Vaccines Sales market was valued at $36.9 billion in 2017. This value will grow to $61.1bn in 2022...
Full DetailsPublished: 09 March 2018 -
Biologics Market Trends and Forecasts 2018-2028
The global biologics market is estimated to reach $250bn in 2023. The market is expected to grow at a CAGR...
Full DetailsPublished: 14 November 2018
Download sample pages
Complete the form below to download your free sample pages for Top 20 Vaccines Manufacturers 2019
Do you have any custom requirements we can help you with?
Any specific country, geo region, market segment or specific company information?
Email us today, we can discuss your needs and see how we can help: jamie.roberts@visiongain.com
Would you like a free report overview of the report of your choice?
If so, please drop an email to Jamie Roberts stating your chosen report title to jamie.roberts@visiongain.com
Visiongain’s reports are based on comprehensive primary and secondary research. Those studies provide global market forecasts (sales by drug and class, with sub-markets and leading nations covered) and analyses of market drivers and restraints (including SWOT analysis) and current pipeline developments. To find out more about our reports methodology, please email jamie.roberts@visiongain.com
“Thank you for this Gene Therapy R&D Market report and for how easy the process was. Your colleague was very helpful and the report is just right for my purpose. This is the 2nd good report from Visiongain and a good price.”
Dr Luz Chapa Azuella, Mexico
American Association of Colleges of Pharmacy
American College of Clinical Pharmacy
American Pharmacists Association
American Society for Pharmacy Law
American Society of Consultant Pharmacists
American Society of Health-System Pharmacists
Association of Special Pharmaceutical Manufacturers
Australian College of Pharmacy
Biotechnology Industry Organization
Canadian Pharmacists Association
Canadian Society of Hospital Pharmacists
Chinese Pharmaceutical Association
College of Psychiatric and Neurologic Pharmacists
Danish Association of Pharmaconomists
European Association of Employed Community Pharmacists in Europe
European Medicines Agency
Federal Drugs Agency
General Medical Council
Head of Medicines Agency
International Federation of Pharmaceutical Manufacturers & Associations
International Pharmaceutical Federation
International Pharmaceutical Students’ Federation
Medicines and Healthcare Products Regulatory Agency
National Pharmacy Association
Norwegian Pharmacy Association
Ontario Pharmacists Association
Pakistan Pharmacists Association
Pharmaceutical Association of Mauritius
Pharmaceutical Group of the European Union
Pharmaceutical Society of Australia
Pharmaceutical Society of Ireland
Pharmaceutical Society Of New Zealand
Pharmaceutical Society of Northern Ireland
Professional Compounding Centers of America
Royal Pharmaceutical Society
The American Association of Pharmaceutical Scientists
The BioIndustry Association
The Controlled Release Society
The European Federation of Pharmaceutical Industries and Associations
The European Personalised Medicine Association
The Institute of Clinical Research
The International Society for Pharmaceutical Engineering
The Pharmaceutical Association of Israel
The Pharmaceutical Research and Manufacturers of America
The Pharmacy Guild of Australia
The Society of Hospital Pharmacists of Australia
Latest Pharma news
Visiongain Publishes Drug Delivery Technologies Market Report 2024-2034
The global Drug Delivery Technologies market is estimated at US$1,729.6 billion in 2024 and is projected to grow at a CAGR of 5.5% during the forecast period 2024-2034.
23 April 2024
Visiongain Publishes Cell Therapy Technologies Market Report 2024-2034
The cell therapy technologies market is estimated at US$7,041.3 million in 2024 and is projected to grow at a CAGR of 10.7% during the forecast period 2024-2034.
18 April 2024
Visiongain Publishes Automation in Biopharma Industry Market Report 2024-2034
The global Automation in Biopharma Industry market is estimated at US$1,954.3 million in 2024 and is projected to grow at a CAGR of 7% during the forecast period 2024-2034.
17 April 2024
Visiongain Publishes Anti-obesity Drugs Market Report 2024-2034
The global Anti-obesity Drugs market is estimated at US$11,540.2 million in 2024 and is expected to register a CAGR of 21.2% from 2024 to 2034.
12 April 2024


