Industries > Construction > Corrosion Resistant Alloy Market 2019-2029
Corrosion Resistant Alloy Market 2019-2029
Global Forecasts by Spending ($M) and Quantity (kt) for Alloy Type (Iron-Based, Nickel-Based, Cobalt-Based and Other Alloy), by Application (Oil and Gas, Transportation, Aerospace & Defence, Energy and Industrial). Plus, Analysis of Leading Companies
• Do you need definitive Corrosion Resisitant Alloys market data?
• Succinct Corrosion Resisitant Alloys market analysis?
• Technological insight?
• Clear competitor analysis?
• Actionable business recommendations?
Read on to discover how this definitive report can transform your own research and save you time.
Report highlights
• 150+ quantitative tables, charts, and graphs
• Analysis of key players in Corrosion Resistant Alloys
• Carpenter Technology Corporation
• Vdm Metals
• Eramet
• Advanced Metallurgical Group
• Special Metal Corporation
• Nippon Steel Sumitomo Metal Corporation
• Nippon Yakin Kogyo Co
• Hitachi Metals
• Haynes International
• Corrosion Resistant Alloys LP
Global Corrosion Resistant Alloys market outlook and analysis from 2019-2029
Corrosion Resistant Alloys Market by Type forecasts and analysis from 2019-2029
• Nickel forecast 2019-2029
• Iron forecast 2019-2029
• Cobalt forecast 2019-2029
• Others Rare forecast 2019-2029
Corrosion Resistant Alloys Market by Application analysis and potential from 2019-2029
• Oil & Gas forecast 2019-2029
• Aerospace and Defence forecast 2019-2029
• Transportation forecast 2019-2029
• Energy forecast 2019-2029
• Industrial forecast 2019-2029
• Others forecast 2019-2029
Regional and Leading National Corrosion Resistant Alloys Market forecasts from 2019-2029
• North America Corrosion Resistant Alloys Forecast 2019-2029
• US Corrosion Resistant Alloys Forecast 2019-2029
• Canada Corrosion Resistant Alloys Forecast 2019-2029
• Europe Corrosion Resistant Alloys Forecast 2019-2029
• Germany Corrosion Resistant Alloys Forecast 2019-2029
• UK Corrosion Resistant Alloys Forecast 2019-2029
• Italy Corrosion Resistant Alloys Forecast 2019-2029
• France Corrosion Resistant Alloys Forecast 2019-2029
• Spain Corrosion Resistant Alloys Forecast 2019-2029
• Asia Pacific Corrosion Resistant Alloys Forecast 2019-2029
• China Corrosion Resistant Alloys Forecast 2019-2029
• India Corrosion Resistant Alloys Forecast 2019-2029
• Rest of Asia Pacific Corrosion Resistant Alloys Forecast 2019-2029
• Latin America Corrosion Resistant Alloys Forecast 2019-2029
• Brazil Corrosion Resistant Alloys Forecast 2019-2029
• Key questions answered
• What does the future hold for the Corrosion Resistant Alloys industry?
• Where should you target your business strategy?
• Which applications should you focus upon?
• Which disruptive technologies should you invest in?
• Which companies should you form strategic alliances with?
• Which company is likely to success and why?
• What business models should you adopt?
• What industry trends should you be aware of?
• Target audience
• Leading metals companies
• Suppliers
• Contractors
• Technologists
• R&D staff
• Consultants
• Analysts
• CEO’s
• CIO’s
• COO’s
• Business development managers
• Investors
• Governments
• Agencies
• Industry organisations
• Banks
Visiongain is a trading partner with the US Federal Government
CCR Ref number: KD4R6
Do you have any custom requirements we can help you with? Any need for specific country, geo region, market segment or specific company information? Contact us today, we can discuss your needs and see how we can help: sara.peerun@visiongain.com
1.1 Corrosion Resistance Alloy Market Overview
1.2 Corrosion Resistance Alloy Market Segmentation
1.3 Why You Should Read This Report
1.4 How This Report Delivers
1.5 Key Questions Answered by This Analytical Report Include
1.6 Who is This Report For?
1.7 Methodology
1.8 Frequently Asked Questions (FAQ)
1.9 Associated Visiongain Reports
1.10 About Visiongain
2. Introduction to the Corrosion Resistance Alloy Market
2.1 What are Corrosion Resistant Alloys?
2.2 Corrosion Resistance Alloy Market Structure
2.3 Introduction to Corrosion Resistance Alloy Market
2.3.1 Nickel Based Alloy
2.3.2 Iron Based Alloy
2.3.3 Cobalt Based Alloy
3. Global Corrosion Resistance Alloy Market 2019-2029
3.1 How does Corrosion Resistance Alloy Market Compared to GDP Growth?
3.2. The Global Economic Outlook 2019
3.3. What are the Advantages of Corrosion Resistance Alloy Market?
3.4. What are the Disadvantages of Corrosion Resistance Alloy Market?
4. Global Corrosion Resistance Alloy Submarket Forecast 2019-2029
4.1. Global Outlook for Corrosion Resistance Alloy
4.2. Global Corrosion Resistance Alloy Type Submarket Forecast 2019-2029
4.2.1 Global Nickel Based Alloy Submarket Forecast 2019-2029
4.2.2. Global Iron Based Alloy Submarket Forecast 2019-2029
4.2.3. Global Cobalt Based Alloy Submarket Forecast 2019-2029
4.2.4. Global Other Alloy Submarket Forecast 2019-2029
4.3. Global Corrosion Resistance Alloy Submarket Forecast by Application 2019-2029
4.3.1. Oil and Gas Submarket Forecast 2019-2029
4.3.2. Aerospace & Defence Submarket Forecast 2019-2029
4.3.3. Transportation Submarket Forecast 2019-2029
4.3.4. Energy Submarket Forecast 2019-2029
4.3.5. Industrial Submarket Forecast 2019-2029
4.3.6. Others Submarket Forecast 2019-2029
5. Global Corrosion Resistance Alloy Market by Regional Market Share Forecast 2019-2029
5.1. North America Corrosion Resistance Alloy Market Forecast 2019-2029
5.2. Europe Corrosion Resistance Alloy Market Forecast 2019-2029
5.3. Asia Pacific Corrosion Resistance Alloy Market Forecast 2019-2029
5.4. Rest of the World Corrosion Resistance Alloy Market Forecast 2019-2029
6. Global Corrosion Resistance Alloy Market Analysis by Major Countries
6.1. United States Corrosion Resistance Alloy Market Forecast 2019-2029
6.2. Canada Corrosion Resistance Alloy Market Forecast 2019-2029
6.3. Germany Corrosion Resistance Alloy Market Forecast 2019-2029
6.4. United Kingdom Corrosion Resistance Alloy Market Forecast 2019-2029
6.5. Italy Corrosion Resistance Alloy Market Forecast 2019-2029
6.6. France Corrosion Resistance Alloy Market Forecast 2019-2029
6.7. Spain Corrosion Resistance Alloy Market Forecast 2019-2029
6.8. India Corrosion Resistance Alloy Market Forecast 2019-2029
6.9. China Corrosion Resistance Alloy Market Forecast 2019-2029
6.10. Brazil Corrosion Resistance Alloy Market Forecast 2019-2029
7. SWOT Analysis of the Corrosion Resistance Alloy Market 2019-2029
8. Leading Companies in the Corrosion Resistance Alloy Market 2019
8.1. Carpenter Technology Corporation
8.2. VDM Metals
8.3. Eramet
8.4. Advanced Metallurgical Group N V
8.5. Special Metal Corporation
8.6 Nippon Steel Sumitomo Metal Corporation
8.7 Nippon Yakin Kogyo Co., Ltd.
8.8 Hitachi Metals
8.9 Haynes International, Inc.
8.10 Corrosion Resistant Alloys, L P
8.11 Other Companies of Note Working With Corrosion Resistant Alloys
9. Conclusions and Recommendations
10. Glossary
List of Tables
Table 2.1 Leading Nickel Based Corrosion Resistance Alloys and Their Composition (in %)
Table 2.2 Leading Iron Based Corrosion Resistance Alloys and Their Composition (in %)
Table 2.3 Leading Cobalt Based Corrosion Resistance Alloys and Their Composition (in %)
Table 3.1 Growth in Global Corrosion Resistance Alloys Demand vs. GDP 2019-2029 (AGR %, Difference %)
Table 4.1 Global Corrosion Resistance Alloy Consumption Forecast 2019-2029 (kt, AGR %, Cumulative)
Table 4.2 Global Corrosion Resistance Alloy Value Forecast 2019-2029 ($m, AGR %, Cumulative)
Table 4.3 Global Corrosion Resistance Alloy Submarkets Consumption Forecast 2019-2029 (kt, AGR %, Cumulative)
Table 4.4 Global Corrosion Resistance Alloy Type Submarkets Consumption Forecast (CAGR %, 2019-2029, 2019-2024 and 2024-2029)
Table 4.5 Global Corrosion Resistance Alloy Submarkets Value Forecast 2019-2029 ($m, AGR %, Cumulative)
Table 4.6 Global Corrosion Resistance Alloy Type Submarkets Value Forecast (CAGR %, 2019-2029, 2019-2024 and 2024-2029)
Table 4.7 Global Nickel Based CRA Submarket Consumption Forecast 2019-2029 (kt, AGR %, Cumulative)
Table 4.8 Global Corrosion Resistance Alloy Submarkets Value Forecast 2019-2029 ($m, AGR %, Cumulative)
Table 4.9 Global Iron Based CRA Consumption Forecast 2019-2029 (kt, AGR %, Cumulative)
Table 4.10 Global Iron Based CRA Submarket Value Forecast 2019-2029 ($m, AGR %, Cumulative)
Table 4.11 Global Cobalt Based CRA Consumption Forecast 2019-2029 (kt, AGR %, Cumulative)
Table 4.12 Global Cobalt Based CRA Submarket Value Forecast 2019-2029 ($m, AGR %, Cumulative)
Table 4.13 Global Other CRA Consumption Forecast 2019-2029 (kt, AGR %, Cumulative)
Table 4.14 Global Other CRA Submarket Value Forecast 2019-2029 ($m, AGR %, Cumulative)
Table 4.15 Global Corrosion Resistance Alloy Application Submarkets Consumption Forecast 2019-2029 (kt, AGR %, Cumulative)
Table 4.16 Global Corrosion Resistance Alloy Application Submarkets Consumption Forecast (CAGR %, 2019-2029, 2019-2024 and 2024-2029)
Table 4.17 Global Corrosion Resistance Alloy Application Submarkets Value Forecast 2019-2029 ($m, AGR %, Cumulative)
Table 4.18 Global Corrosion Resistance Alloy Application Submarkets Value Forecast (CAGR %, 2019-2029, 2019-2024 and 2024-2029)
Table 4.19 Oil & Gas Submarket Consumption Forecast 2019-2029 (kt, AGR %, Cumulative)
Table 4.20 Oil & Gas Submarket Value Forecast 2019-2029 ($m, AGR %, Cumulative)
Table 4.21 Aerospace & Defence Submarket Consumption Forecast 2019-2029 (kt, AGR %, Cumulative)
Table 4.22 Aerospace & Defence Submarket Value Forecast 2019-2029 ($m, AGR %, Cumulative)
Table 4.23 Transportation Submarket Consumption Forecast 2019-2029 (kt, AGR %, Cumulative)
Table 4.24 Transportation Submarket Value Forecast 2019-2029 ($m, AGR %, Cumulative)
Table 4.25 Energy Submarket Consumption Forecast 2019-2029 (kt, AGR %, Cumulative)
Table 4.26 Energy Submarket Value Forecast 2019-2029 ($m, AGR %, Cumulative)
Table 4.27 Industrial Submarket Consumption Forecast 2019-2029 (kt, AGR %, Cumulative)
Table 4.28 Industrial Submarket Value Forecast 2019-2029 ($m, AGR %, Cumulative)
Table 4.29 Others Submarket Consumption Forecast 2019-2029 (kt, AGR %, Cumulative)
Table 4.30 Others Submarket Value Forecast 2019-2029 ($m, AGR %, Cumulative)
Table 5.1 Global Corrosion Resistance Alloy Consumption Forecast by Region 2019-2029 (kt, AGR %, Cumulative)
Table 5.2 Global Corrosion Resistance Alloy Value Forecast by Region 2019-2029 (kt, AGR %, Cumulative)
Table 5.3 North America Corrosion Resistance Alloy Market Consumption Forecast 2019-2029 (kt, AGR %, Cumulative)
Table 5.4 North America Corrosion Resistance Alloy Market Value Forecast 2019-2029 ($m, AGR %, Cumulative)
Table 5.5 Europe Corrosion Resistance Alloy Market Consumption Forecast 2019-2029 (kt, AGR %, Cumulative)
Table 5.6 Europe Corrosion Resistance Alloy Market Value Forecast 2019-2029 ($m, AGR %, Cumulative)
Table 5.7 Asia Pacific Corrosion Resistance Alloy Market Consumption Forecast 2019-2029 (kt, AGR %, Cumulative)
Table 5.8 Asia Pacific Corrosion Resistance Alloy Market Value Forecast 2019-2029 ($m, AGR %, Cumulative)
Table 5.9 Rest of the World Corrosion Resistance Alloy Market Consumption Forecast 2019-2029 (kt, AGR %, Cumulative)
Table 5.10 Rest of the World Corrosion Resistance Alloy Market Value Forecast 2019-2029 ($m, AGR %, Cumulative)
Table 6.1 Leading National Corrosion Resistance Alloy Consumption Forecast 2019-2029 (kt, AGR %, Cumulative)
Table 6.2 Leading National Corrosion Resistance Alloy Value Forecast 2019-2029 ($m, AGR %, Cumulative)
Table 6.3 United States Corrosion Resistance Alloy Market Consumption Forecast 2019-2029 (kt, AGR %, Cumulative)
Table 6.4 United States Corrosion Resistance Alloy Market Value Forecast 2019-2029 ($m, AGR %, Cumulative)
Table 6.5 Canada Corrosion Resistance Alloy Market Consumption Forecast 2019-2029 (kt, AGR %, Cumulative)
Table 6.6 Canada Corrosion Resistance Alloy Market Value Forecast 2019-2029 ($m, AGR %, Cumulative)
Table 6.7 Germany Corrosion Resistance Alloy Market Consumption Forecast 2019-2029 (kt, AGR %, Cumulative)
Table 6.8 Germany Corrosion Resistance Alloy Market Value Forecast 2019-2029 ($m, AGR %, Cumulative)
Table 6.9 United Kingdom Corrosion Resistance Alloy Market Consumption Forecast 2019-2029 (kt, AGR %, Cumulative)
Table 6.10 United Kingdom Corrosion Resistance Alloy Market Value Forecast 2019-2029 ($m, AGR %, Cumulative)
Table 6.11 Italy Corrosion Resistance Alloy Market Consumption Forecast 2019-2029 (kt, AGR %, Cumulative)
Table 6.12 Italy Corrosion Resistance Alloy Market Value Forecast 2019-2029 ($m, AGR %, Cumulative)
Table 6.13 France Corrosion Resistance Alloy Market Consumption Forecast 2019-2029 (kt, AGR %, Cumulative)
Table 6.14 France Corrosion Resistance Alloy Market Value Forecast 2019-2029 ($m, AGR %, Cumulative)
Table 6.15 Spain Corrosion Resistance Alloy Market Consumption Forecast 2019-2029 (kt, AGR %, Cumulative)
Table 6.16 Spain Corrosion Resistance Alloy Market Value Forecast 2019-2029 ($m, AGR %, Cumulative)
Table 6.17 India Corrosion Resistance Alloy Market Consumption Forecast 2019-2029 (kt, AGR %, Cumulative)
Table 6.18 India Corrosion Resistance Alloy Market Value Forecast 2019-2029 ($m, AGR %, Cumulative)
Table 6.19 China Corrosion Resistance Alloy Market Consumption Forecast 2019-2029 (kt, AGR %, Cumulative)
Table 6.20 China Corrosion Resistance Alloy Market Value Forecast 2019-2029 ($m, AGR %, Cumulative)
Table 6.21 Brazil Corrosion Resistance Alloy Market Consumption Forecast 2019-2029 (kt, AGR %, Cumulative)
Table 6.22 Brazil Corrosion Resistance Alloy Market Value Forecast 2019-2029 ($m, AGR %, Cumulative)
Table 7.1 SWOT Analysis of the Corrosion Resistance Alloy Market 2019-2029
Table 8.1 Overview of Carpenter Technology Corporation in the Corrosion Resistance Alloy Market: Headquarters, Company Revenue ($m), CEO, Number of Employees, Ticker, IR Contact, Website, CRA Revenue ($m), Current Market Share (%), Rank)
Table 8.2 Carpenter Technology Corporation CRA Products
Table 8.3 Carpenter Technology Corporation Business Segments
Table 8.4 Carpenter Technology Corporation Revenue by Business Segment 2018 (% Share)
Table 8.5 Carpenter Technology Corporation Revenue by Region 2018 (% Share)
Table 8.6 Overview of VDM Metals in the Corrosion Resistance Alloy Market: Headquarters, Company Revenue ($m), CEO, Number of Employees, Website, CRA Revenue ($m), Current Market Share (%), Rank)
Table 8.7 VDM Metals CRA Products
Table 8.8 Overview of Eramet in the Corrosion Resistance Alloy Market: Headquarters, Company Revenue ($m), CEO, Number of Employees, Ticker, IR Contact, Website, CRA Revenue ($m), Current Market Share (%), Rank)
Table 8.9 Eramet International Corrosion Resistance Alloy Products
Table 8.10 Eramet Business Segments
Table 8.11 Eramet Revenue by Business Segment 2018 (% Share)
Table 8.12 Overview of Advanced Metallurgical Group (AMG) in the Corrosion Resistance Alloy Market: Headquarters, Company Revenue ($m), CEO, Number of Employees, Ticker, IR Contact, Website, CRA Revenue ($m), Current Market Share (%), Rank)
Table 8.13 Advanced Metallurgical Group (AMG) Business Segments
Table 8.14 Advanced Metallurgical Group (AMG) Revenue by Business Segment 2018 (% Share)
Table 8.15 Overview of Special Metal Corporation in the Corrosion Resistance Alloy Market: Headquarters, Company Revenue ($m), CEO, Number of Employees, Ticker, IR Contact, Website, CRA Revenue ($m), Current Market Share (%), Rank)
Table 8.16 Special Metal Corporation CRA Products
Table 8.17 Overview of Nippon Steel Sumitomo Metal Corporation in the Corrosion Resistance Alloy Market: Headquarters, Company Revenue ($m), CEO, Number of Employees, Ticker, Website, CRA Revenue ($m), Current Market Share (%), Rank)
Table 8.18 Nippon Steel Sumitomo Metal Corporation Business Segments
Table 8.19 Nippon Steel Sumitomo Metal Corporation Revenue by Business Segment 2018 (% Share)
Table 8.20 Overview of Nippon Yakin Kogyo Co. Ltd. in the Corrosion Resistance Alloy Market: Headquarters, Company Revenue ($m), CEO, Number of Employees, Website, CRA Revenue ($m), Current Market Share (%), Rank)
Table 8.21 Hitachi Metals Corrosion Resistance Alloy Products
Table 8.22 Overview of Hitachi Metals in the Corrosion Resistance Alloy Market: Headquarters, Company Revenue ($m), CEO, Number of Employees, Ticker, IR Contact, Website, CRA Revenue ($m), Current Market Share (%), Rank)
Table 8.23 Hitachi Metals Business Segments
Table 8.24 Hitachi Metals Revenue by Business Segment 2018 (% Share)
Table 8.25 Hitachi Metals Revenue by Region 2018 (% Share)
Table 8.26 Hitachi Metals CRA Products
Table 8.27 Overview of Haynes International Inc. in the Corrosion Resistance Alloy Market: Headquarters, Company Revenue ($m), CEO, Number of Employees, Ticker, IR Contact, Website, CRA Revenue ($m), Current Market Share (%), Rank)
Table 8.28 Haynes International Inc. Business Segments
Table 8.29 Haynes International Corrosion Resistance Alloy Products
Table 8.30 Haynes International Inc. Revenue by Business Segment 2018 (% Share)
Table 8.31 Haynes International Inc. Revenue by Region 2018 (% Share)
Table 8.32 Overview of Corrosion Resistance Alloys LP in the Corrosion Resistance Alloy Market: Headquarters, Company Revenue ($m), CEO, Number of Employees, Ticker, IR Contact, Website, CRA Revenue ($m), Current Market Share (%), Rank)
Table 8.33 Corrosion Resistance Alloys LP CRA Products
Table 8.34 Other Companies of Note Working With Corrosion Resistant Alloys
Table 9.1 Global Corrosion Resistance Alloy Market Forecast Summary 2019, 2022, 2029 (kt, $m, CAGR%)
Table 9.2 Global Corrosion Resistance Alloy Type Submarket Forecast Summary 2019, 2022, 2029 (kt, CAGR%)
Table 9.3 Global Corrosion Resistance Alloy Type Submarket Forecast Summary 2019, 2022, 2029 ($m, CAGR%)
Table 9.4 Global Leading National Corrosion Resistance Alloy Market Forecast Summary 2019, 2024, 2029 ($m, CAGR%)
List of Figures
Figure 1.1 Global Corrosion Resistance Alloy Market Segmentation
Figure 3.1 Global Growth in Corrosion Resistance Alloy Market Demand vs GDP (CAGR %, Difference %)
Figure 4.1 Global Corrosion Resistance Alloy Consumption Forecast 2019-2029 (kt, AGR %)
Figure 4.2 Global Corrosion Resistance Alloy Value Forecast 2019-2029 ($m, AGR %)
Figure 4.3 Global Corrosion Resistance Alloy Consumption Forecast 2019-2029 (kt)
Figure 4.4 Global Corrosion Resistance Alloy Type Submarkets Consumption Forecast (CAGR %, 2019-2029, 2019-2024 and 2024-2029)
Figure 4.5 Global Corrosion Resistance Alloy Type Submarkets Consumption Forecast 2019-2029 (AGR %)
Figure 4.6 Global Corrosion Resistance Alloy Value Forecast 2019-2029 ($m)
Figure 4.7 Global Corrosion Resistance Alloy Type Submarkets Value Forecast (CAGR %, 2019-2029, 2019-2024 and 2024-2029)
Figure 4.8 Global Corrosion Resistance Alloy Type Submarkets Value Forecast 2019-2029 (AGR %)
Figure 4.9 Nickel Based CRA Submarket Consumption Forecast 2019-2029 (kt, AGR %)
Figure 4.10 Nickel Based CRA Alloy Submarket Value Forecast 2019-2029 ($m, AGR %)
Figure 4.11 Iron Based CRA Market Share Forecasts 2019, 2024, 2029 (% of Total Market Value)
Figure 4.12 Iron Based CRA Submarket Consumption Forecast 2019-2029 (kt, AGR %)
Figure 4.13 Iron Based CRA Submarket Value Forecast 2019-2029 ($m, AGR %)
Figure 4.14 Iron Based CRA Market Share Forecasts 2019, 2024, 2029 (% of Total Market Value)
Figure 4.15 Cobalt Based CRA Submarket Consumption Forecast 2019-2029 (kt, AGR %)
Figure 4.16 Cobalt Based CRA Submarket Value Forecast 2019-2029 ($m, AGR %)
Figure 4.17 Cobalt Based CRA Market Share Forecasts 2019, 2024, 2029 (% of Total Market Value)
Figure 4.18 Other CRA Submarket Consumption Forecast 2019-2029 (kt, AGR %)
Figure 4.19 Other CRA Submarket Value Forecast 2019-2029 ($m, AGR %)
Figure 4.20 Other CRA Market Share Forecasts 2019, 2024, 2029 (% of Total Market Value)
Figure 4.21 Global Corrosion Resistance Alloy Application Submarket Consumption Forecast 2019-2029 (kt)
Figure 4.22 Global Corrosion Resistance Alloy Application Submarkets Consumption Forecast (CAGR %, 2019-2029, 2019-2024 and 2024-2029)
Figure 4.23 Global Corrosion Resistance Alloy Application Submarkets Consumption Forecast 2019-2029 (AGR %)
Figure 4.24 Global Corrosion Resistance Alloy Application Submarket Value Forecast 2019-2029 ($m)
Figure 4.25 Global Corrosion Resistance Alloy Application Submarkets Value Forecast (CAGR %, 2019-2029, 2019-2024 and 2024-2029)
Figure 4.26 Global Corrosion Resistance Alloy Application Submarkets Value Forecast 2019-2029 (AGR %)
Figure 4.27 Oil & Gas Submarket Consumption Forecast 2019-2029 (kt, AGR %)
Figure 4.28 Oil & Gas Submarket Value Forecast 2019-2029 ($m, AGR %)
Figure 4.29 Oil & Gas Submarket Share Forecasts 2019, 2024, 2029 (% of Total Market Value)
Figure 4.30 Aerospace & Defence Submarket Consumption Forecast 2019-2029 (kt, AGR %)
Figure 4.31 Aerospace & Defence Submarket Value Forecast 2019-2029 ($m, AGR %)
Figure 4.32 Aerospace & Defence Submarket Share Forecasts 2019, 2024, 2029 (% of Total Market Value)
Figure 4.33 Transportation Submarket Consumption Forecast 2019-2029 (kt, AGR %)
Figure 4.34 Transportation Submarket Value Forecast 2019-2029 ($m, AGR %)
Figure 4.35 Transportation Submarket Share Forecasts 2019, 2024, 2029 (% of Total Market Value)
Figure 4.36 Energy Submarket Consumption Forecast 2019-2029 (kt, AGR %)
Figure 4.37 Energy Submarket Value Forecast 2019-2029 ($m, AGR %)
Figure 4.38 Energy Submarket Share Forecasts 2019, 2024, 2029 (% of Total Market Value)
Figure 4.39 Industrial Submarket Consumption Forecast 2019-2029 (kt, AGR %)
Figure 4.40 Industrial Submarket Value Forecast 2019-2029 ($m, AGR %)
Figure 4.41 Industrial Submarket Share Forecasts 2019, 2024, 2029 (% of Total Market Value)
Figure 4.42 Others Submarket Consumption Forecast 2019-2029 (kt, AGR %)
Figure 4.43 Others Submarket Value Forecast 2019-2029 ($m, AGR %)
Figure 4.44 Others Submarket Share Forecasts 2019, 2024, 2029 (% of Total Market Value)
Figure 5.1 Global Corrosion Resistance Alloy Consumption Forecast by Region 2019-2029 (kt)
Figure 5.2 Global Corrosion Resistance Alloy Value Forecast by Region 2019-2029 (kt)
Figure 5.3 North America Corrosion Resistance Alloy Market Consumption Forecast 2019-2029 (kt, AGR %)
Figure 5.4 North America Corrosion Resistance Alloy Market Value Forecast 2019-2029 ($m, AGR %)
Figure 5.5 North America Corrosion Resistance Alloy Market Share Forecasts 2019, 2024, 2029 (% of Total Market Value)
Figure 5.6 Europe Corrosion Resistance Alloy Market Consumption Forecast 2019-2029 (kt, AGR %)
Figure 5.7 Europe Corrosion Resistance Alloy Market Value Forecast 2019-2029 ($m, AGR %)
Figure 5.8 Europe Corrosion Resistance Alloy Market Share Forecasts 2019, 2024, 2029 (% of Total Market Value)
Figure 5.9 Asia Pacific Corrosion Resistance Alloy Market Consumption Forecast 2019-2029 (kt, AGR %)
Figure 5.10 Asia Pacific Corrosion Resistance Alloy Market Value Forecast 2019-2029 ($m, AGR %)
Figure 5.11 Asia Pacific Corrosion Resistance Alloy Market Share Forecasts 2019, 2024, 2029 (% of Total Market Value)
Figure 5.12 Rest of the World Corrosion Resistance Alloy Market Consumption Forecast 2019-2029 (kt, AGR %)
Figure 5.13 Rest of the World Corrosion Resistance Alloy Market Value Forecast 2019-2029 ($m, AGR %)
Figure 5.14 Rest of the World Corrosion Resistance Alloy Market Share Forecasts 2019, 2024, 2029 (% of Total Market Value)
Figure 6.1 Leading National Corrosion Resistance Alloy Market Consumption Forecast 2019-2029 (kt)
Figure 6.2 Leading National Corrosion Resistance Alloy Market Value Forecast 2019-2029 ($m)
Figure 6.3 Leading National Corrosion Resistance Alloy Market Share Forecast 2019 (%)
Figure 6.4 Leading National Corrosion Resistance Alloy Market Share Forecast 2024 (%)
Figure 6.5 Leading National Corrosion Resistance Alloy Market Share Forecast 2024 (%)
Figure 6.6 United States Corrosion Resistance Alloy Market Consumption Forecast 2019-2029 (kt, AGR %)
Figure 6.7 United States Corrosion Resistance Alloy Market Value Forecast 2019-2029 ($m, AGR %)
Figure 6.8 United States Corrosion Resistance Alloy Market Share Forecasts 2019, 2024, 2029 (% of Total Market Value)
Figure 6.9 Canada Corrosion Resistance Alloy Market Consumption Forecast 2019-2029 (kt, AGR %)
Figure 6.10 Canada Corrosion Resistance Alloy Market Value Forecast 2019-2029 ($m, AGR %)
Figure 6.11 Canada Corrosion Resistance Alloy Market Share Forecasts 2019, 2024, 2029 (% of Total Market Value)
Figure 6.12 Germany Corrosion Resistance Alloy Market Consumption Forecast 2019-2029 (kt, AGR %)
Figure 6.13 Germany Corrosion Resistance Alloy Market Value Forecast 2019-2029 ($m, AGR %)
Figure 6.14 Germany Corrosion Resistance Alloy Market Share Forecasts 2019, 2024, 2029 (% of Total Market Value)
Figure 6.15 United Kingdom Corrosion Resistance Alloy Market Consumption Forecast 2019-2029 (kt, AGR %)
Figure 6.16 United Kingdom Corrosion Resistance Alloy Market Value Forecast 2019-2029 ($m, AGR %)
Figure 6.17 United Kingdom Corrosion Resistance Alloy Market Share Forecasts 2019, 2024, 2029 (% of Total Market Value)
Figure 6.18 Italy Corrosion Resistance Alloy Market Consumption Forecast 2019-2029 (kt, AGR %)
Figure 6.19 Italy Corrosion Resistance Alloy Market Value Forecast 2019-2029 ($m, AGR %)
Figure 6.20 Italy Corrosion Resistance Alloy Market Share Forecasts 2019, 2024, 2029 (% of Total Market Value)
Figure 6.21 France Corrosion Resistance Alloy Market Consumption Forecast 2019-2029 (kt, AGR %)
Figure 6.22 France Corrosion Resistance Alloy Market Value Forecast 2019-2029 ($m, AGR %)
Figure 6.23 France Corrosion Resistance Alloy Market Share Forecasts 2019, 2024, 2029 (% of Total Market Value)
Figure 6.24 Spain Corrosion Resistance Alloy Market Consumption Forecast 2019-2029 (kt, AGR %)
Figure 6.25 Spain Corrosion Resistance Alloy Market Value Forecast 2019-2029 ($m, AGR %)
Figure 6.26 Spain Corrosion Resistance Alloy Market Share Forecasts 2019, 2024, 2029 (% of Total Market Value)
Figure 6.27 India Corrosion Resistance Alloy Market Consumption Forecast 2019-2029 (kt, AGR %)
Figure 6.28 India Corrosion Resistance Alloy Market Value Forecast 2019-2029 ($m, AGR %)
Figure 6.29 India Corrosion Resistance Alloy Market Share Forecasts 2019, 2024, 2029 (% of Total Market Value)
Figure 6.30 China Corrosion Resistance Alloy Market Consumption Forecast 2019-2029 (kt, AGR %)
Figure 6.31 China Corrosion Resistance Alloy Market Value Forecast 2019-2029 ($m, AGR %)
Figure 6.32 China Corrosion Resistance Alloy Market Share Forecasts 2019, 2024, 2029 (% of Total Market Value)
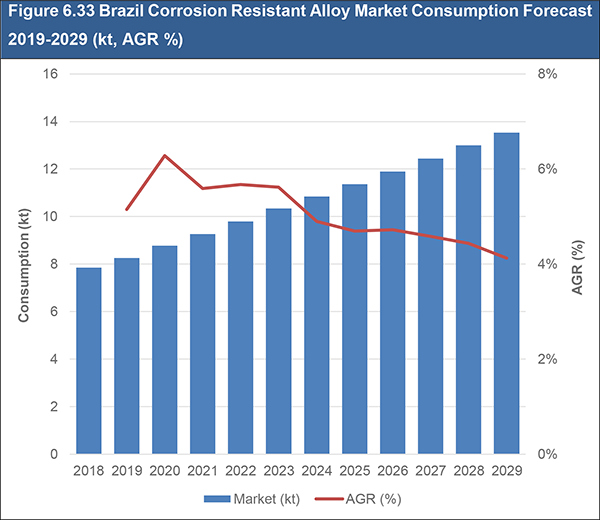
Figure 6.33 Brazil Corrosion Resistance Alloy Market Consumption Forecast 2019-2029 (kt, AGR %)
Figure 6.34 Brazil Corrosion Resistance Alloy Market Value Forecast 2019-2029 ($m, AGR %)
Figure 6.35 Brazil Corrosion Resistance Alloy Market Share Forecasts 2019, 2024, 2029 (% of Total Market Value)
Brinck & Co. GMBH
Carpenter Technology Corporation
Corrosion Resistance Alloys LP
Eramet
Fine Tubes
Haynes International Inc.
Hitachi Metals
Hitachi Metals MMC Superalloy, Ltd
Hugo Arens GMBH & Co.KG
Inco Alloys International
IWIS Antriebssysteme GMBH & Co.KG
Lindsay Goldberg Vogel
Mitsubishi Materials Corporation
MMC Superalloy Corporation
Nippon Steel Sumitomo Metal Corporation
Nippon Yakin Kogyo Co. Ltd.
OTTO Junker GMBH
Precision Castparts Corporation
Rudolf Gutbrod GMBH
Someflu
Special Metal Corporation
Technologica
Tenaris
Tubus Waben GMBH & Co.KG
TWI
VDM Metals
Witte Tube & Pipe Systems GMBH
Organisations Mentioned
Nickel Institute
British Welding research Association (BWRA)
Advanced Metallurgical Group (AMG)
American chemical Council
Association of Corrosion Engineers
European Automobile Manufacturers Association
Organisation for Economic Cooperation and Development
Download sample pages
Complete the form below to download your free sample pages for Corrosion Resistant Alloy Market 2019-2029
Related reports
-

Rare Earth Metals Market Report 2019-2029
The Rare Earth Metals markets is valued at $9bn in 2019....Full DetailsPublished: 12 December 2018 -

Geotextiles Market Report 2018-2028
Geotextiles are part of the geosynthetic group of materials which include geogrids, geomembranes, geopipes, geocomposites, geosynthetic clay liners, and geonets....
Full DetailsPublished: 24 October 2018 -

Recycled Packaging Materials Market Report 2019-2029
The latest report from business intelligence provider, Visiongain offers a comprehensive analysis of the global Recycled Packaging Materials market. Visiongain...Full DetailsPublished: 29 March 2019 -

Glass Packaging Market Report 2019-2029
The latest report from business intelligence provider Visiongain offers a comprehensive analysis of the global Glass Packaging market. Visiongain assesses...
Full DetailsPublished: 03 June 2019 -

Building Thermal Insulation Market Report 2019-2029
With an incredible amount of attention devoted to building thermal insulation market, deriving market prospects and opportunities can be difficult....Full DetailsPublished: 22 May 2019 -

Top 20 Building Thermal Insulation Companies 2019
Visiongain assesses that the thermal insulation market is moderately concentrated with the top 20 companies accounting for just over 70%...Full DetailsPublished: 19 July 2019 -

Automotive Composites Market Report 2019-2029
Visiongain has quantfied the automotive composites market at $18.51bn in 2019....Full DetailsPublished: 09 April 2019 -

3D Concrete Printing Market Report 2019-2029
Modern buildings and structures make fantastic use of defying convention and form and defying gravity at times. Because of the...Full DetailsPublished: 03 April 2019 -

Aerospace Composites Market Report 2018-2028
Aerospace composites represent a key part of the aerospace sector. This is due to the integral role they are currently...
Full DetailsPublished: 08 June 2018 -

Airport Construction Market Report 2018-2028
The latest report from business intelligence provider Visiongain offers comprehensive analysis of the global airport construction market. Visiongain assesses that...
Full DetailsPublished: 03 January 2018
Download sample pages
Complete the form below to download your free sample pages for Corrosion Resistant Alloy Market 2019-2029
Do you have any custom requirements we can help you with?
Any specific country, geo region, market segment or specific company information?
Email us today, we can discuss your needs and see how we can help: jamie.roberts@visiongain.com
Would you like a free report overview of the report of your choice?
If so, please drop an email to Jamie Roberts stating your chosen report title to jamie.roberts@visiongain.com
Visiongain construction reports are compiled using a broad and rich mixture of both primary and secondary information to produce an overall industry outlook. In order to provide our clients with the best product possible product, we do not rely on any one single source of information. Visiongain analysts reach out to market-leading vendors and automotive industry experts but also review a wealth of financial data and product information from a vast range of sources. To find out more about our reports methodology please email jamie.roberts@visiongain.com
Would you like to get the latest Visiongain construction reports catalogue?
What are the dynamic growth sectors? where are the regional business opportunities?
Which technologies will prevail and who are the leading companies succeeding in these sectors and why?
If you want definitive answers to business critical questions, discover Visiongain’s full range of business intelligence reports.
If so, please email Jamie Roberts on jamie.roberts@visiongain.com or call her today on +44 207 336 6100
Latest Construction news
Visiongain Publishes Carbon Fibre Reinforced Plastic (CFRP) Composites Market Report 2024-2034
The global Carbon Fibre Reinforced Plastic (CFRP) Composites market was valued at US$23.88 billion in 2024 and is projected to grow at a CAGR of 9.9% during the forecast period 2024-2034.
27 November 2023
Visiongain Publishes Magnesium Alloys Market Report 2023-2033
The global Magnesium Alloys market was valued at US$1,550.6 million in 2022 and is projected to grow at a CAGR of 7.3% during the forecast period 2023-2033
25 May 2023
Visiongain Publishes Steel Market Report 2021-2031
Growing urbanisation in emerging countries will aid infrastructure development in areas such as transportation and energy. The manufacturing and transportation sectors, which largely source and deliver raw materials for the fabrication of consumer goods, will benefit from economic success.
27 October 2021
Visiongain Publishes High Temperature Composite Resin Market Report 2021-2031
The penetration of lightweight composites in the development of advanced engine technology requiring high thermal stability fueled the growth of high temperature matrix systems.
19 July 2021
